
Tutorial | Geographic processors#
Get started#
Within the Prepare recipe, Dataiku has many geographic processors for working with geographic data. Let’s try out some of them!
Objectives#
In this tutorial, you will:
Create GeoPoints from coordinates of latitude and longitude.
Create a buffer area around a GeoPoint.
Reverse geocode locations.
Use geographic formula functions.
Compute the distance between two GeoPoints.
Prerequisites#
Dataiku 12.0 or later.
Reverse geocoding / Admin maps plugin (included by default on Dataiku Cloud).
Basic knowledge of Dataiku (Core Designer level or equivalent).
Create the project#
From the Dataiku Design homepage, click + New Project.
Select Learning projects.
Search for and select Geographic Processors.
If needed, change the folder into which the project will be installed, and click Create.
From the project homepage, click Go to Flow (or type
g+f).
Note
You can also download the starter project from this website and import it as a ZIP file.
Use case summary#
The project has three data sources:
tx |
Each row is a unique credit card transaction that has been either been authorized (a score of 1 in the authorized_flag column) or flagged for potential fraud (a score of 0). |
cardholders |
Each row is the latitude and longitude coordinates of a unique credit card holder. |
merchants |
Each row is the latitude and longitude coordinates of a unique merchant, all of which are gas stations. |
The Flow joins a small random sample of these three datasets together so that every record in tx_joined is a unique transaction, enriched with data about the location of credit card holders and merchants for that transaction.
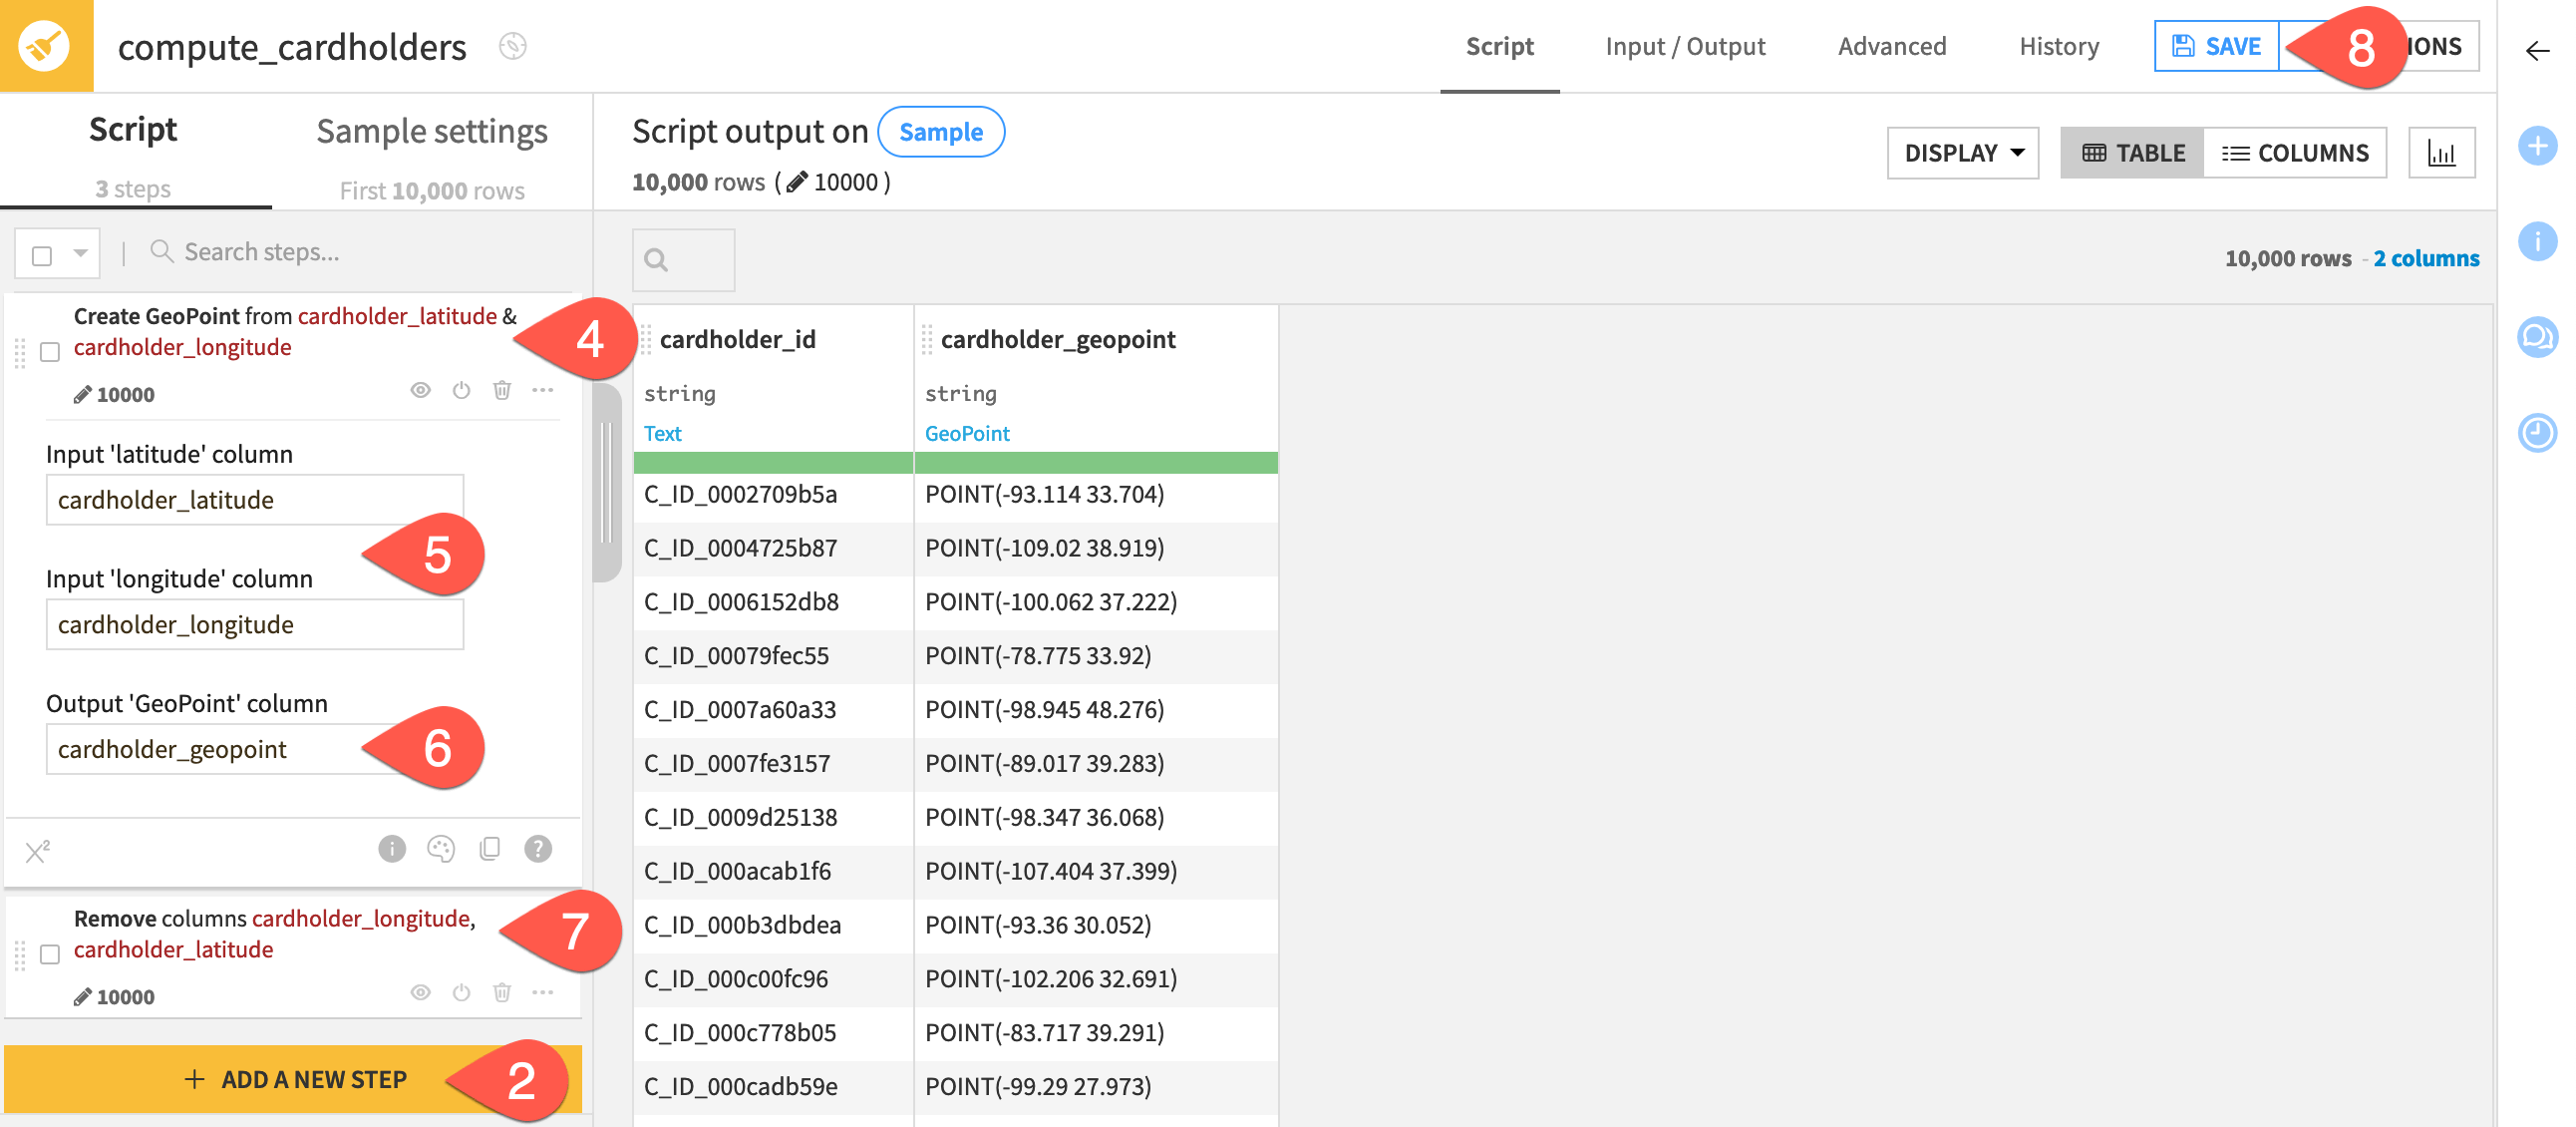
Create GeoPoints from lat-lon coordinates#
One of the first steps to working with geographic data is creating a GeoPoint. The most basic geographic data structure, a GeoPoint, identifies a specific point on the Earth’s surface according to a coordinate reference system (CRS). Its specific format allows for many geographic operations, such as mapping or distance computations.
The Flow contains latitude and longitude coordinates for both credit card holders and merchants. Let’s use these coordinates to create a first set of GeoPoints!
Open the Prepare recipe that creates the cardholders dataset.
Click + Add a New Step.
On the left, select the Geography section to observe all geo-related processors.
Select Create GeoPoint from lat/lon.
Provide
cardholder_latitudeandcardholder_longitudeas the input latitude and input longitude columns, respectively.Name the output GeoPoint column
cardholder_geopoint.Delete the original cardholder_latitude and cardholder_longitude columns so only two columns remain in the dataset.
Click Save and Update Schema.
Repeat the equivalent steps for the Prepare recipe that creates the merchants dataset. When finished, it should contain only merchant_id and merchant_geopoint.
Create a buffer around a GeoPoint#
A GeoPoint is the building block for more complex geographic data structures. For example, you can draw a circle around a GeoPoint to create a polygon. This kind of buffer area can often be useful for determining if other points or shapes are within or outside such zones.
In the Prepare recipe creating the merchants dataset, click + Add a New Step.
Select Create area around geopoint.
Provide merchant_geopoint as the input column.
Name the output column
merchant_bubble.Set the radius of the buffer circle to be
10kilometers.Click Save and Update Schema.
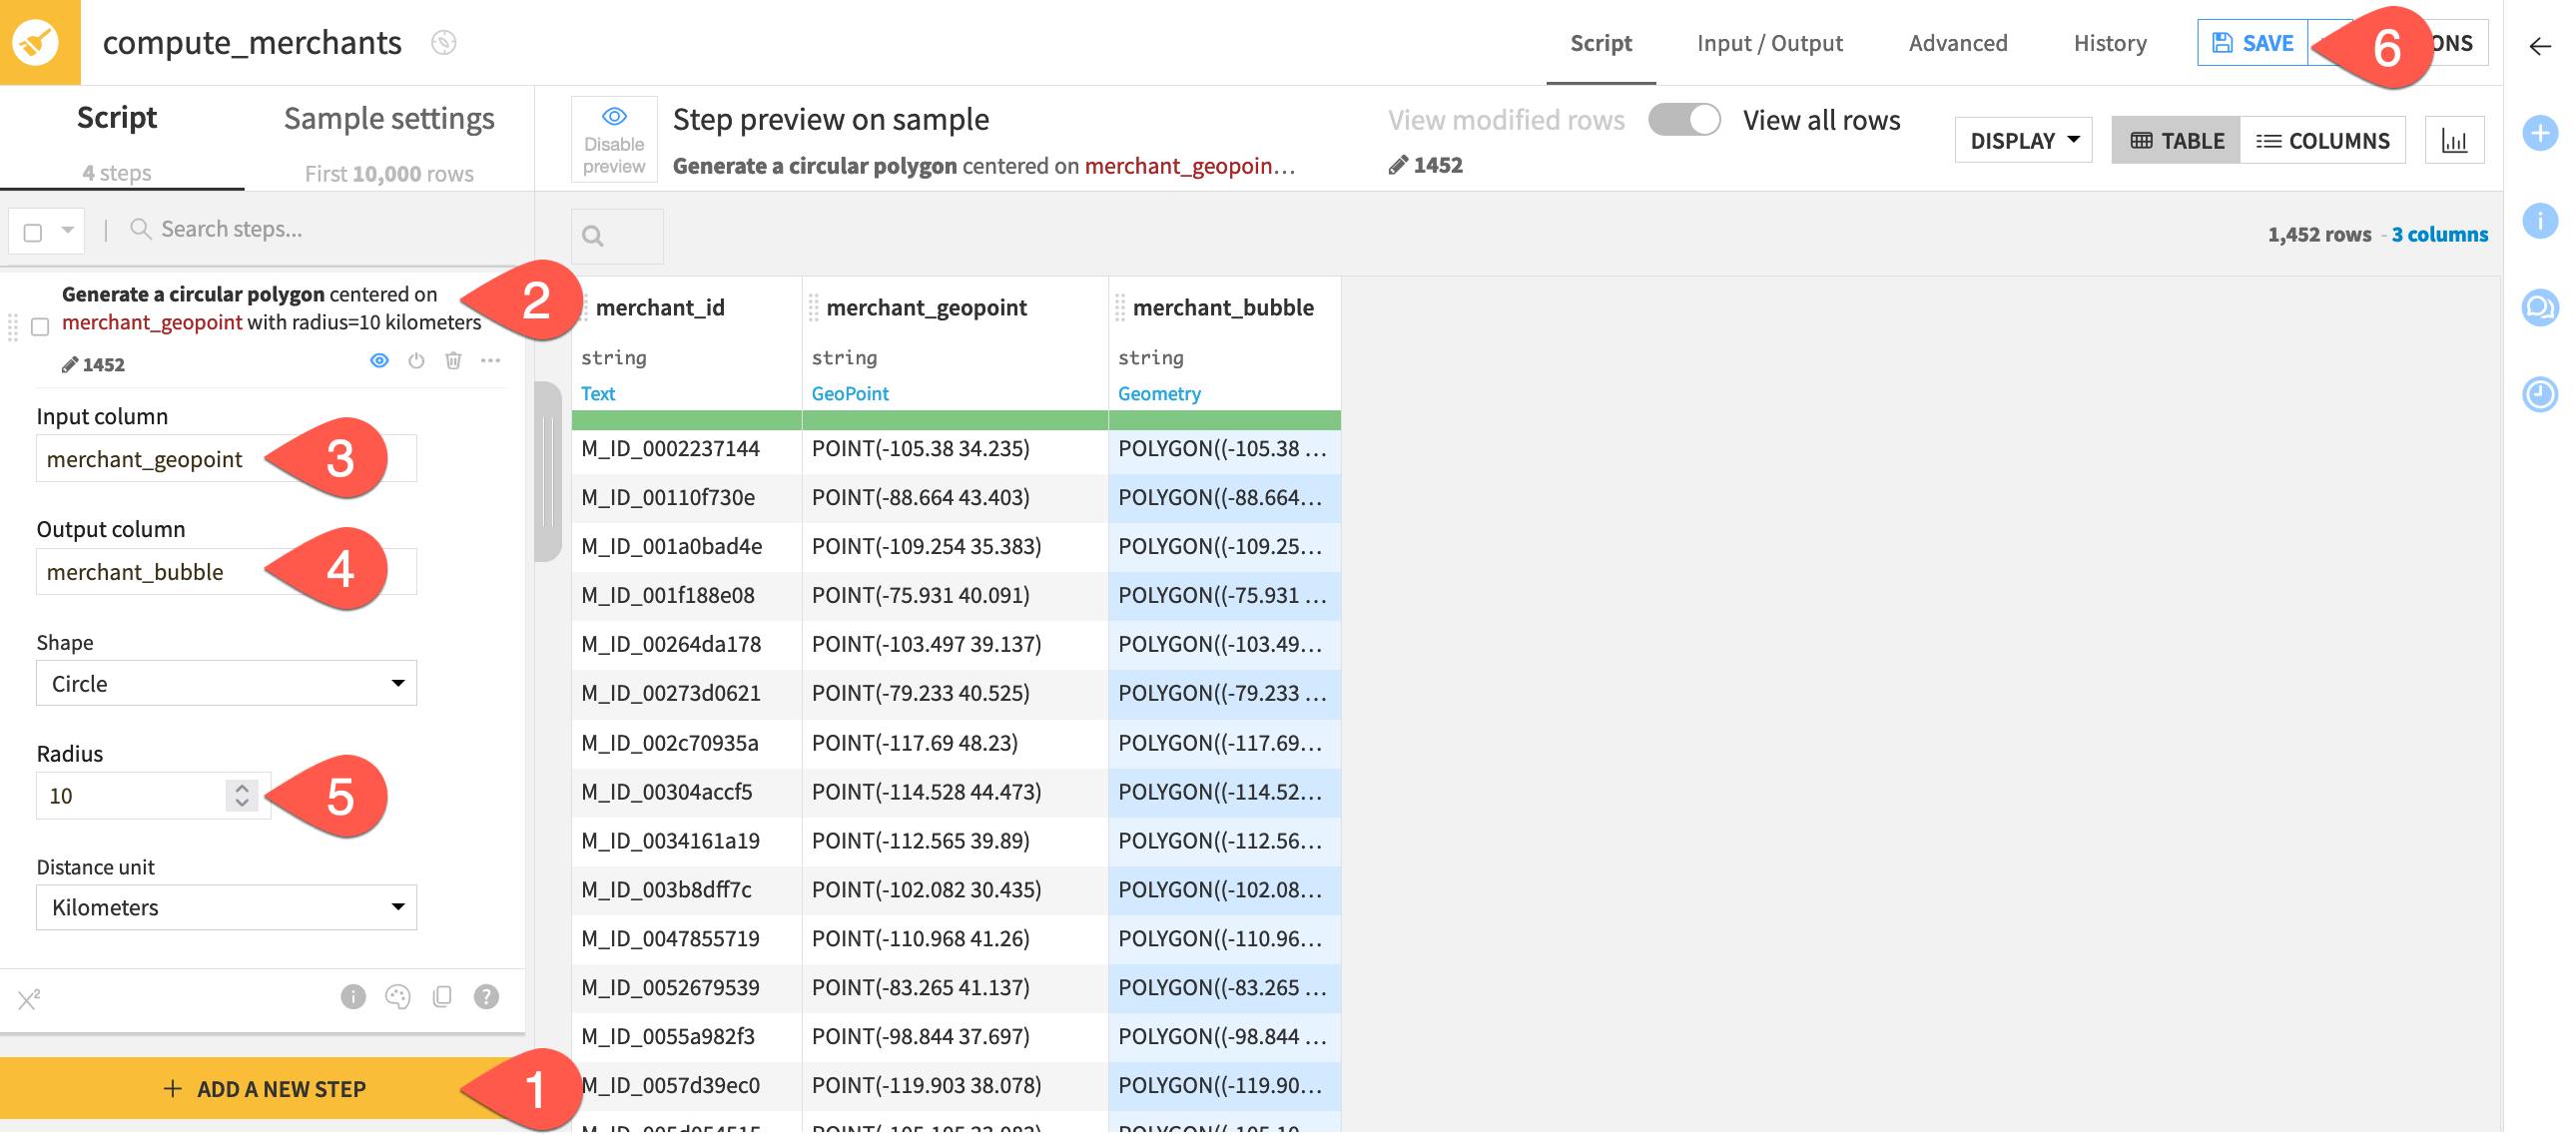
Important
Note the GeoPoint and Geometry meanings that Dataiku has detected for the merchant_geopoint and merchant_bubble columns, respectively. You’ll need these meanings to use the column for geographic operations.
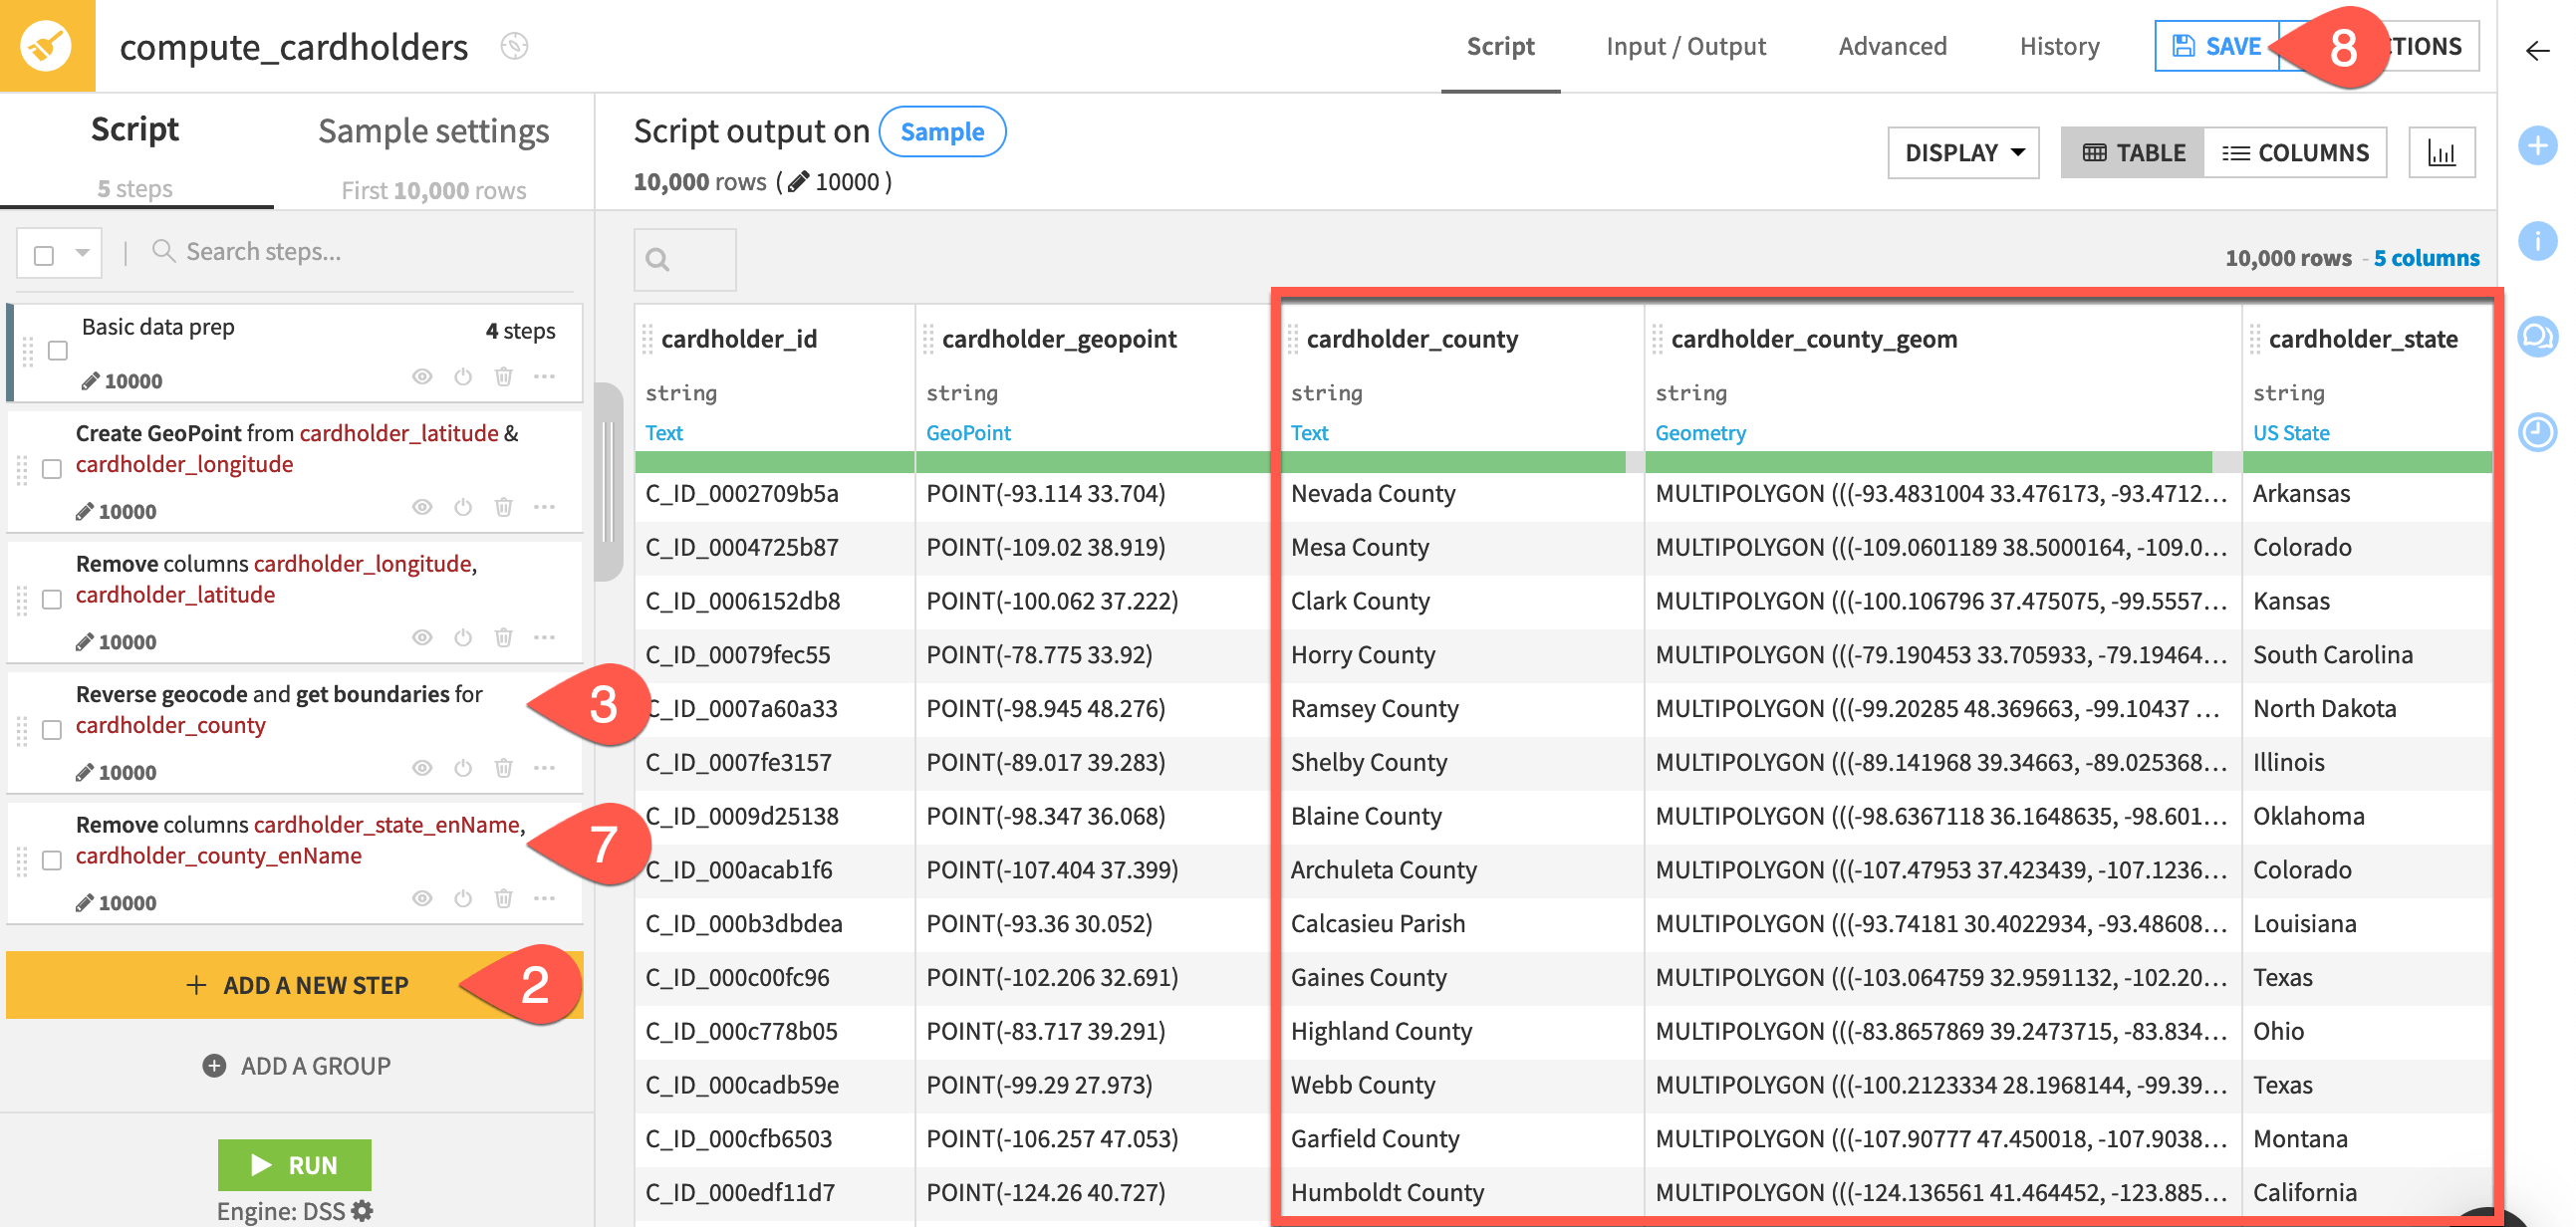
Reverse geocode locations#
Another common geographic task you often need to perform is geocoding. This could be taking one piece of geographic information — like an address — and returning lat-lon coordinates. In this case, you already have coordinates, so let’s do the reverse operation!
Return to the Prepare recipe that creates the cardholders dataset.
Click + Add a New Step.
Select Reverse geocoding.
Provide cardholder_geopoint as the input column.
Provide
cardholder_countyandcardholder_statefor output levels 6 and 4, respectively.Select the box to Output polygon coordinates for the smallest selected administrative area.
Delete the cardholder_state_enName and cardholder_county_enName columns so five columns remain.
Click Save and Update Schema.
Note
For more geocoding options (including forward geocoding), see the Geocoder plugin.
Preview geometries#
The cardholder_county_geom column contains a new type of geometry: a multipolygon. It can be helpful to preview geometries like this directly in the dataset’s Explore tab (or in the Prepare recipe).
In the same Prepare recipe, click on a cell in the cardholder_county_geom column.
Click Preview in the popup menu.
Explore the geometry’s map in the popup window.
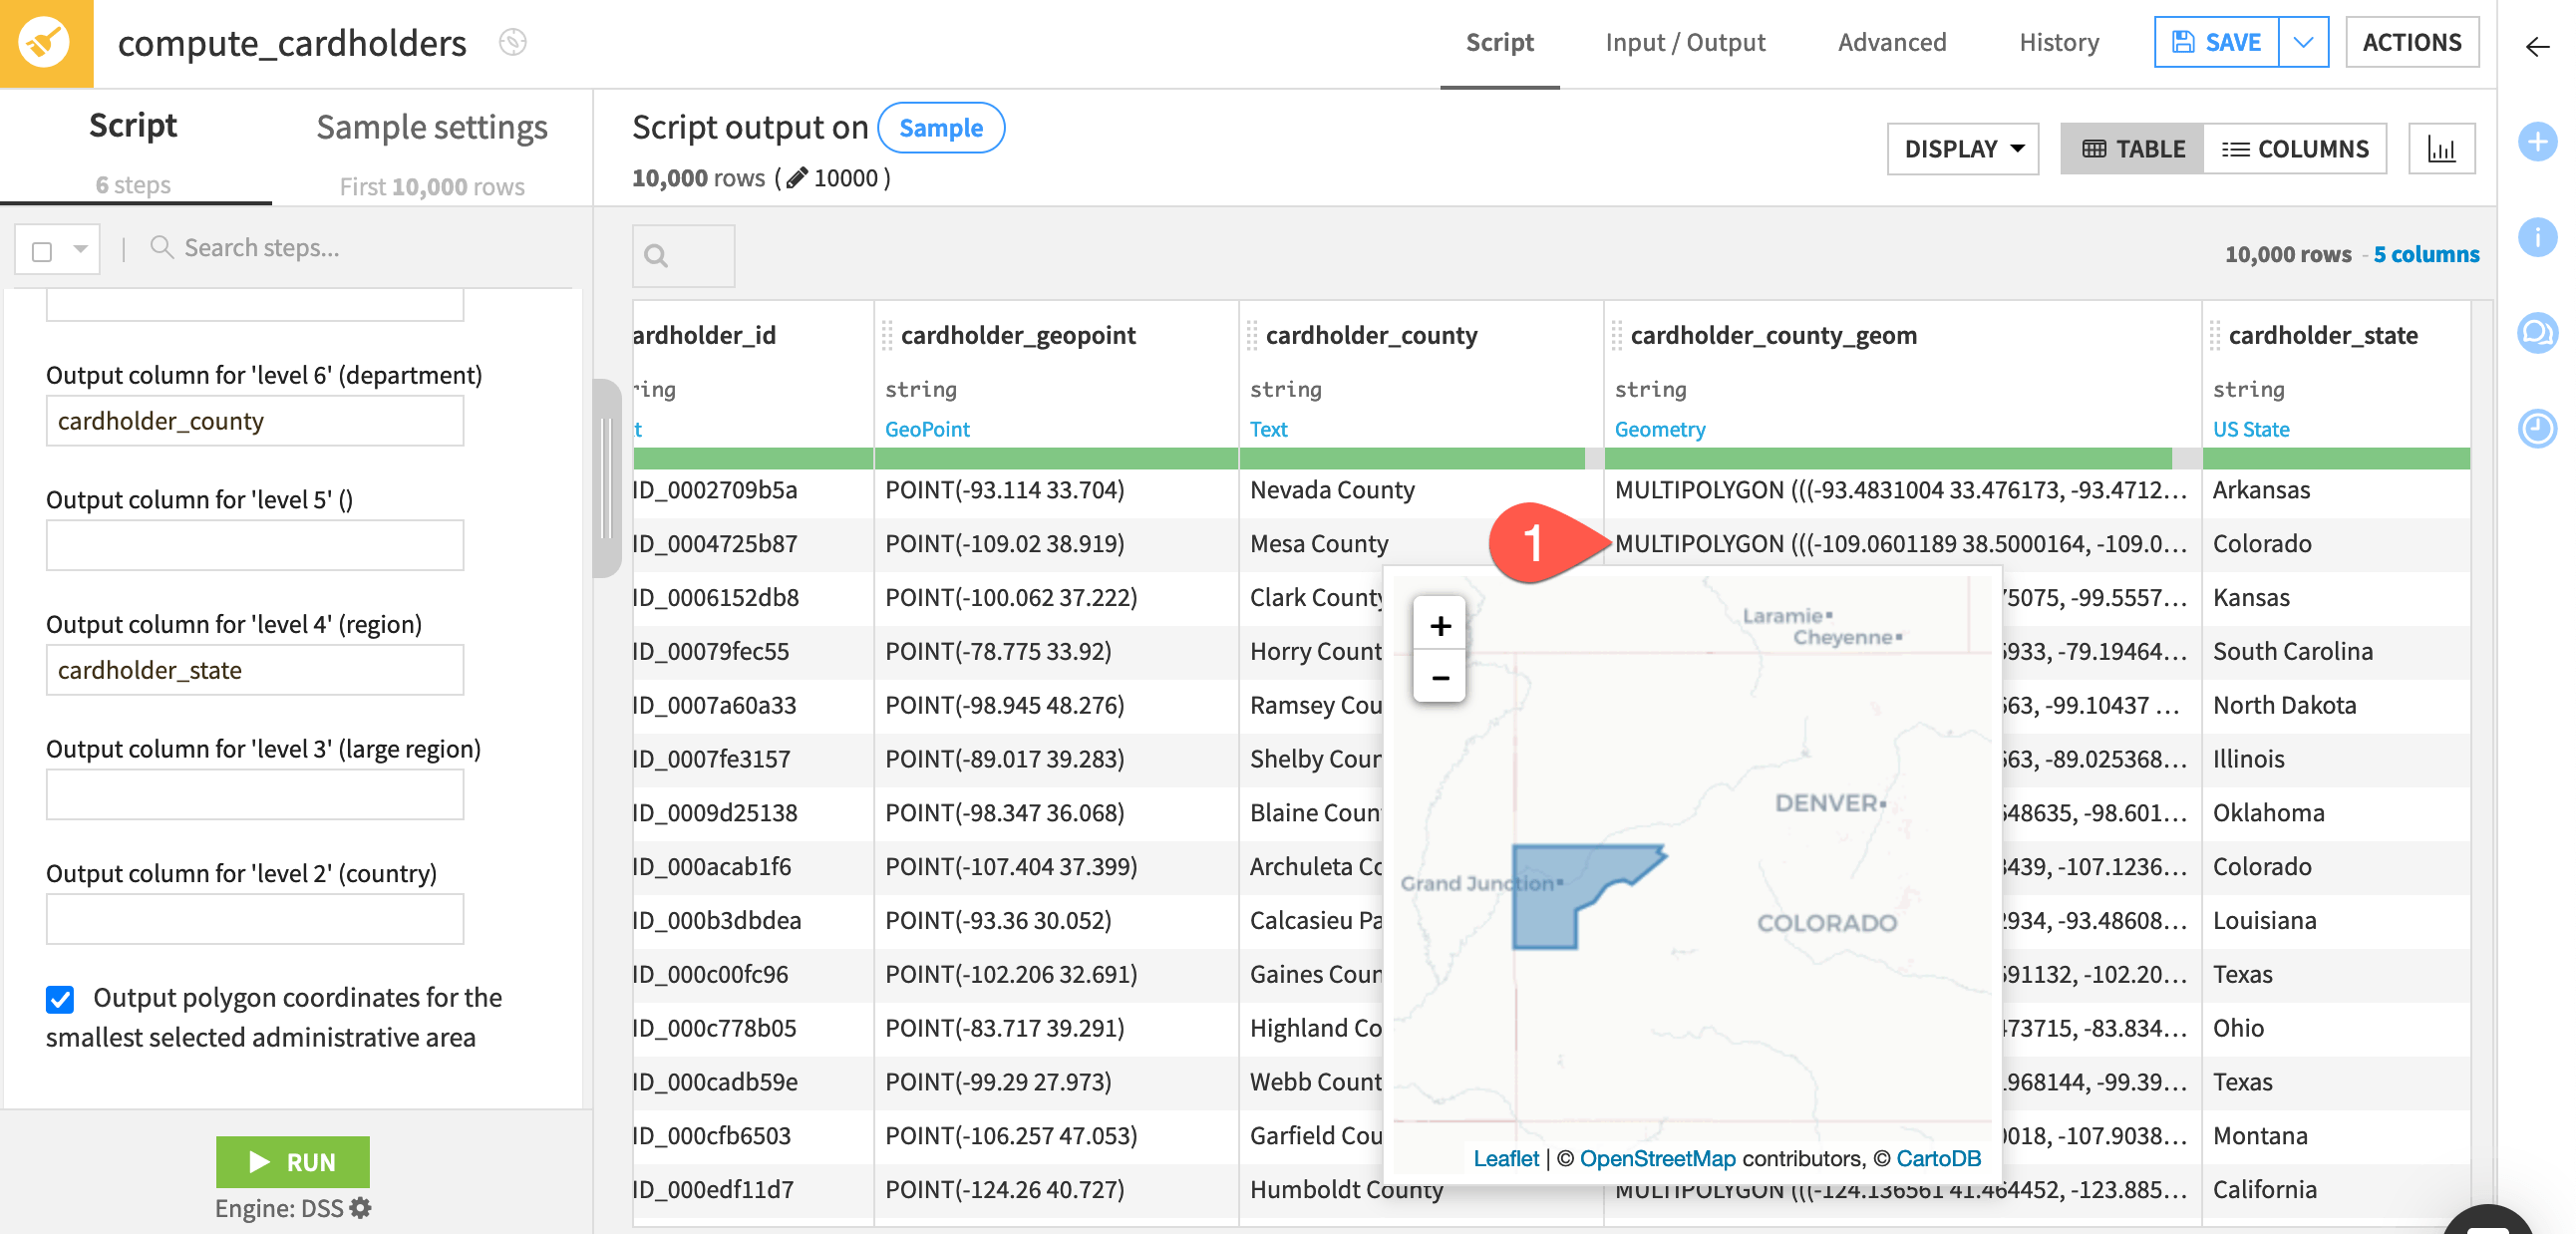
Tip
You may notice a few empty values for the county columns. Geocoding is often an imperfect process! Filter for empty values, and use the preview function shown here to examine why no county may have been returned.
Use geographic formula functions#
In addition to a set of geographic processors, Dataiku also has a set of geographic formula functions, similar to those found in PostGIS, a PostgreSQL extension that implements standards from the Open Geospatial Consortium.
For example, geometries (such as those representing state boundaries) are an aggregation of a series of many GeoPoints. Accordingly, their size can be large! However, depending on the objective, you often may not need such a high level of detail. In this case, you can simplify the geometry.
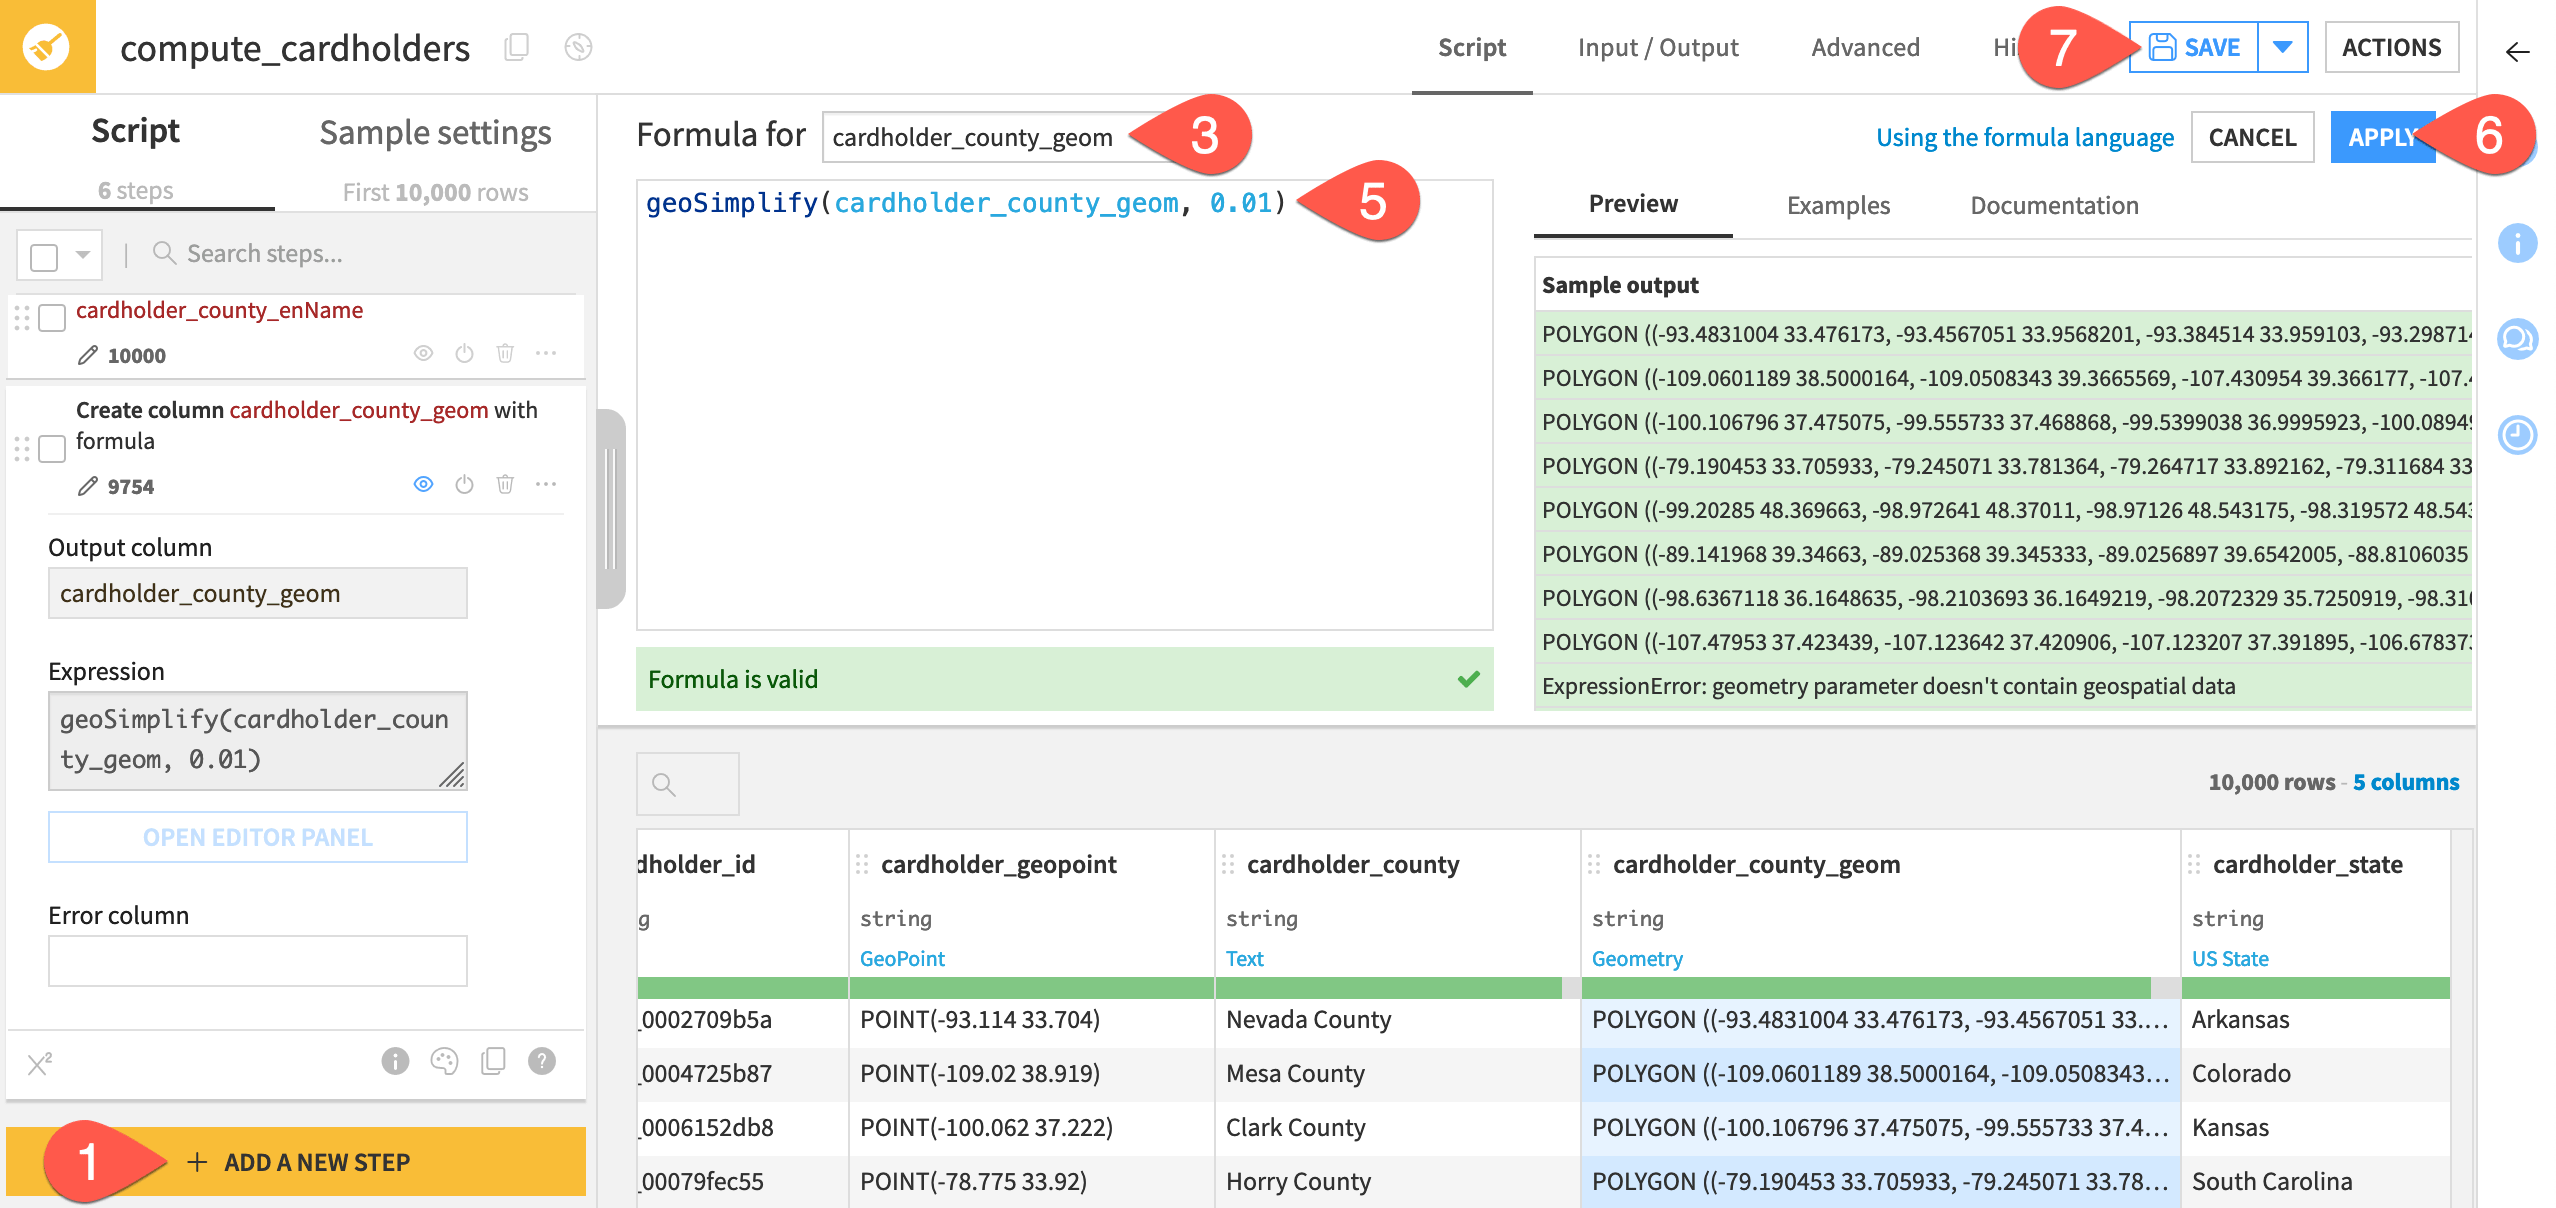
In the same Prepare recipe, click + Add a New Step.
Select Formula.
For Formula for, provide the existing
cardholder_county_geomas the output column.Type
geoto see the available geographic functions.Provide the formula
geoSimplify(cardholder_county_geom, 0.01)to reduce the complexity of the geometry.Click Apply.
Click Save.
Important
Compare the preview for a few counties with and without this step. How far in do you need to zoom before the difference is noticeable? Then, from the dataset’s Details tab, compare the size with and without this step to see the impact of simplifying the geometry.
Compute the distance between two GeoPoints#
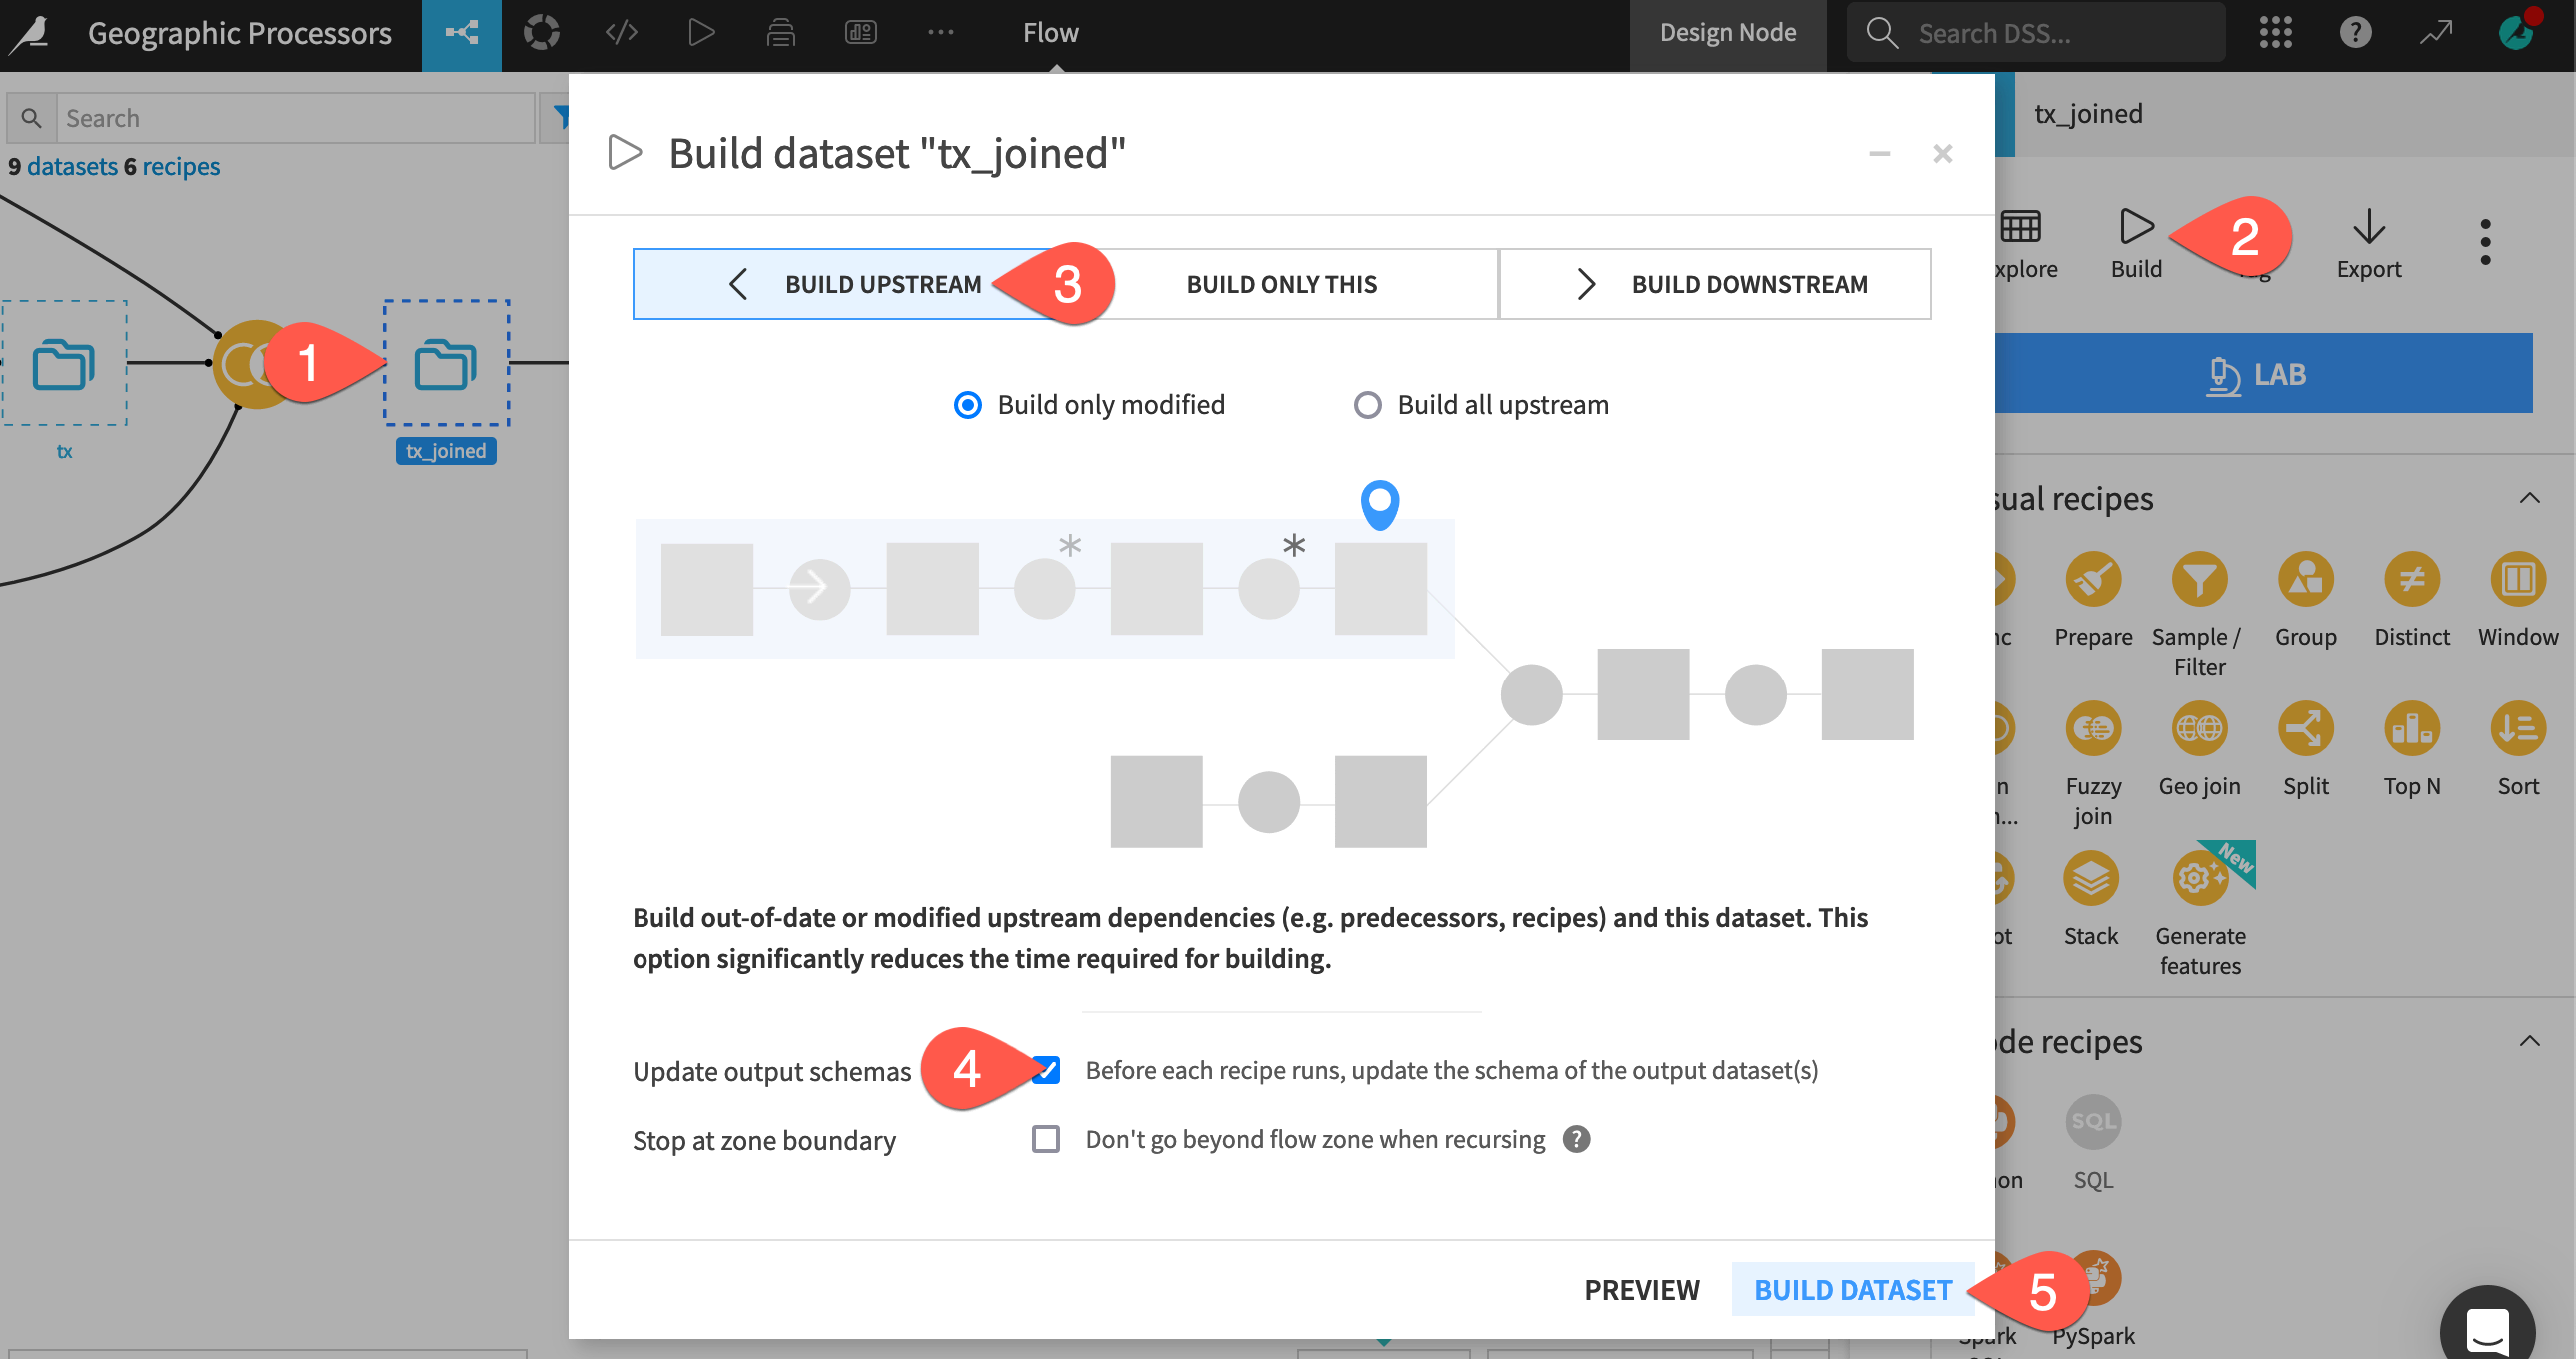
Now that you have GeoPoints for both the cardholders and the merchants, let’s calculate the distance between them. First, you’ll need to join this data together. The Flow already includes a Join recipe to do this. You just need to re-run it to pick up the new columns in the Join recipe output.
From the Flow, select tx_joined.
In the Actions tab of the right panel, click Build.
Select the Build Upstream tab in the dialog.
Select the box to Update output schemas.
Click Build Dataset.
Tip
As instructed above, be sure to update the schema before building! Without updating, the tx_joined dataset will still have columns such as cardholder_latitude and cardholder_longitude instead of cardholder_geopoint. If this is unfamiliar, explore the resources on build modes to learn more.
Now for every transaction, you have the location of the cardholder and the merchant. Let’s compute the distance between these two points!
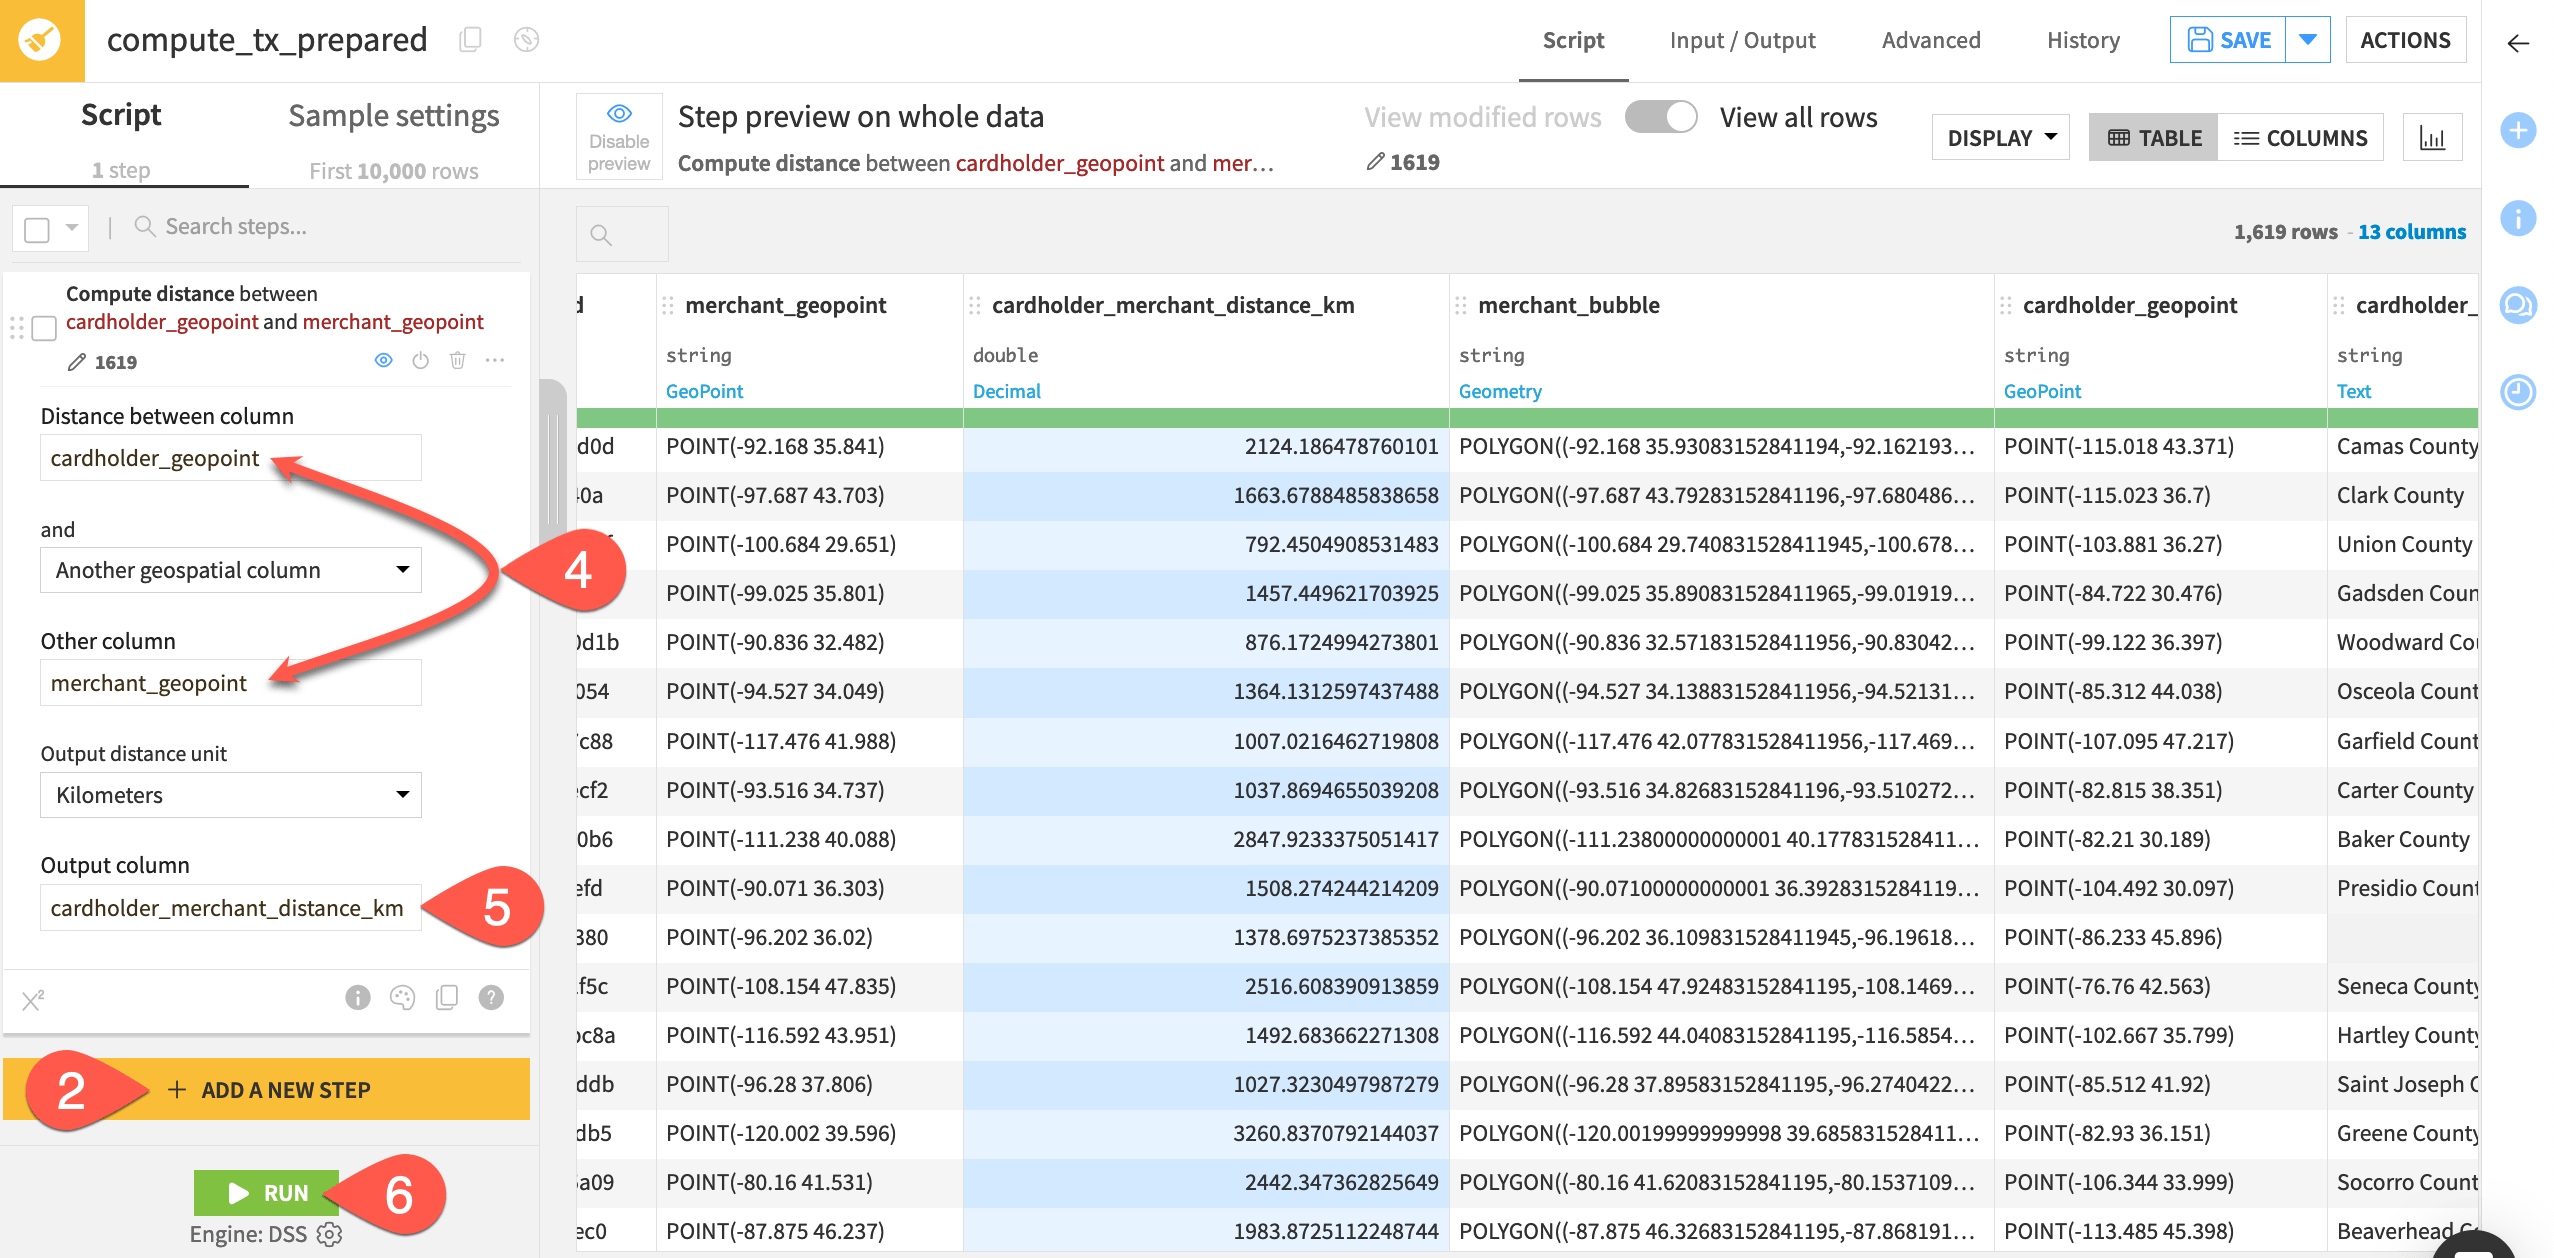
Open the Prepare recipe that computes the tx_prepared dataset.
Click + Add a New Step.
Select Compute distance between geospatial objects.
Provide cardholder_geopoint and merchant_geopoint as the two columns.
Name the output column
cardholder_merchant_distance_km.Click Run to execute the recipe.
Tip
Use the Analyze tool in the column header of the new distance column. The typical distance between a cardholder and a merchant (which are all gas stations) seems unexpected!
Next steps#
Congratulations! You’ve used a range of visual processors to create the building blocks for geographic data analysis.
See also
For more information on geographic processors, see the reference documentation on Geographic data preparation.
Once you have GeoPoint and geometry data structures, you’ll want to visualize them on a map. You can do that next in Tutorial | No-code maps!
Tip
You can find this content (and more) by registering for the Dataiku Academy course, Geospatial Analytics. When ready, challenge yourself to earn a certification!