
Tutorial | Working with shapefiles and US census data#
Get started#
Shapefiles are one of the most common formats for geographic data. Let’s get started using them in Dataiku!
Objectives#
In this tutorial, you will:
Import shapefiles and US census data into Dataiku.
Join spatial and demographic data.
Visualize the results on a map.
Prerequisites#
A self-managed instance of Dataiku 12.0 or later; Dataiku Cloud isn’t compatible.
Create the project#
Let’s get started!
From the Dataiku Design homepage, click + New Project > Blank project.
Name it
Working with shapefiles.Click Create.
From the project homepage, navigate to the Flow (
 ) from the top navigation bar (or use the keyboard shortcut
 g+f).
The shapefile format#
When working with spatial or geographic data, you will encounter many different types of file formats. These might include .geojson, .gpkg, .csv, and .tiff. One of the most common though is the shapefile, initially created by ESRI.
Although often referred to as a singular file, a shapefile is actually a collection of typically four (and potentially other) files (.shp, .shx, .dbf, and .proj).
Together, these files can spatially describe vector features such as points, lines, polygons, and multipolygons.
Download shapefiles#
The example data for this exercise is TIGER/Line Shapefiles from the US Census Bureau. They contain official 2019 US county borders among some other information.
Download the zip file at this URL through your browser: https://www2.census.gov/geo/tiger/TIGER2019/COUNTY/tl_2019_us_county.zip
Upload shapefiles#
Dataiku provides built-in support for ESRI Shapefiles. Upload the shapefiles you’ve just downloaded.
From the Flow, click + Add item.
Select Upload.
Click Select Files.
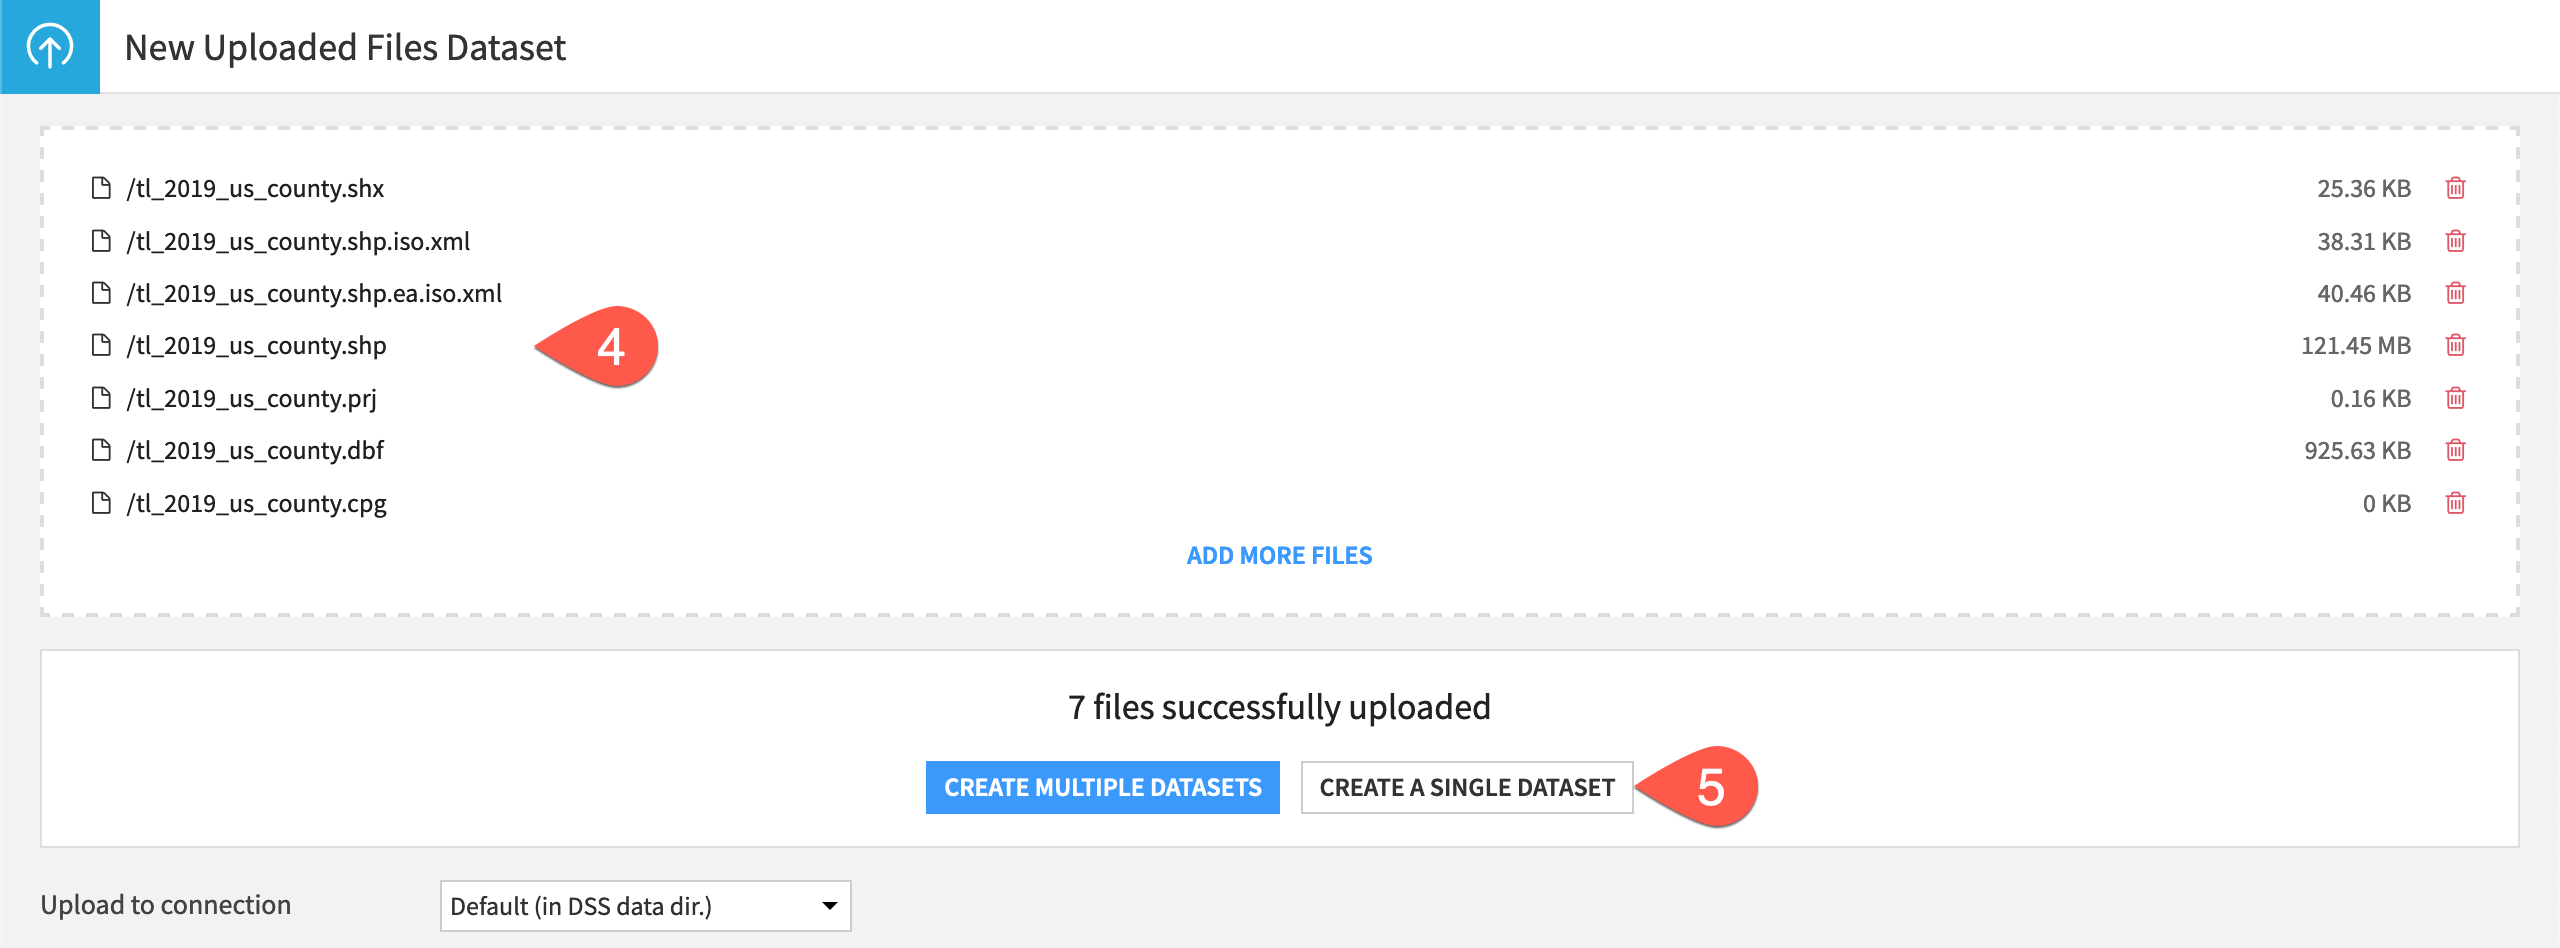
Select the locally downloaded ZIP file from above. Dataiku can extract the files in the ZIP folder for you.
Click Create a Single Dataset.
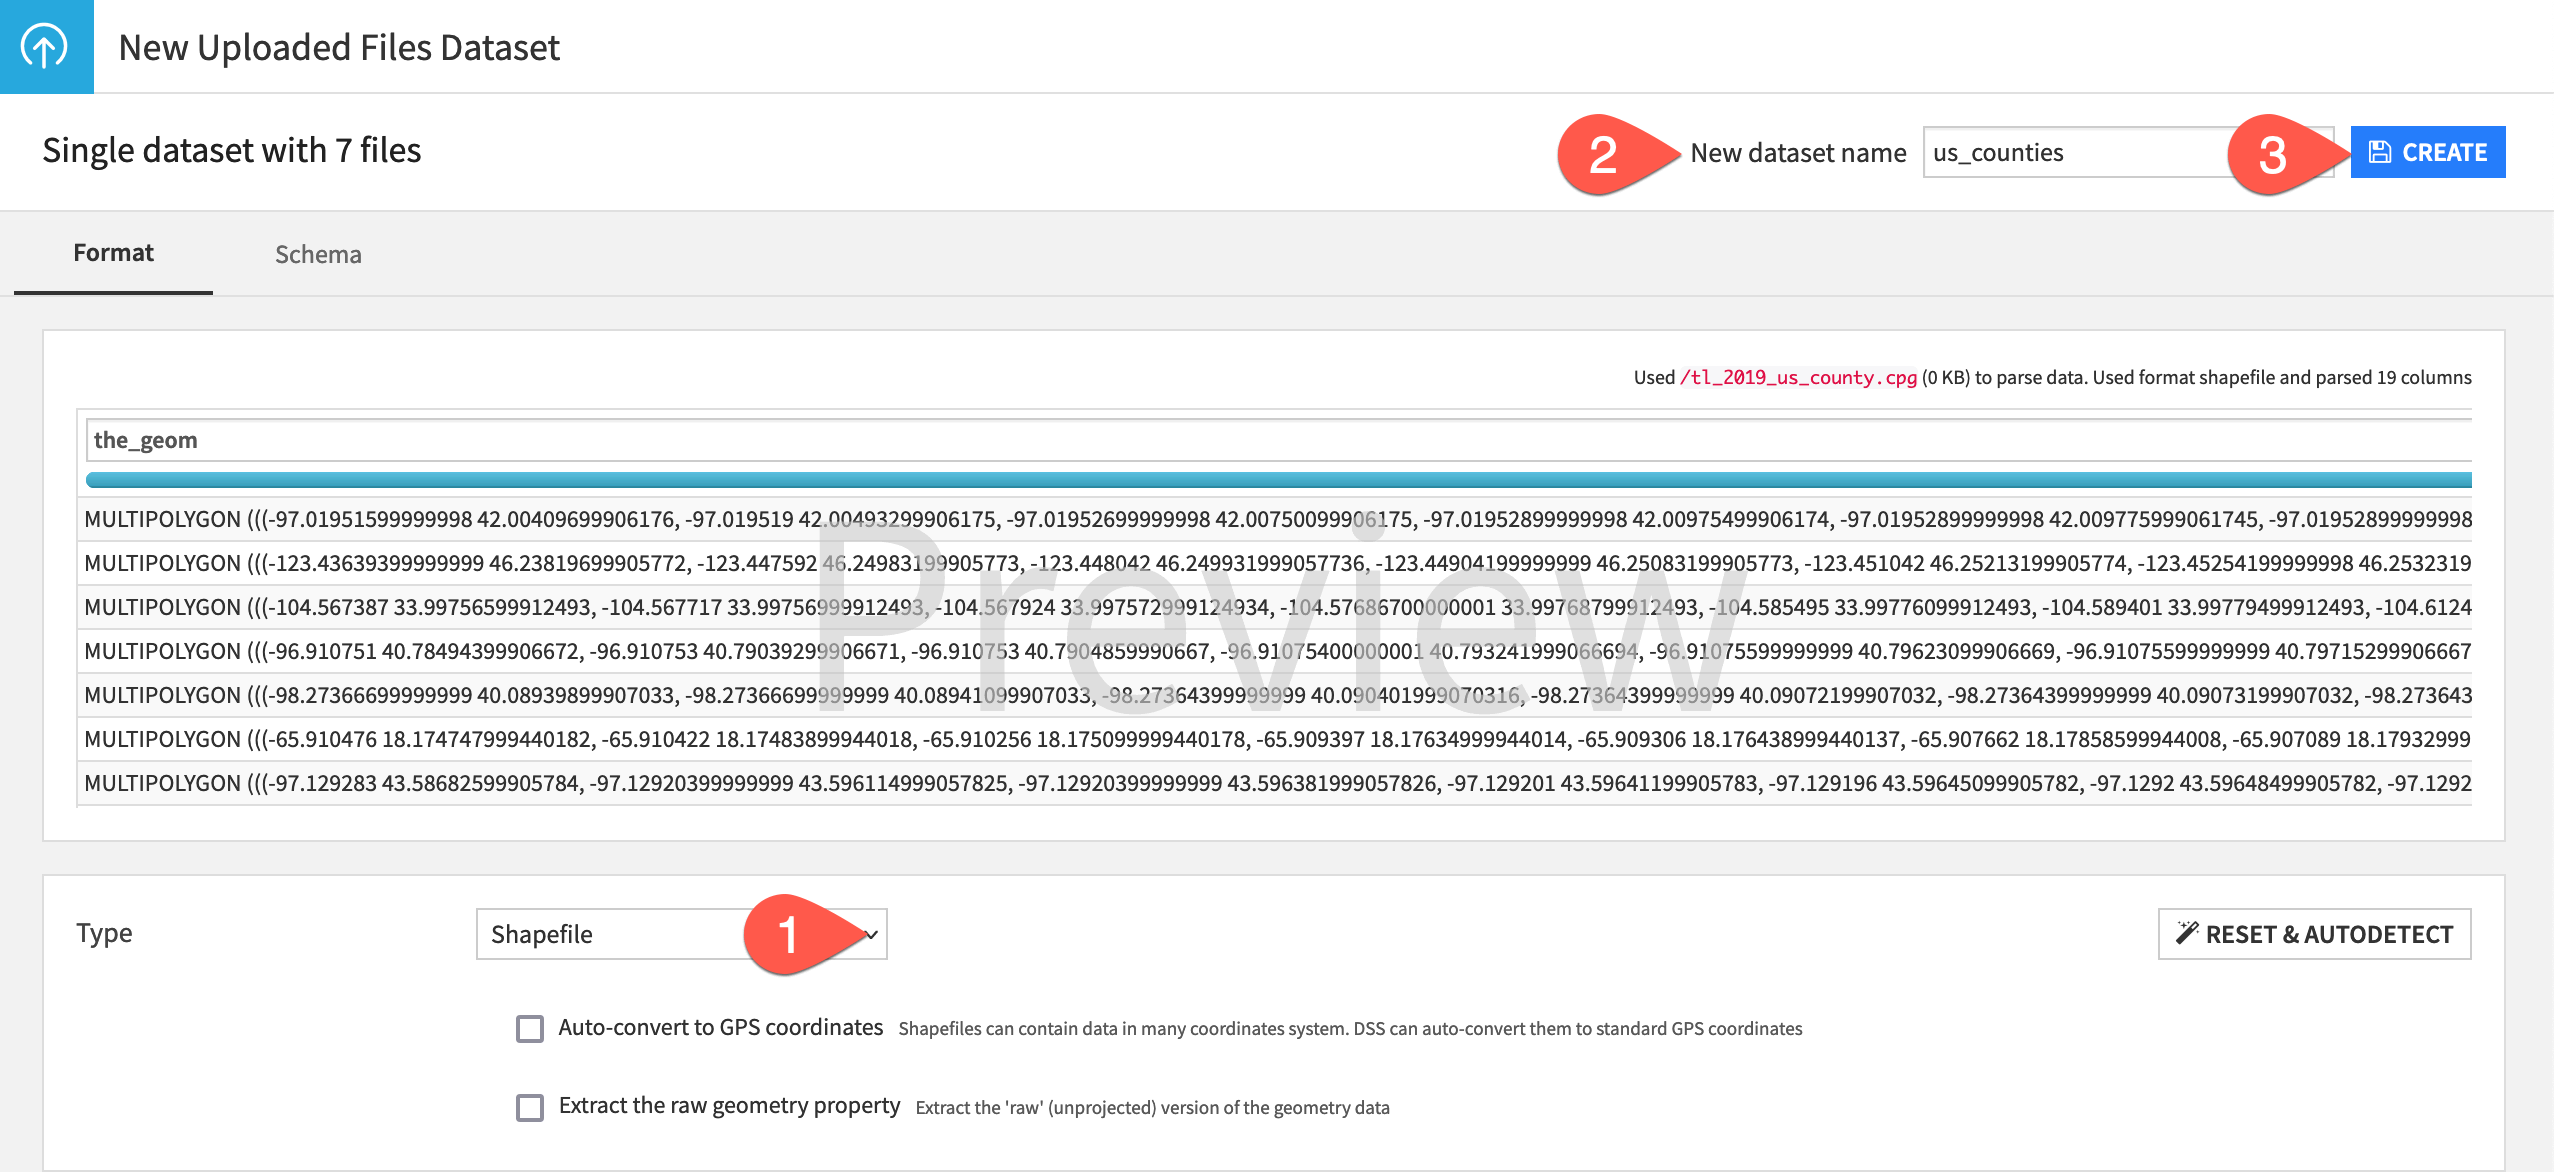
Now you have to adjust the file type before creating the dataset.
On the Format subtab, select Shapefile as the file type.
Name it
us_counties.Click Create.
Explore shapefiles#
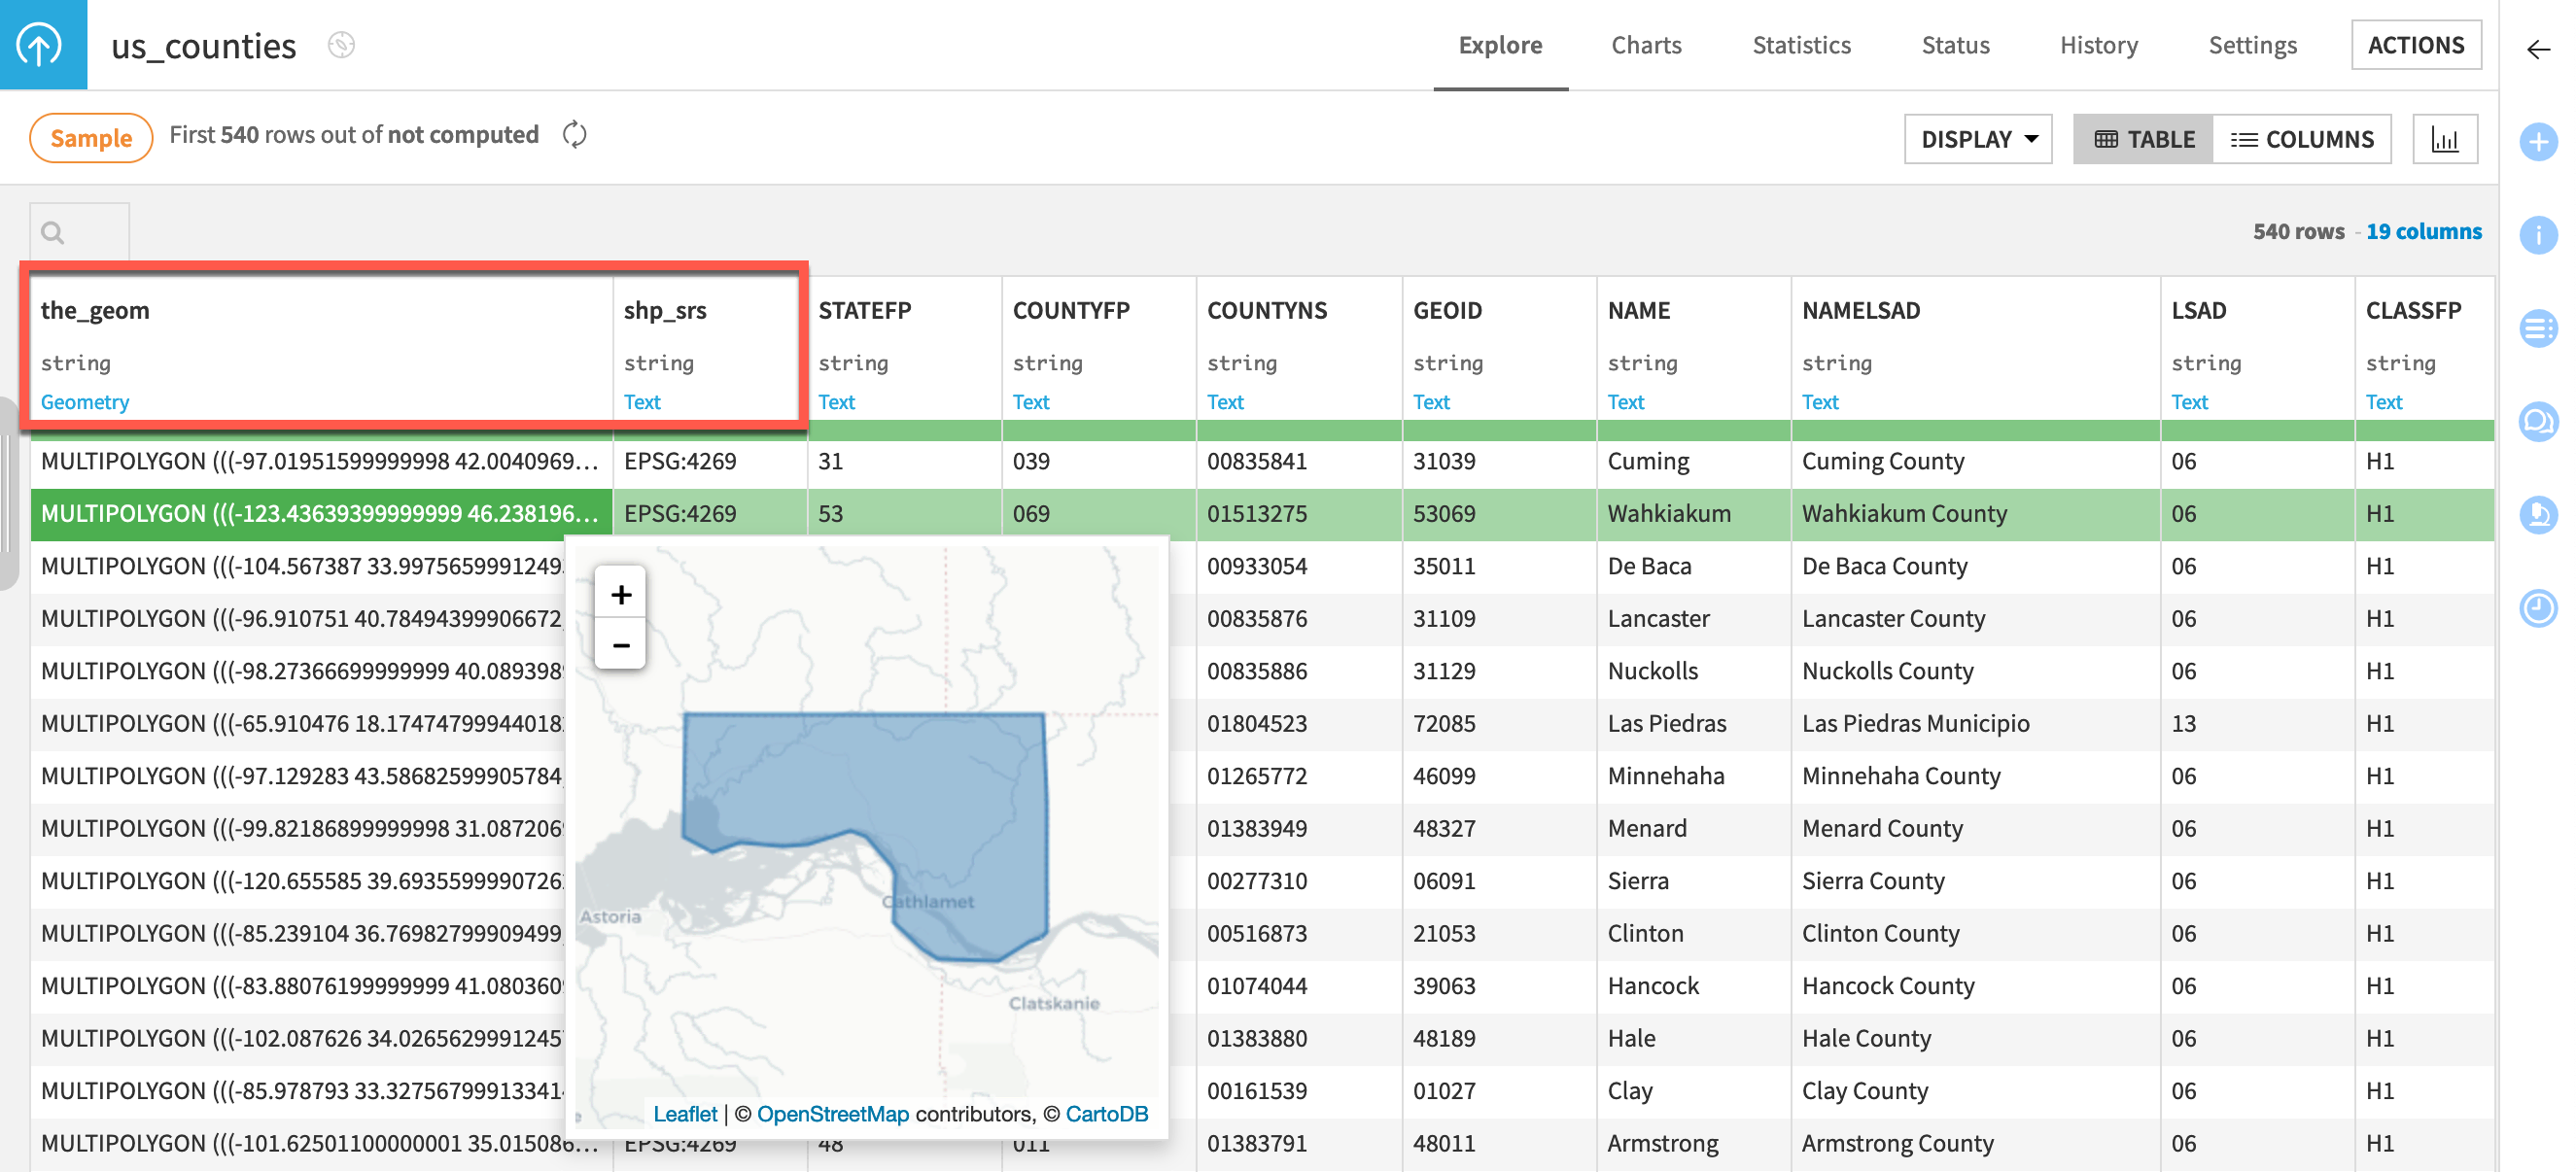
After importing the dataset, the Explore tab shows a preview of the data in a tabular format.
The first column, the_geom, specifies the dataset’s geometry. It’s stored as a string, but Dataiku can interpret its meaning to be Geometry. Each row, a county, is stored as a multipolygon. Right-clicking on a cell value opens a menu including Preview, which opens a map of the geometry.
The second column, shp_srs, specifies the dataset’s Spatial Reference System (SRS), also known as a Coordinate Reference System (CRS). A spatial reference system defines how the spatial elements of the data relate to the Earth’s surface. In this case, the dataset uses one of the most common geographic SRS,
EPSG:4269.
Filter shapefiles in a visual recipe#
You can manipulate shapefiles in Dataiku like any other dataset. Let’s use them in a visual recipe.
From the us_counties dataset, open the Actions tab of the right panel, and select Sample/Filter recipe.
Name the output dataset
nj_counties.Click Create Recipe.
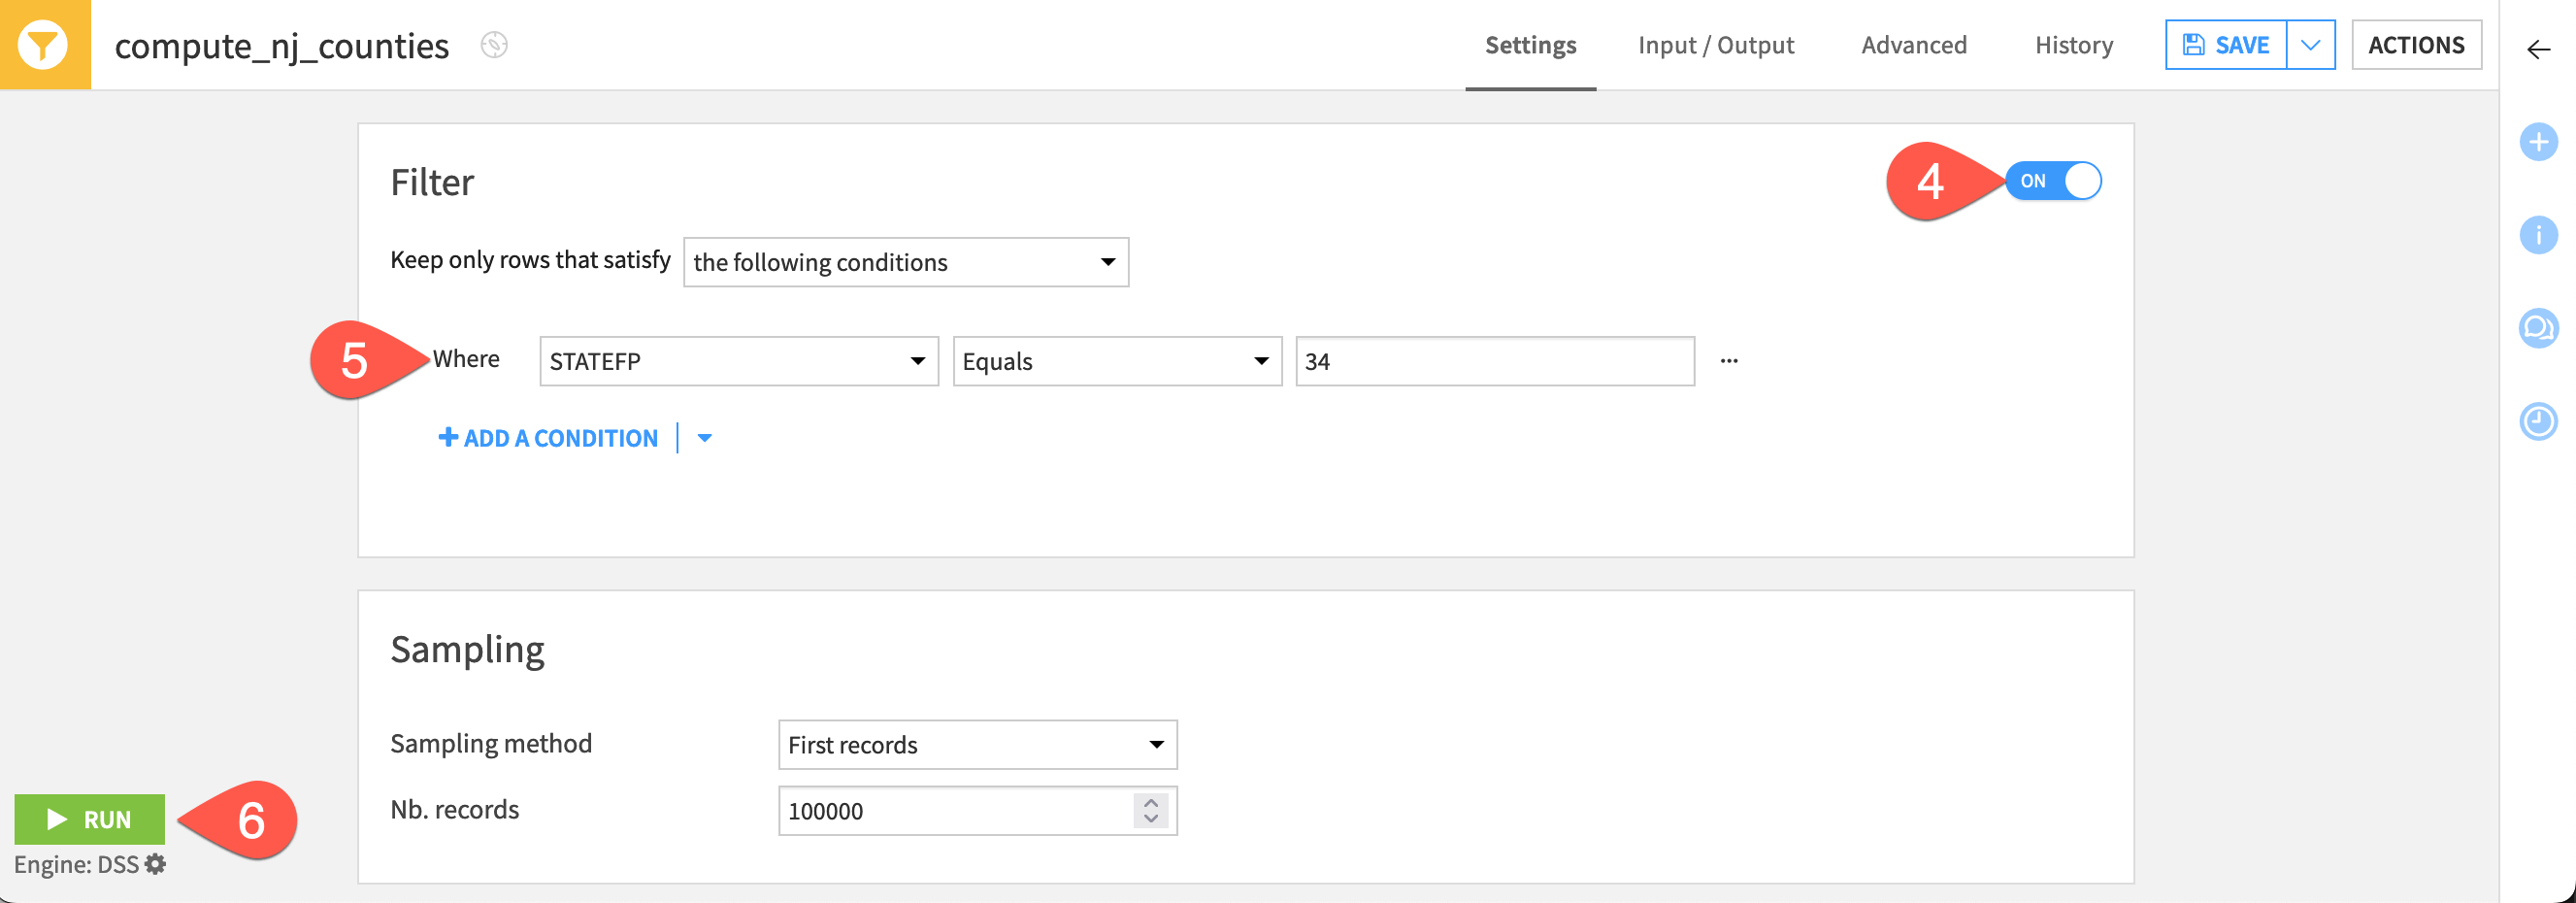
Turn the Filter tile On.
Filter the dataset to keep only rows where STATEFP equals
34(the FIPS code for the state of New Jersey).Click Run.
Tip
If you receive an error about shapefiles not being supported on non-filesystem datasets, go to the Advanced tab of the recipe. Change the container configuration to None - Use backend to execute.
After running the recipe, note that the output dataset now has 21 rows, one for each county in New Jersey.
Note
An alternative way to achieve this result would be to use the Filter rows/cells on value processor in a Prepare recipe, especially if there was more data preparation to be done.
Download US census data#
You now have a dataset where each row holds the shape of a county in New Jersey. As of now though, there is no demographic data attached to the counties.
The Census USA plugin has a number of features relating to census data, including an easy way to download data from the US Census Bureau.
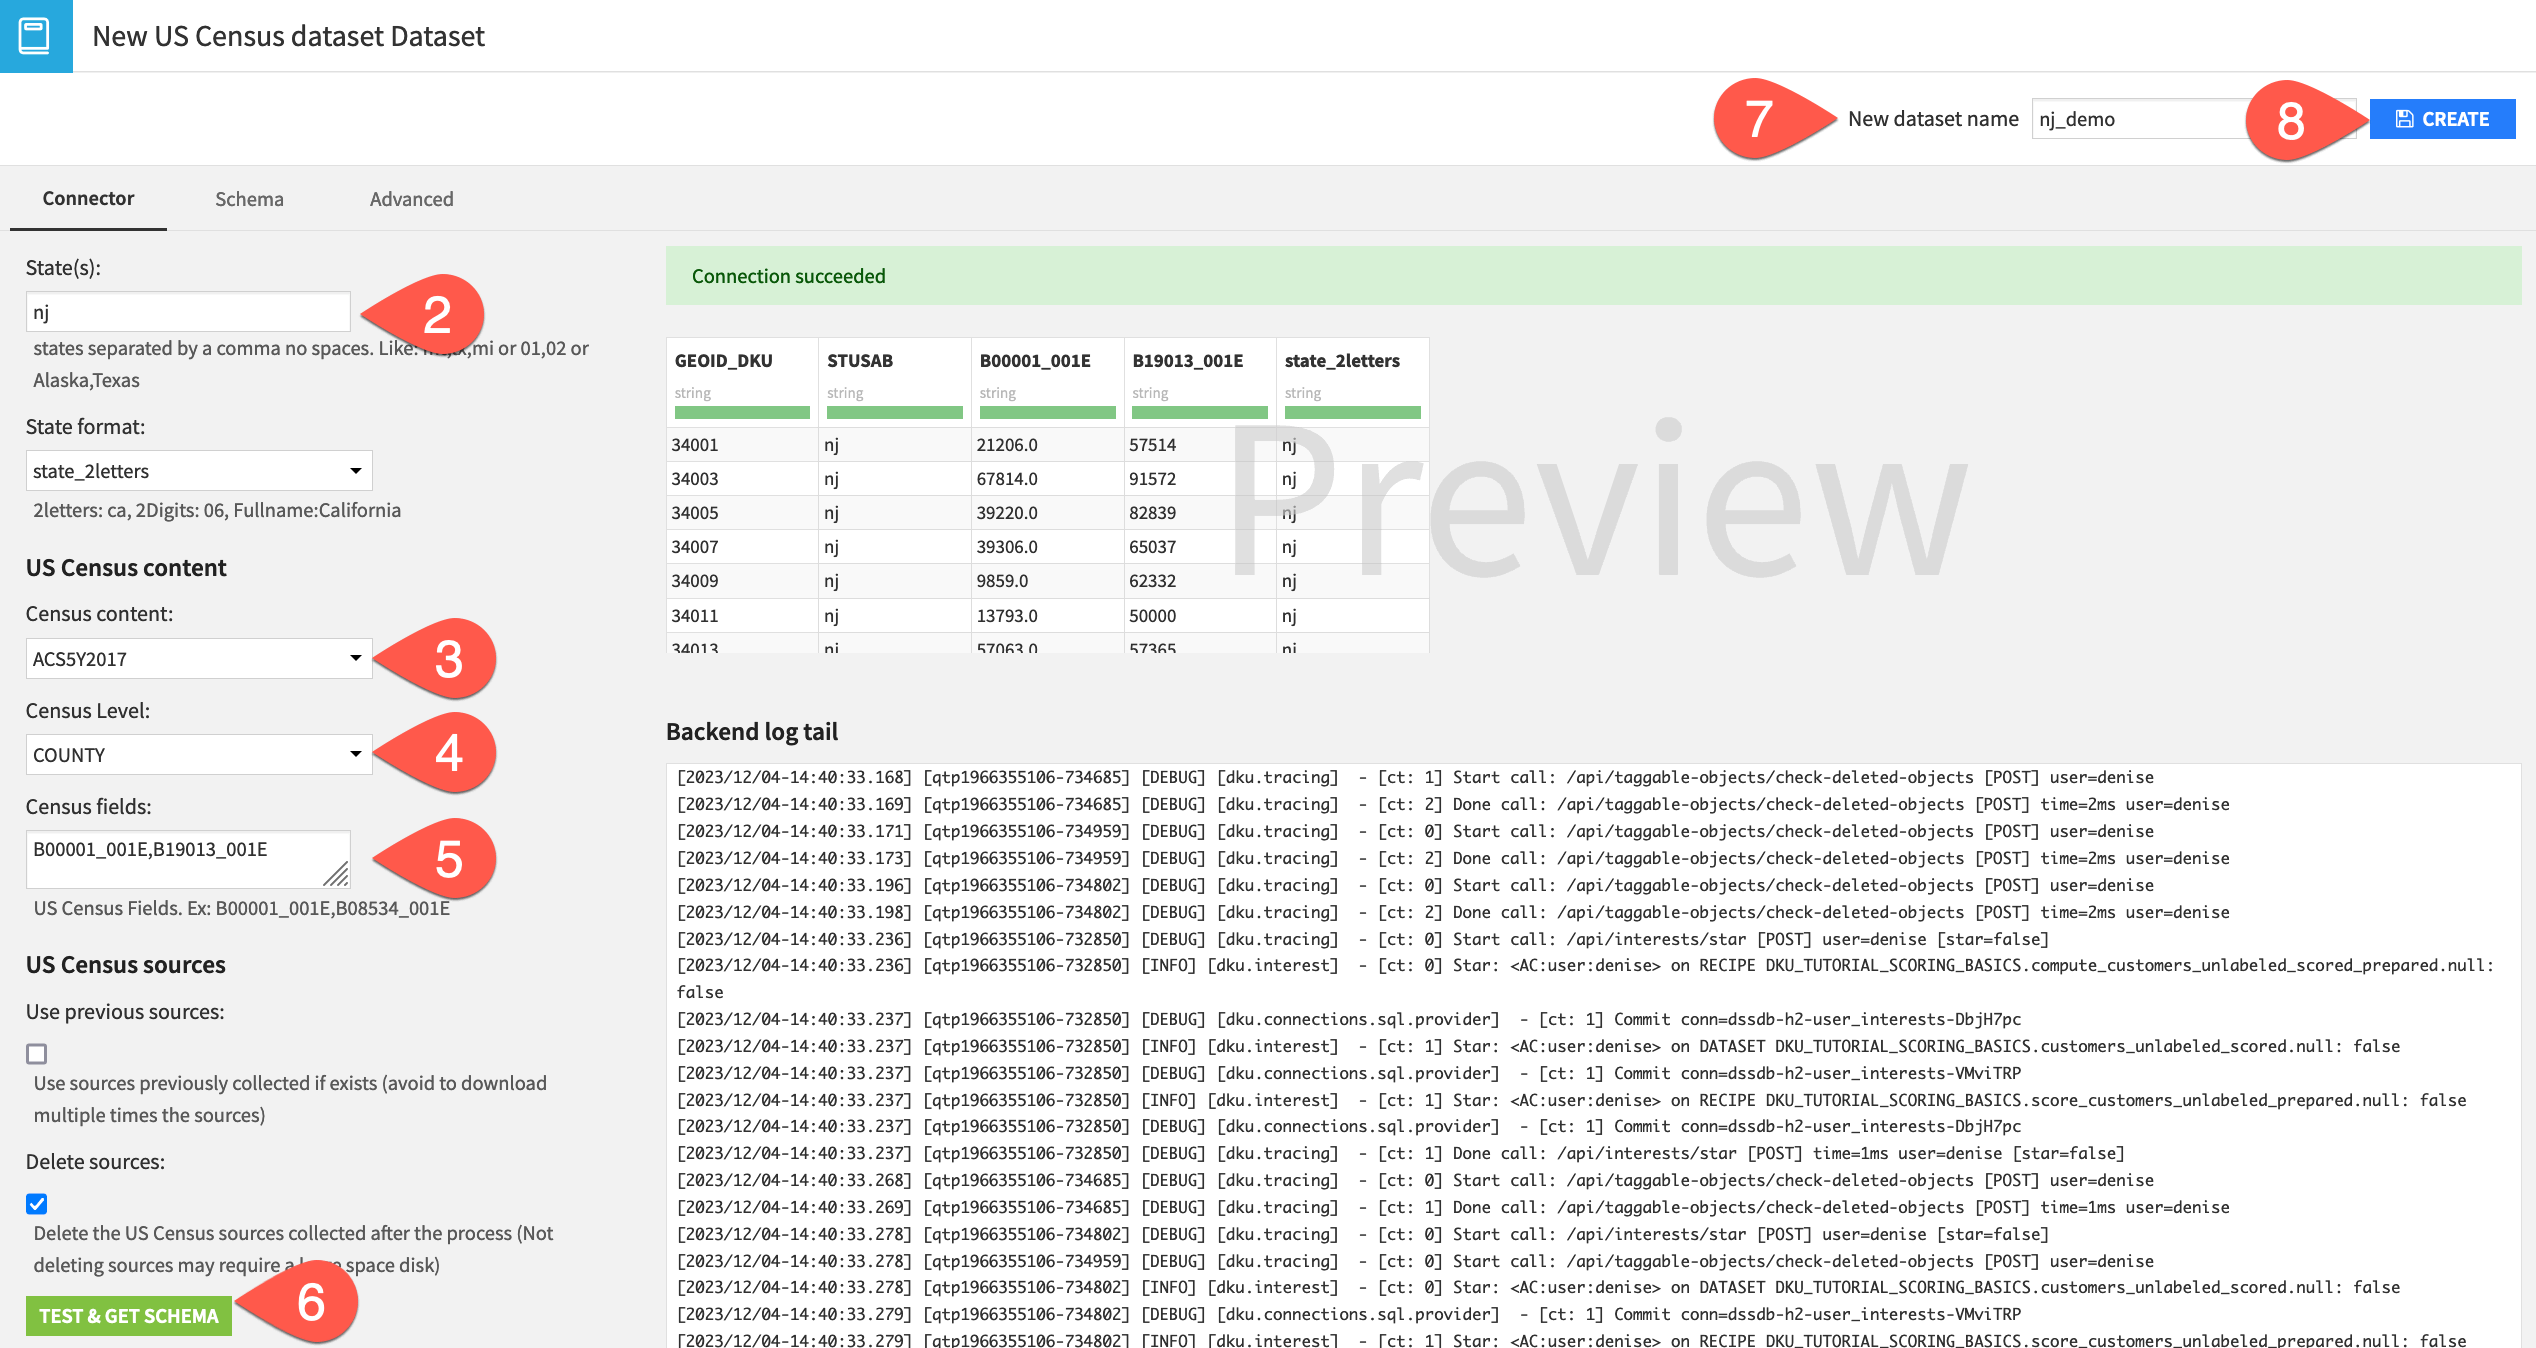
From the Flow, select + Add Item > Connect or create > Census USA > US Census dataset.
For the State, provide
nj. Ensure State format is state_2letters.Select ACS5Y2017 as Census content.
Select COUNTY as Census level.
The Census field is a string of variables (without spaces). Add
B00001_001E,B19013_001Eto retrieve data for total population and median household income, respectively.Click Test & Get Schema.
Name the output dataset
nj_demo.Click Create.
Note
There are a number of ways to find out the code for a particular census variable. One way is by building the US Census metadata dataset in the Census USA plugin.
Enrich shapefiles with census data#
You now have the population and an estimate of median household income for each county in the state. Before joining the spatial and demographic data, you’ll need a few brief preparation steps on the demographic data.
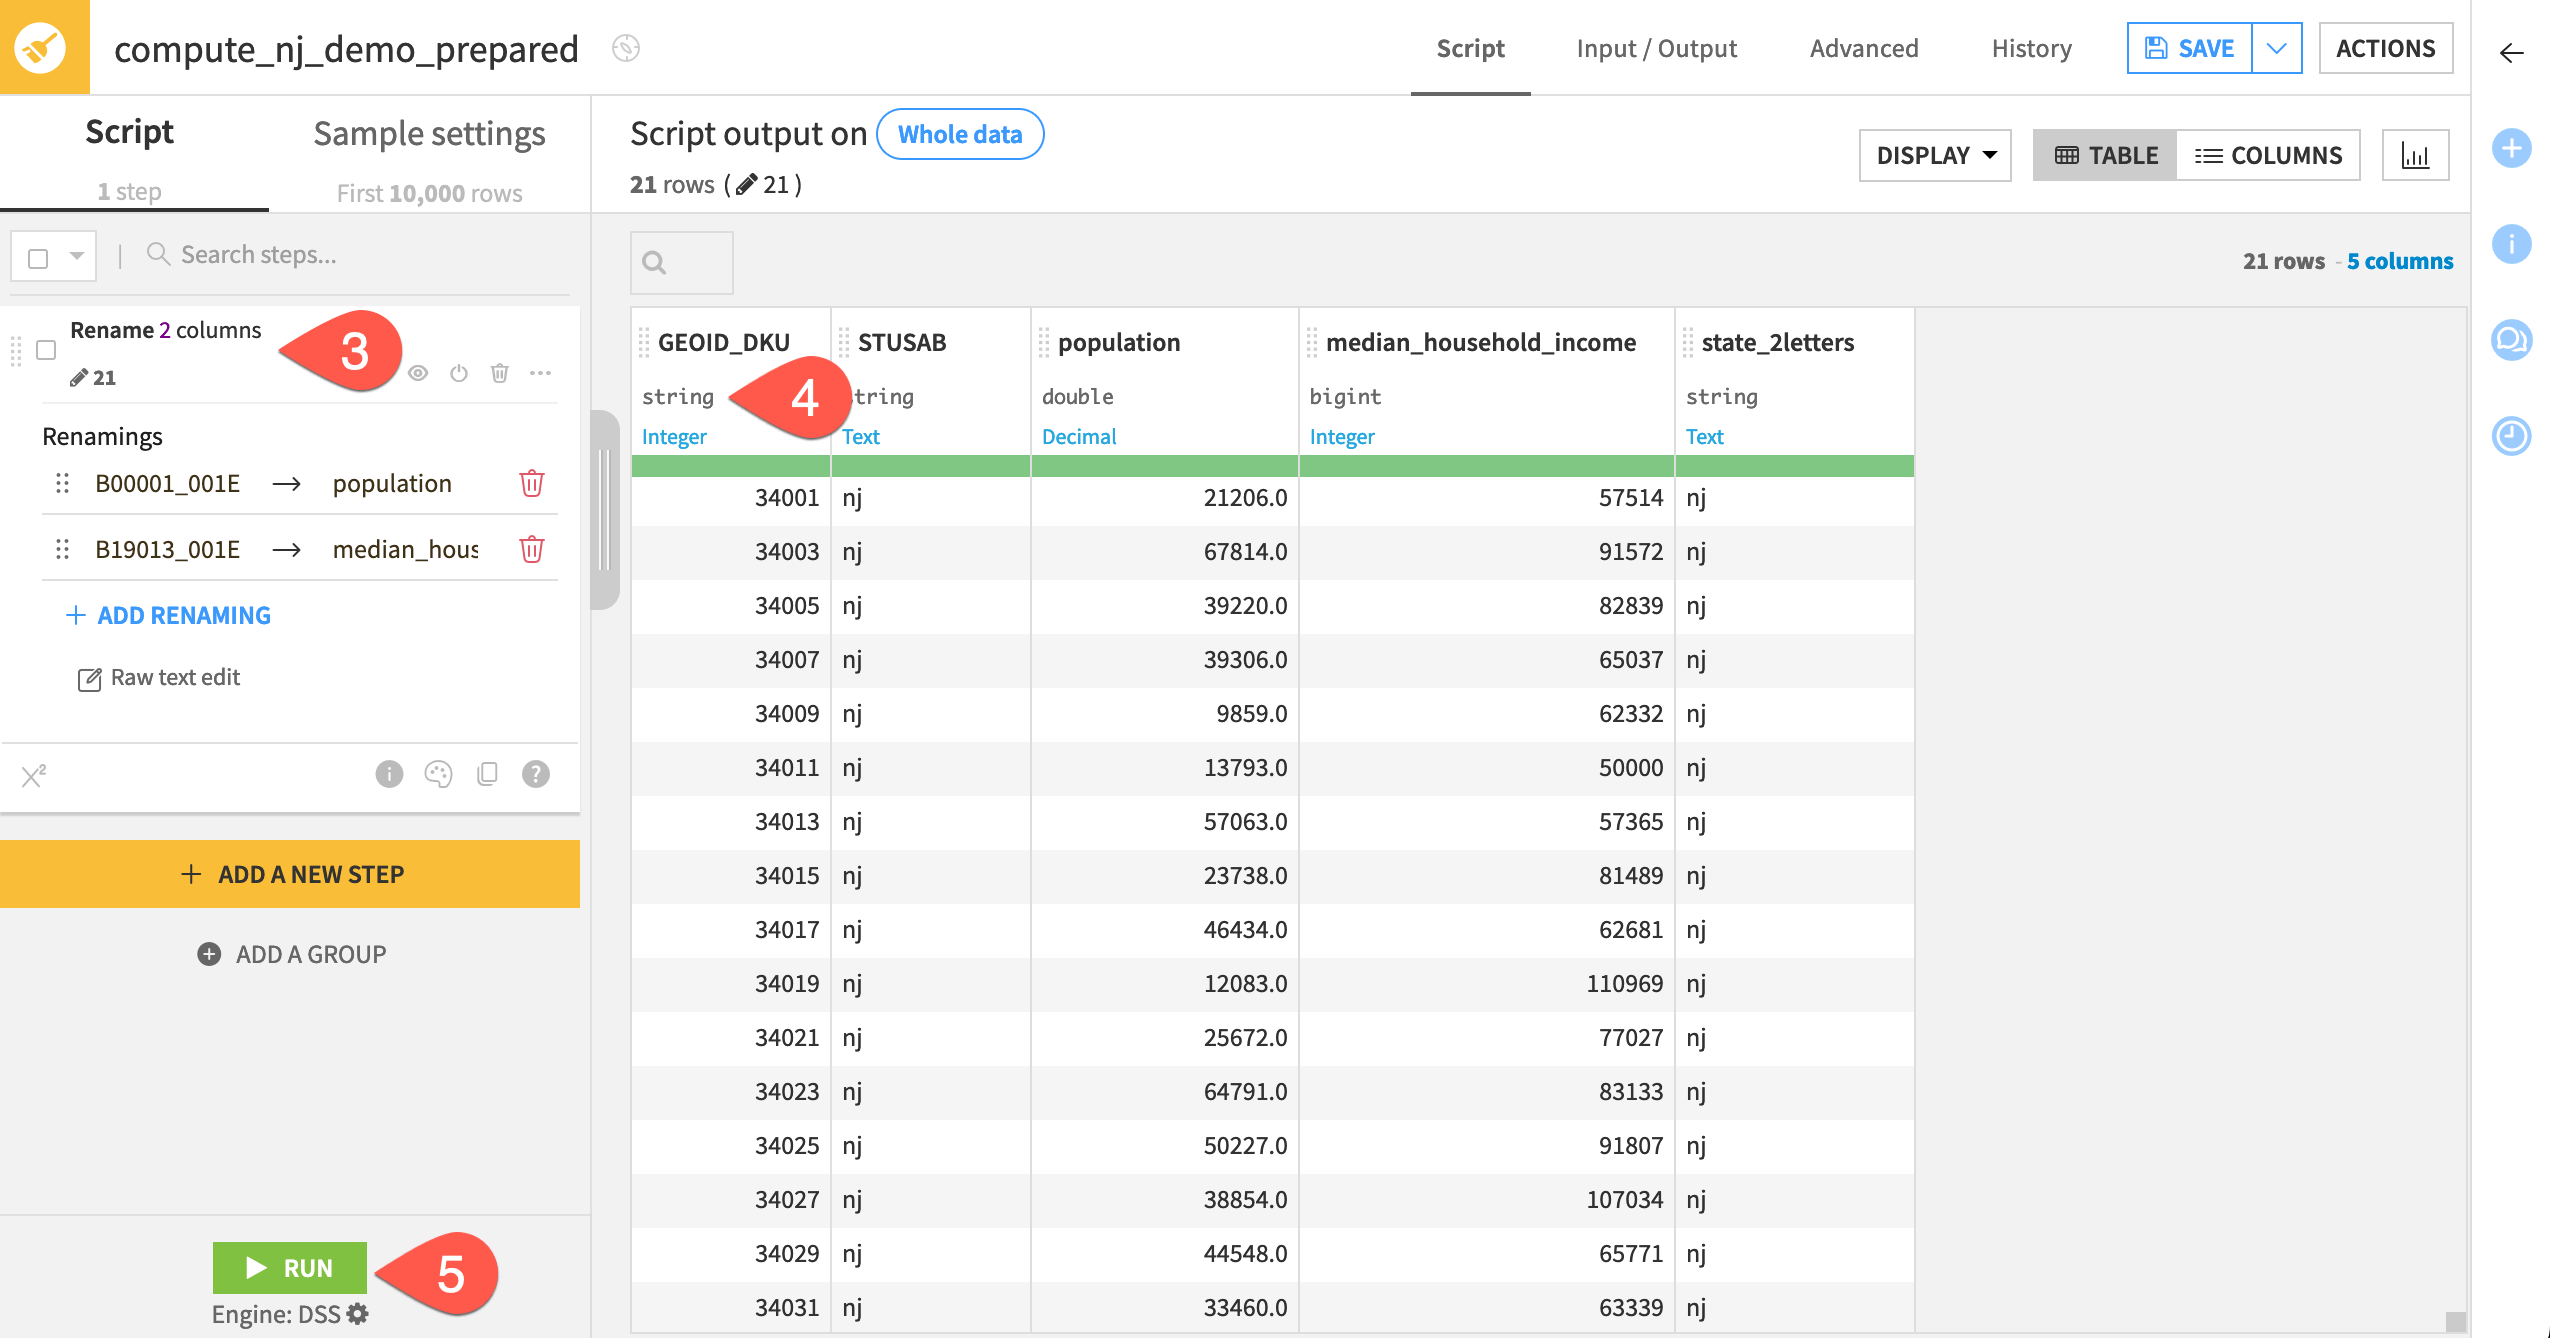
From the nj_demo dataset, select a Prepare recipe from the Actions tab.
Click Create Recipe.
Open the column header dropdown for B00001_001E and B19013_001E, and rename them
populationandmedian_household_income, respectively.Select the storage type dropdown for the column GEOID_DKU, and change it to a string so you can join it with the string GEOID column of nj_counties.
Click Run.
Now join the datasets of shapefiles and demographic information.
From the Flow, select the datasets nj_counties and nj_demo_prepared.
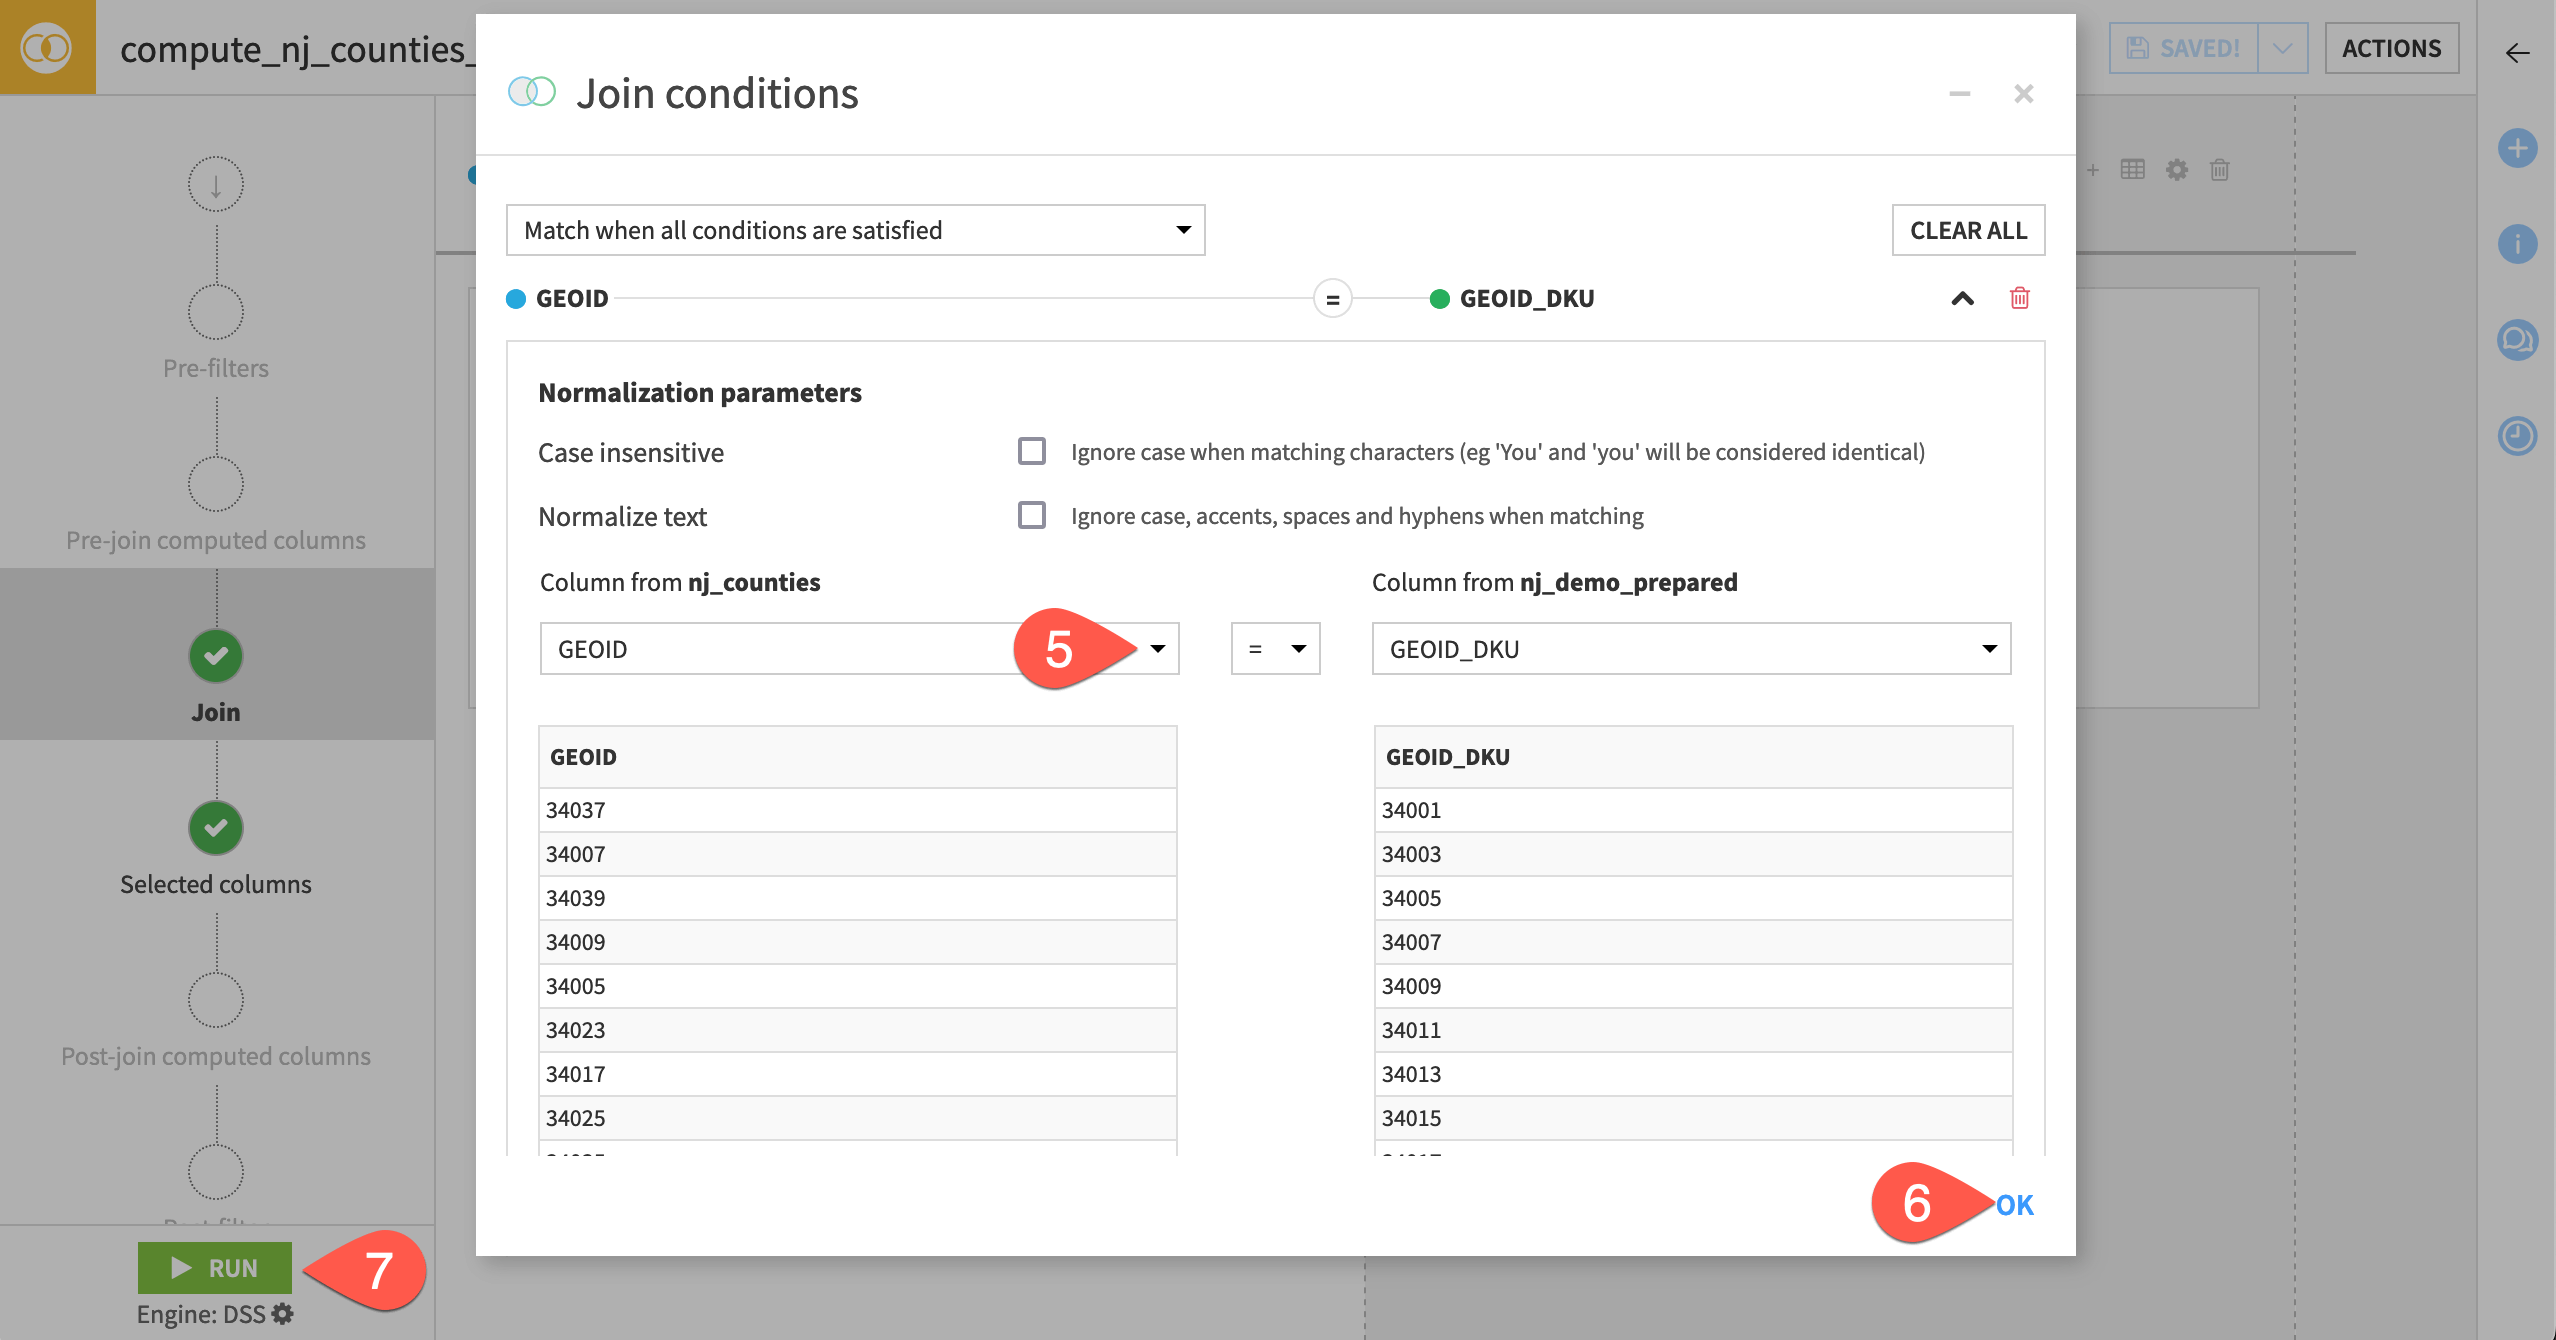
In the Actions tab, select Join from the menu of visual recipes.
Click Create Recipe.
Click Add a Condition.
For the join condition, select GEOID as the column from nj_counties and GEOID_DKU as the column from nj_demo_prepared.
Click OK.
Click Run, and open the output dataset when the recipe finishes running.
Map shapefiles#
Now you can visualize the distribution of demographic variables on a map.
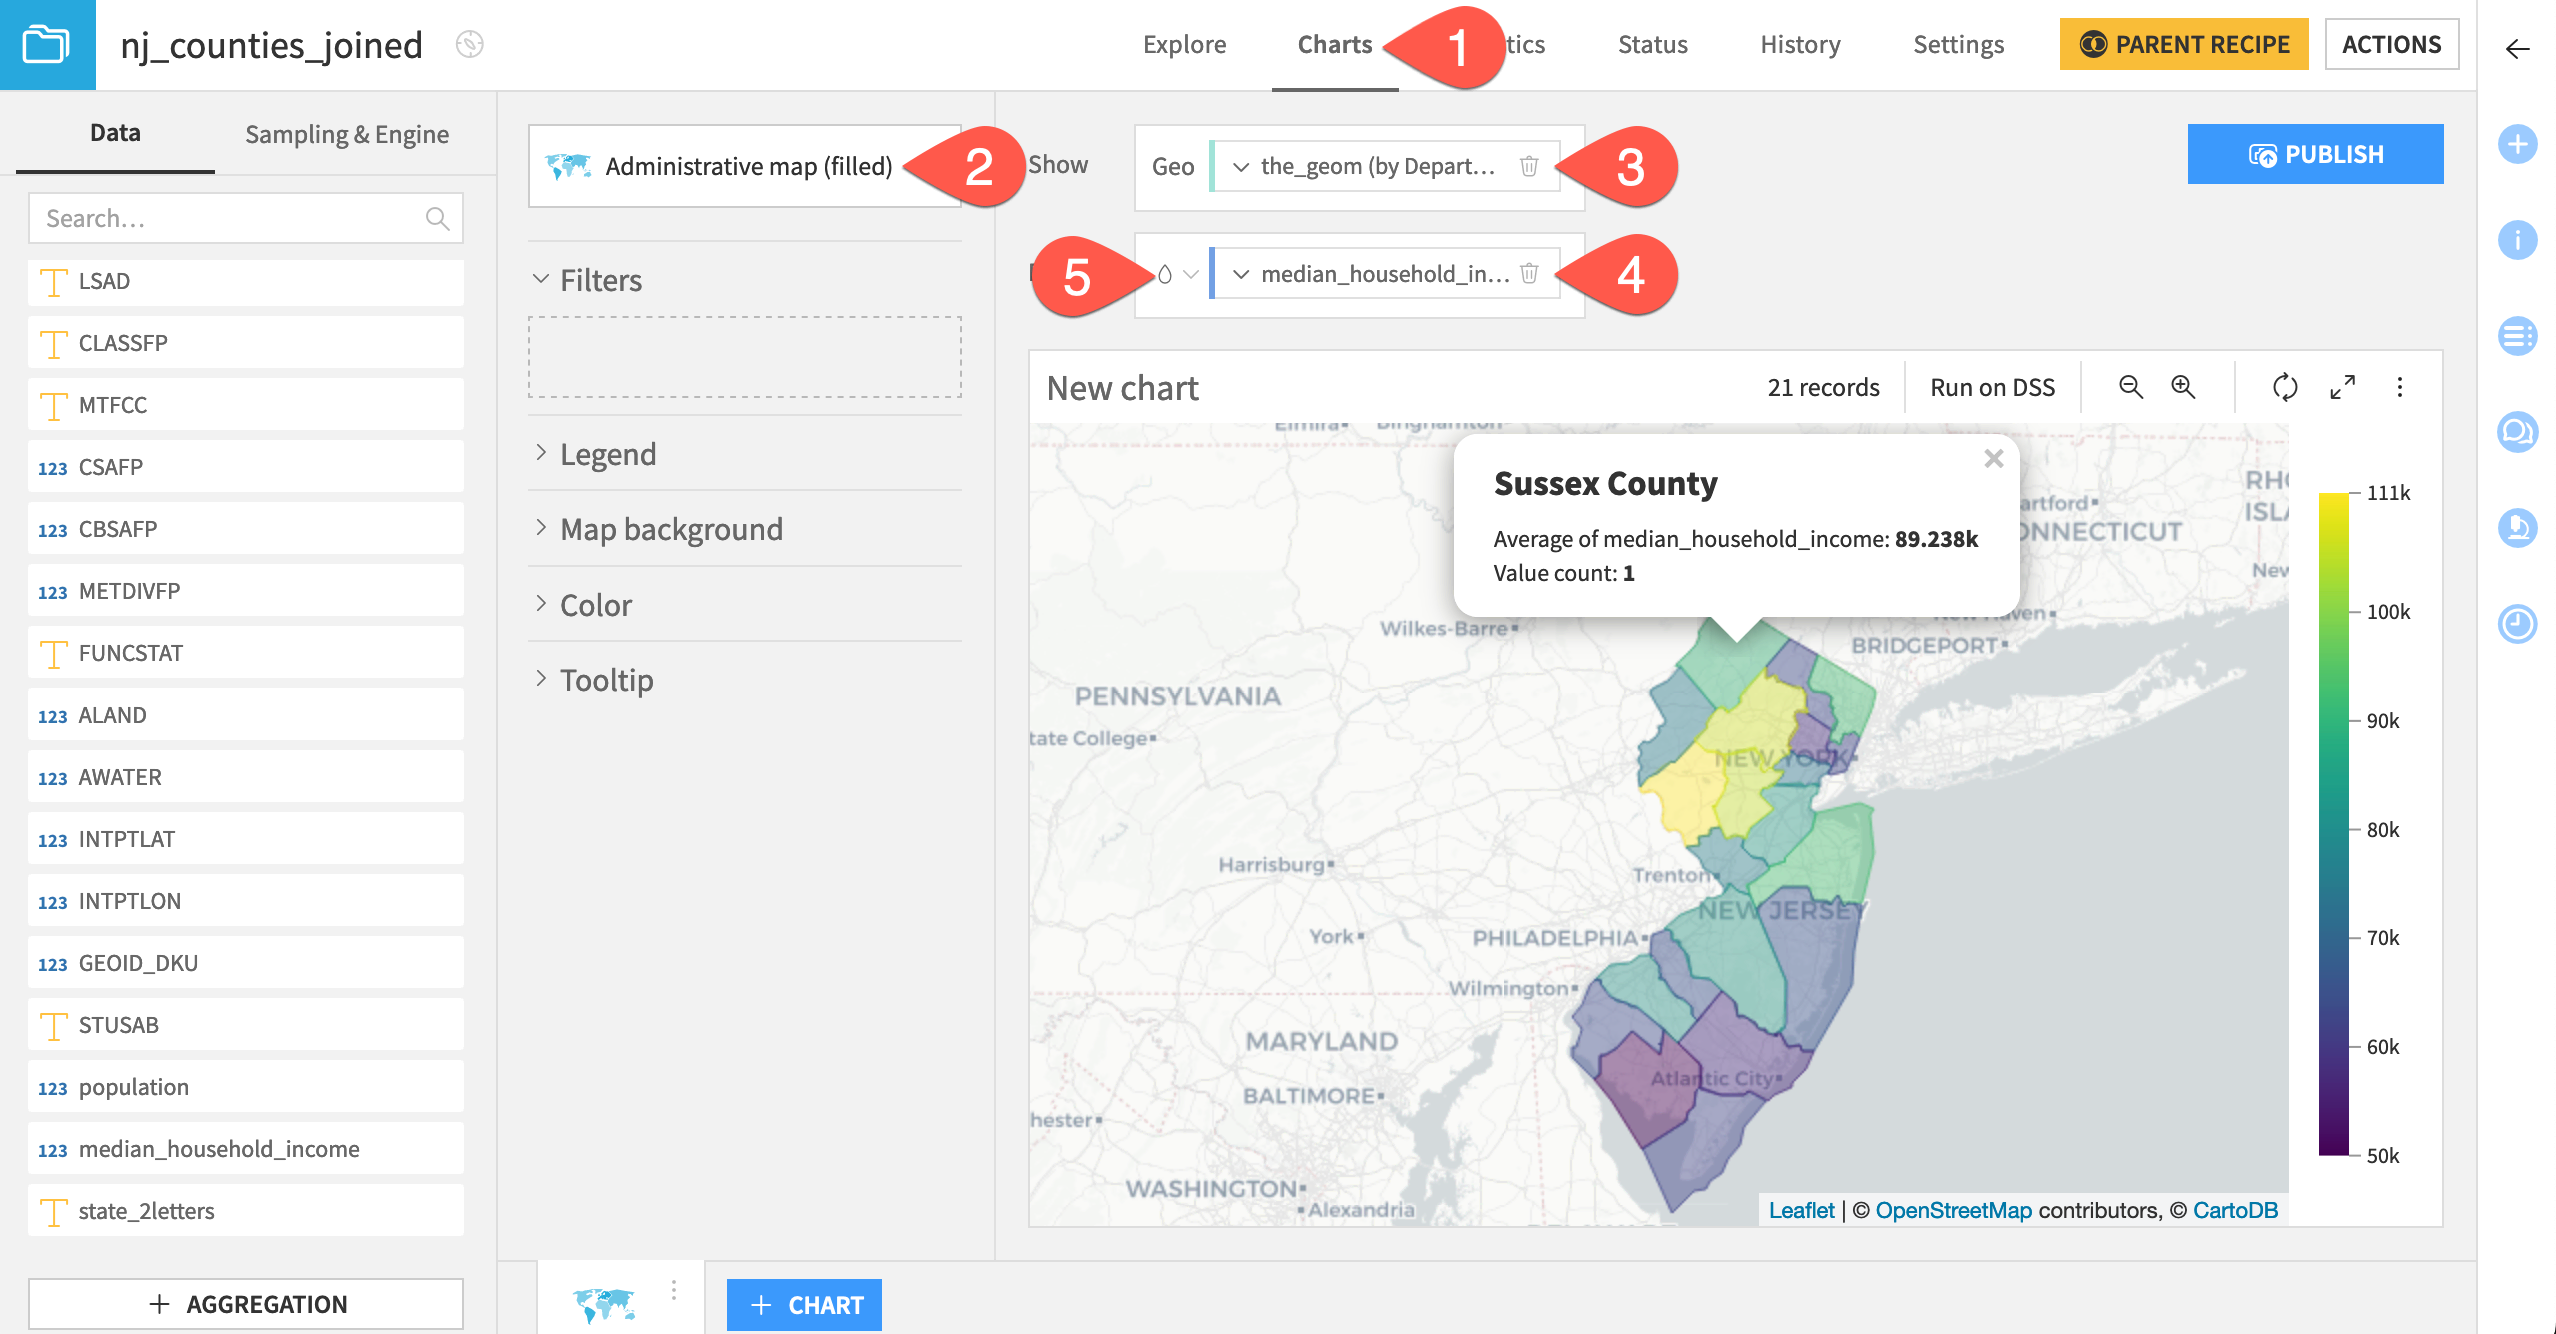
Navigate to the Charts tab of the nj_counties_joined dataset.
From the chart picker, select Administrative map (filled).
Drag the_geom column to the Geo field. Click the dropdown to adjust the level of detail to Department/County.
Drag the population or median_household_income column to the color droplet (
 ) field.
Click the color droplet to adjust the color palette to your preference.
Tip
For more resources on mapping, see Tutorial | No-code maps.
Next steps#
Congratulations! You’ve seen how to import, manipulate, and visualize shapefiles and US Census data in Dataiku.
See also
For more information, see the reference documentation on ESRI Shapefiles.
For more practice working with geographic data, see Tutorial | Geographic processors!
Tip
You can find this content (and more) by registering for the Dataiku Academy course, Geospatial Analytics. When ready, challenge yourself to earn a certification!