Concept | Introduction to graph analytics#
Graph Analytics is a powerful approach for making sense of complex, interconnected data. This article will walk you through the fundamental concepts of Graph Analytics and show you how the Dataiku Visual Graph plugin helps you put them into practice.
Discovering relationships in your data with graph analytics#
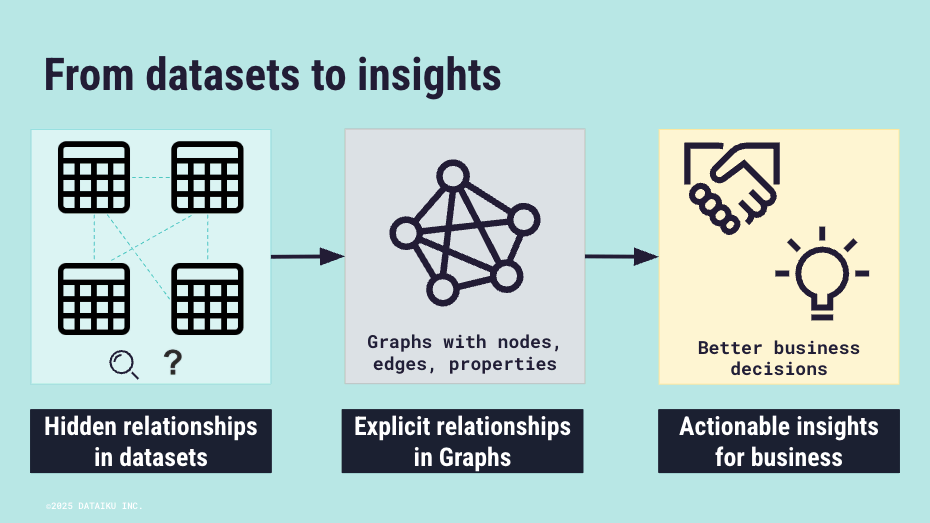
Graph analytics helps uncover hidden relationships and patterns in complex datasets. It’s widely used in scenarios such as anti-money laundering (AML), fraud detection, and drug repurposing.
A Graph is a data structure that makes these relationships explicit and easy to explore. Its core components are:
Nodes: Entities in your data, such as people, accounts, or drugs.
Edges: Connections between entities, such as “transfers money to” or “is treated by.”
Properties: Attributes of nodes and edges, such as a transaction amount or a relationship type.
While traditional tabular analysis can be effective for some tasks, it often makes it difficult to find hidden relationships and patterns that exist across multiple datasets. By turning complex links into actionable insights, Graph Analytics helps teams detect sophisticated patterns and make discoveries that lead to better business decisions.

Note
Graph analytics is particularly useful when relationships themselves are the key drivers of insights, rather than individual data points.
Solving business problems with Graph Analytics: A patient data use case#
To see the power of Graph Analytics, consider a concrete scenario: ensuring patient safety. As a data professional, you work with multiple sources—individual patient health records, a catalog of drugs and the diseases they treat, and a separate list of drug contraindications.
The challenge is that this information is scattered across different datasets, making it nearly impossible to find hidden connections with traditional analysis. How would you spot a potential danger, such as a patient being prescribed a drug that has a dangerous interaction with another medication they’re already taking?
By using a graph, you can transform these disparate datasets into a single, cohesive network. This allows you to answer critical questions that were previously difficult to solve, such as:
How do drugs, diseases, and patients cluster together, and what disease patterns emerge?
Which drugs shouldn’t be prescribed to a specific patient?
Based on existing conditions and treatments, what alternative drugs could be recommended?
These examples show the kinds of insights you can discover with Graph Analytics. In Dataiku, the Visual Graph plugin lets you build and explore such graphs directly in your projects.
Introducing the Dataiku Visual Graph plugin#
The Dataiku Visual Graph plugin brings graph analytics directly into Dataiku through Webapps, Visual Recipes, and supporting tools. It provides an integrated way to create, explore, and share graphs collaboratively.
The plugin offers a high-performance, built-in graph database (Kuzu) for immediate use while also providing native support for Neo4j as a backend for enterprise-grade scalability and advanced algorithms. For more information, see the Visual Graph article in the reference documentation.
A simple, visual, and insightful approach#
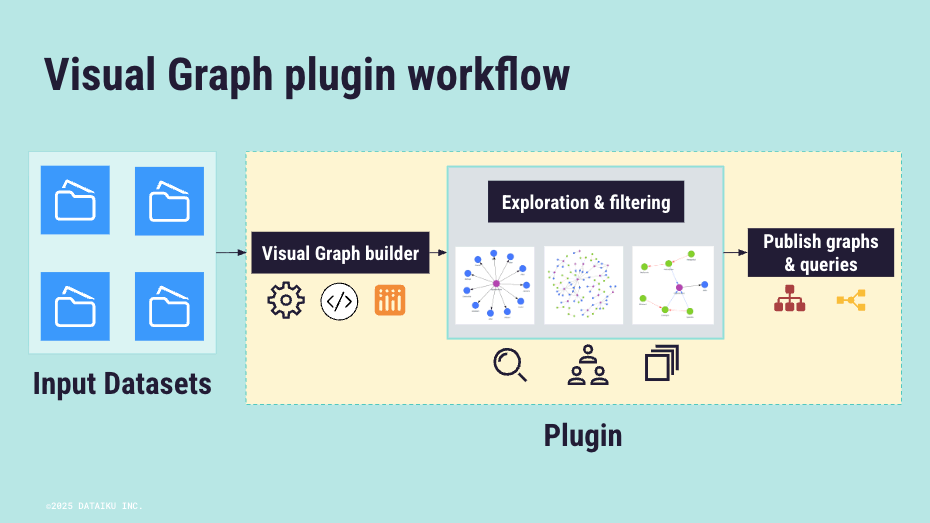
The plugin offers a fully visual workflow to:
Connect datasets and build graph structures.
Explore and filter relationships interactively.
Publish graphs for wider analysis and decision-making.

Thanks to its integrated graph engine, the setup is simple, and the approach is accessible to both technical and non-technical teams.
A tool for the entire team#
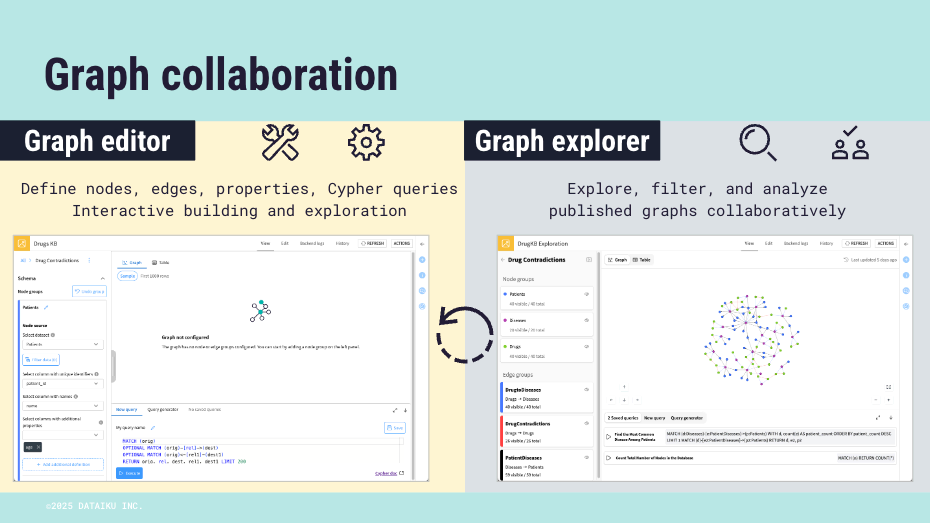
Visual Graph is designed for collaboration. Each role plays a part in turning raw datasets into actionable insights:
Role |
Description |
|---|---|
Graph editors (data scientists) |
Build and configure graph representations in the Editor webapp. Editors don’t just connect datasets—they actively explore and test different graph structures, run test queries, and validate that relationships are meaningful. They enrich nodes and edges with additional properties, adjust configurations to ensure data quality, and publish graphs for wider use, complete with pre-built queries that anticipate business needs. |
Graph explorers (investigators or analysts) |
Work with the published graphs in the Explorer webapp. Explorers dive in visually—clicking nodes and edges to view properties, tracing relationships, and zooming into areas of interest. They rely on pre-built queries to answer common questions, but can also filter the view to investigate anomalies or unexpected patterns. Their feedback loops back to editors, who refine the graphs and keep them aligned with real-world business questions. |

Note
For advanced use within a project, the Visual Graph plugin can act as a parallel exploration tool, letting you uncover relationships in your data like a graph-focused Exploration Data Analysis (EDA)—spotting patterns and interesting connections that inform and enrich your main project.
Integration and advanced capabilities#
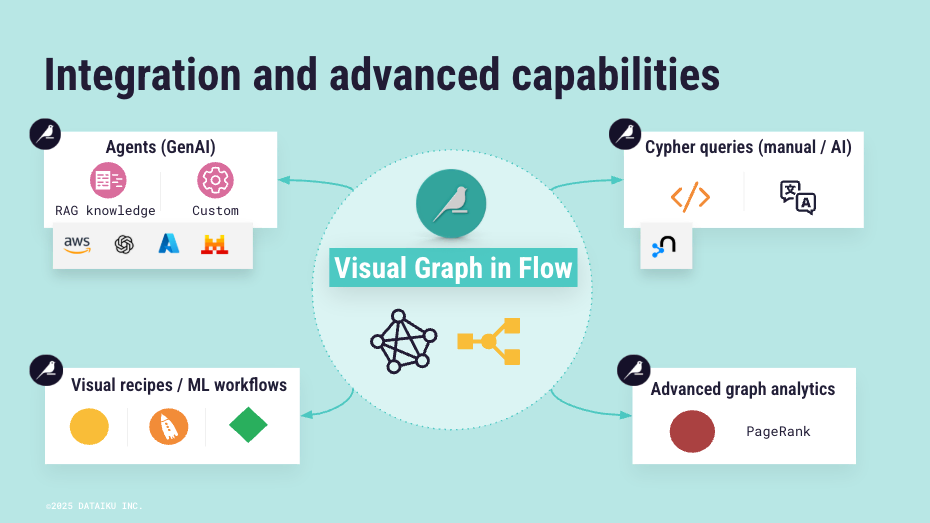
Visual Graph integrates into the Dataiku Flow, turning your graphs into a core part of your analytics. Once published, graphs can support a variety of downstream tasks:
Publish as knowledge sources for Agents, enabling them to interact with your data.
Query directly using manual or AI-generated Cypher queries to explore relationships and answer specific questions.
Extend with visual recipes or downstream workflows for advanced analytics and machine learning applications.
Also, an advanced Graph Analytics recipe is available directly in the Flow:
PageRank: Runs on published graph configurations to measure the relative importance of nodes within a network, helping identify key entities or hubs.
Integrating your graphs into your analytics opens up a wide range of possibilities beyond static visualizations, allowing both technical and non-technical users to discover hidden relationships and make data-driven decisions.

Warning
Large or highly connected graphs may require significant computation resources. Consider filtering or sampling your data before building large graphs.
Next steps#
Now that you’ve learned the fundamentals of Graph Analytics and the Dataiku Visual Graph plugin, get some hands-on practice with the Tutorial | Building and exploring a graph for patient data analysis!

