Concept | Time series analysis with interactive statistics#
Dataiku provides a number of built-in statistical tests that you can perform on your datasets. Let’s review some types of time series tests that can help you analyze your data.
Tip
It helps to have some familiarity with hypothesis testing.
Stationarity#
One type of test for time series evaluates the stationarity of a dataset.
Stationarity indicates that the process generating statistical properties like mean and variance in a dataset doesn’t change over time. For example, a time series that’s stationary has a mean value that remains constant over a time period. Additionally, a time series is non-stationary if its values consistently trend upwards or downwards over time.
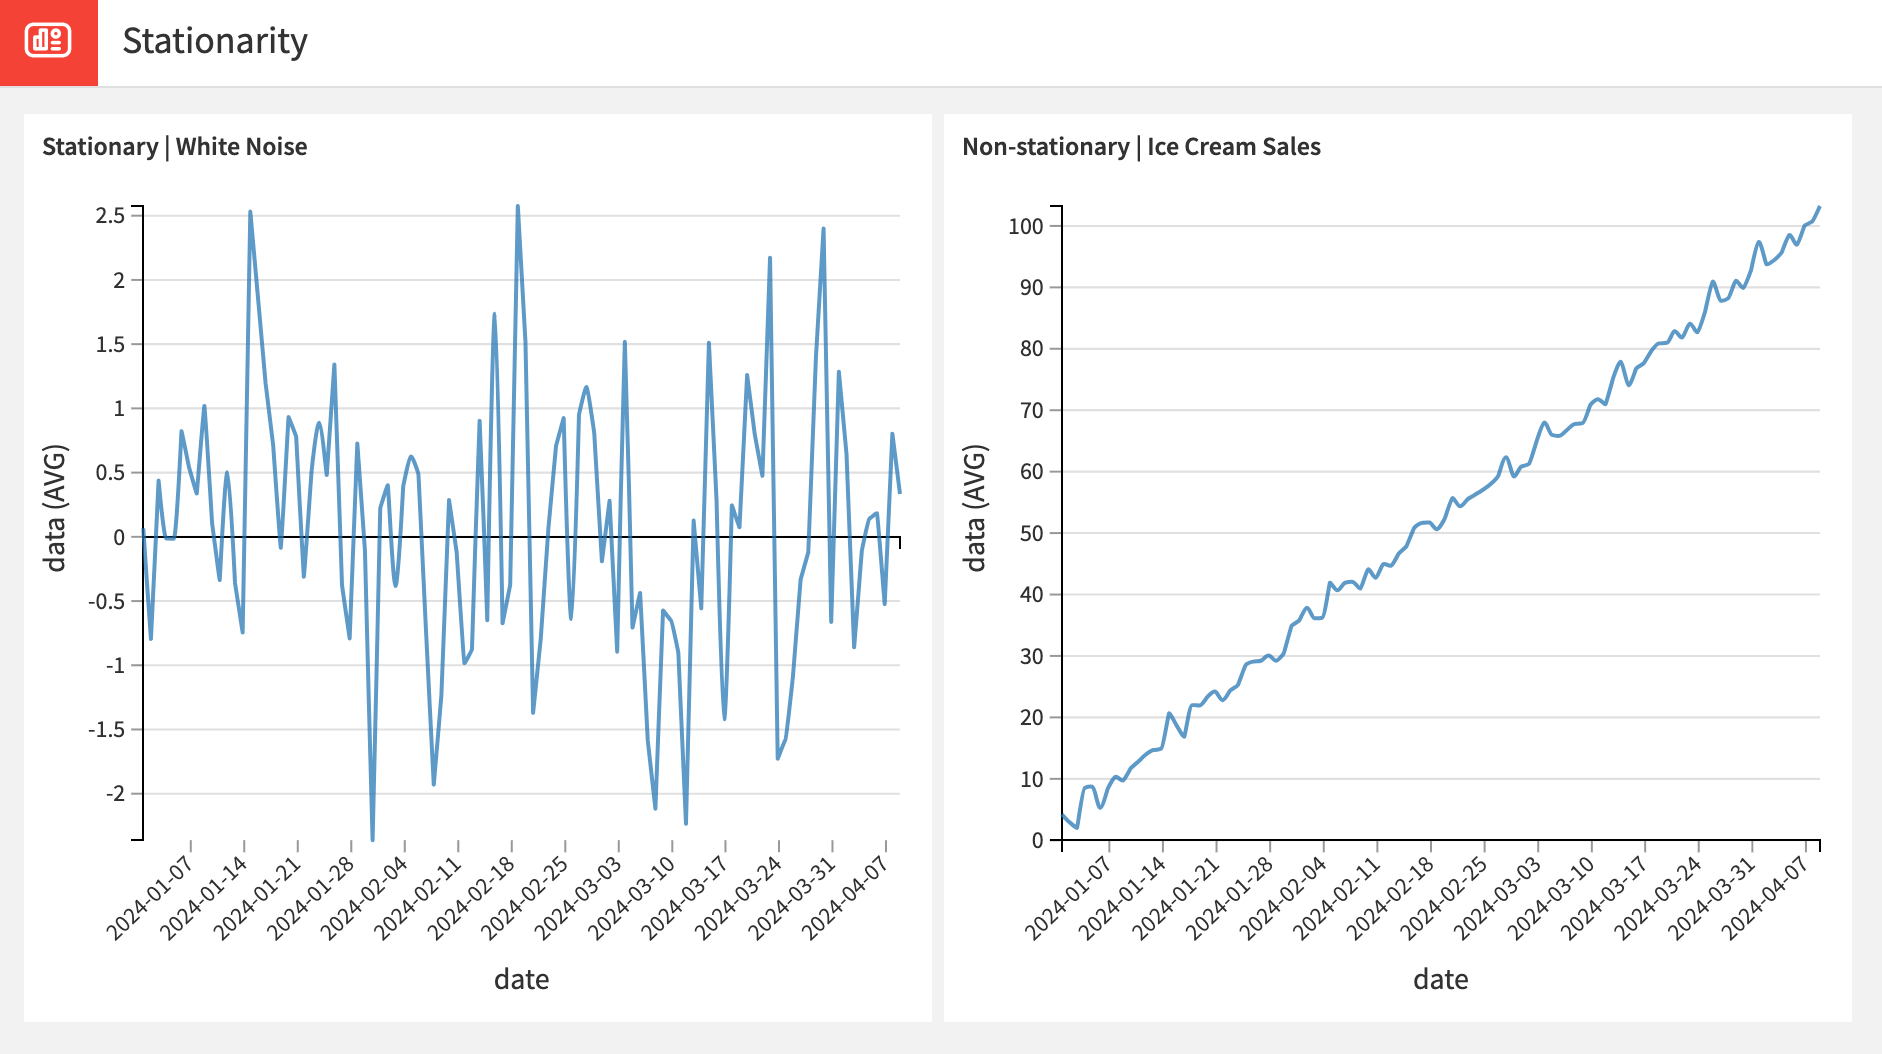
Time series with seasonality and trends are always non-stationary. However, having aperiodic cycles in your data doesn’t break stationarity.
It’s important to verify whether your time series is stationary or not before starting the modeling process. Stationarity is particularly important for statistical models like ARIMA as it could greatly affect the forecasting results and model fitting.
Note
For visual time series modeling, Dataiku assumes by default that the time series isn’t stationary. It then performs the available statistics tests and corrects for non-stationarity. However, it’s still important to test stationarity yourself to understand your data properties and to set appropriate differencing parameters to fine-tune in the Lab. Click to find more information on stationarity and differencing.
To test for non-stationarity, Dataiku gives you a choice between different statistical tests.
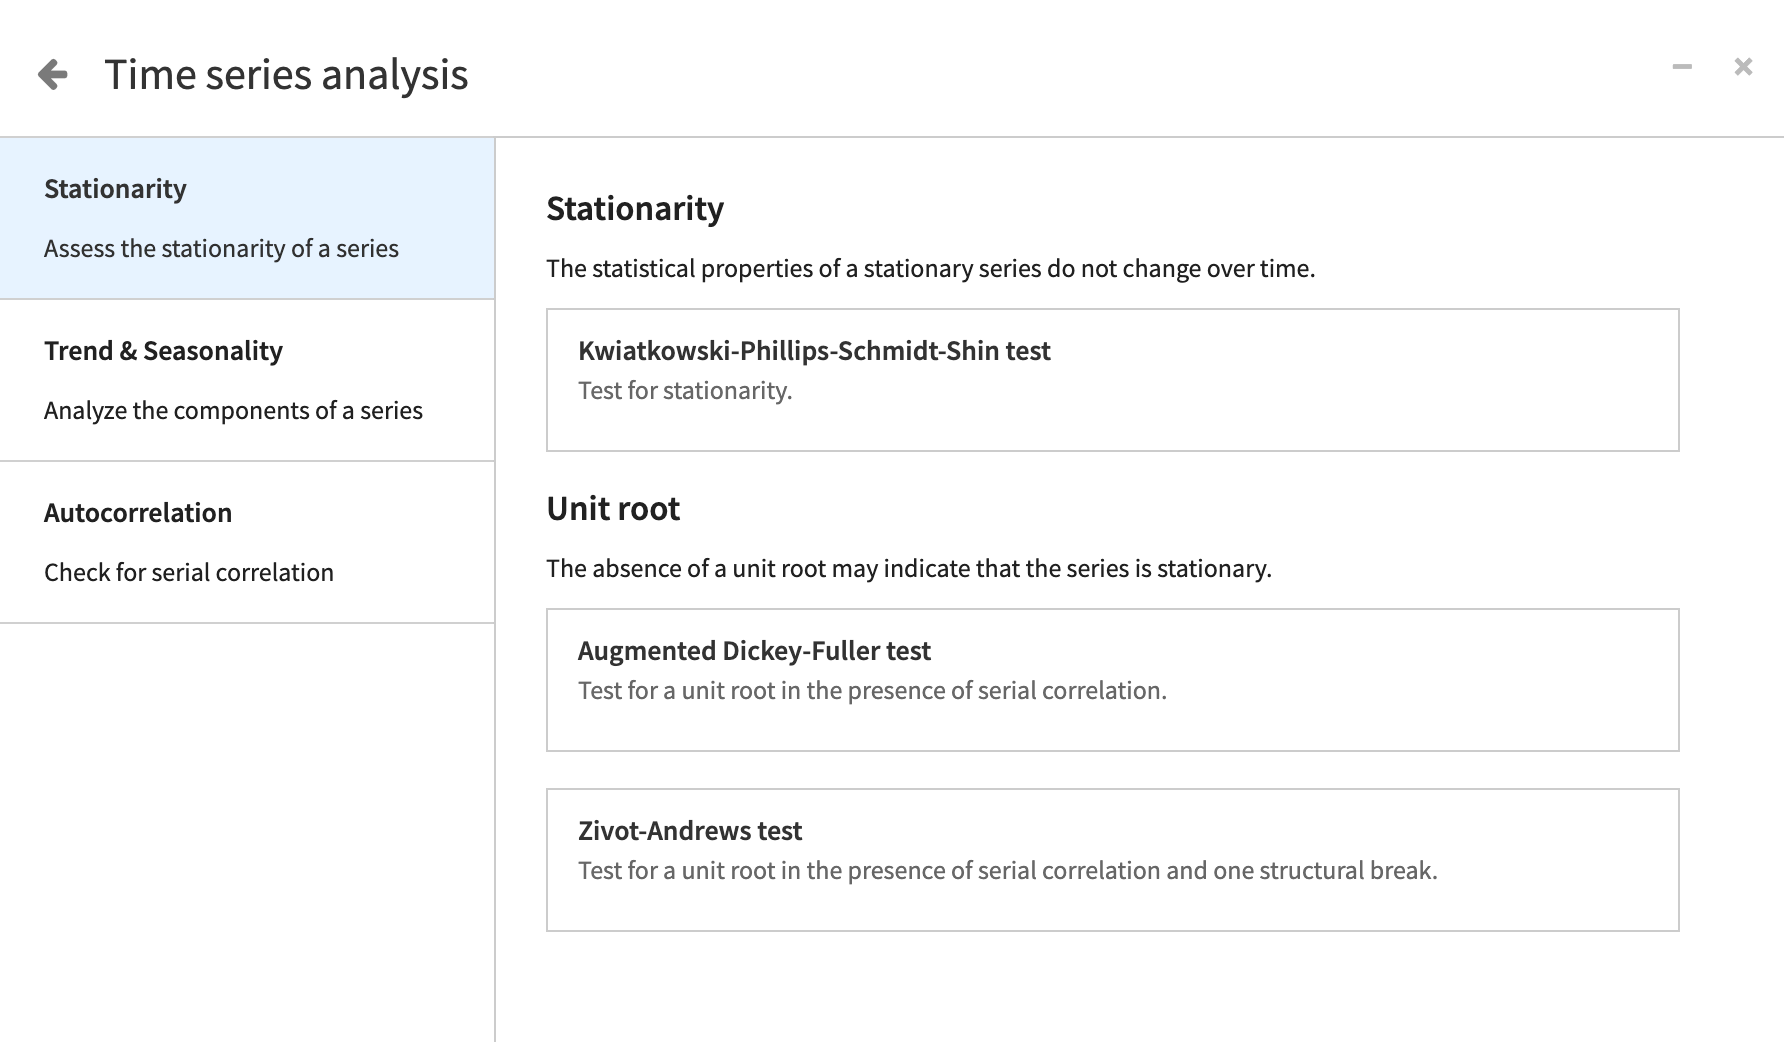
All stationarity tests in Dataiku share a core principle: they assume stationarity as the null hypothesis. If the probability of a test statistic is less than a probability p set to 0.05, we reject the null hypothesis, indicating non-stationarity in the time series.
Trend & Seasonality#
In contrast to stationarity, trend and seasonality in time series datasets indicate a clear change or repeated pattern over time.
Sometimes, simply plotting the data can give you a sense of trend and seasonality. For example, if you’re looking at a graph of the population of a city over time, you might be able to see a noticeable positive trend. You might also detect seasonality while looking at a graph of inches of rainfall over the course of a year.
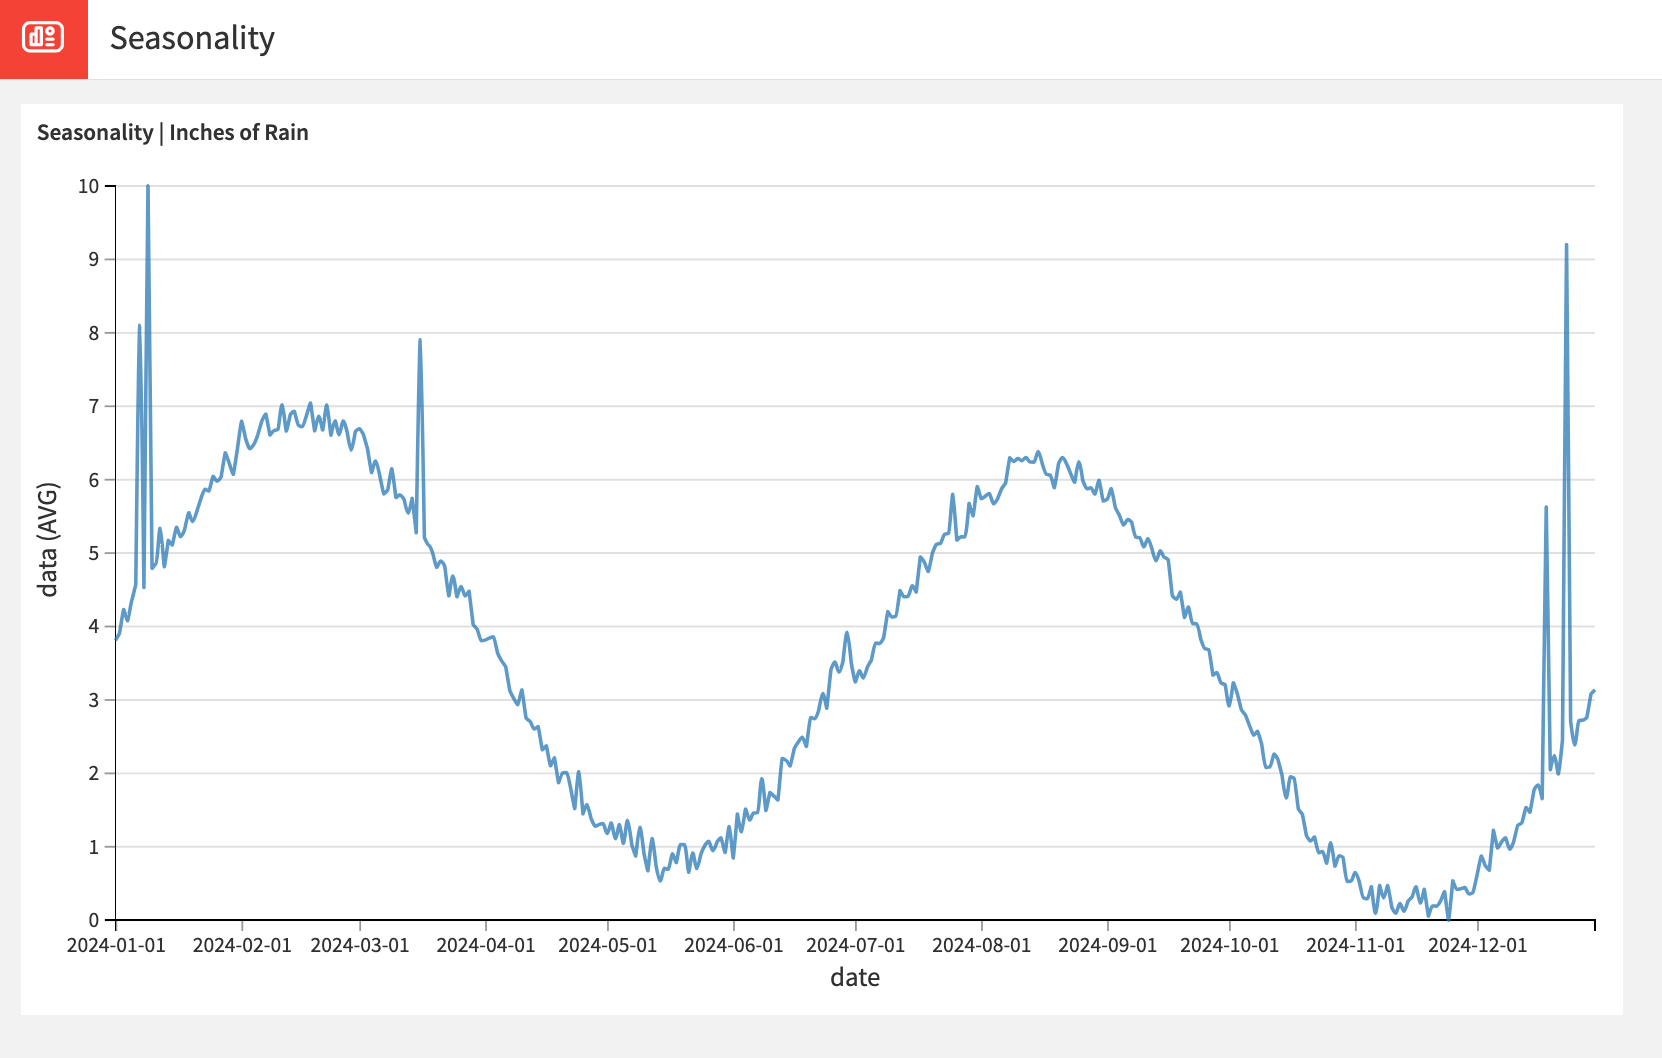
To dive deeper, Dataiku provides statistical tests that can support or validate a trend or seasonality that you notice.
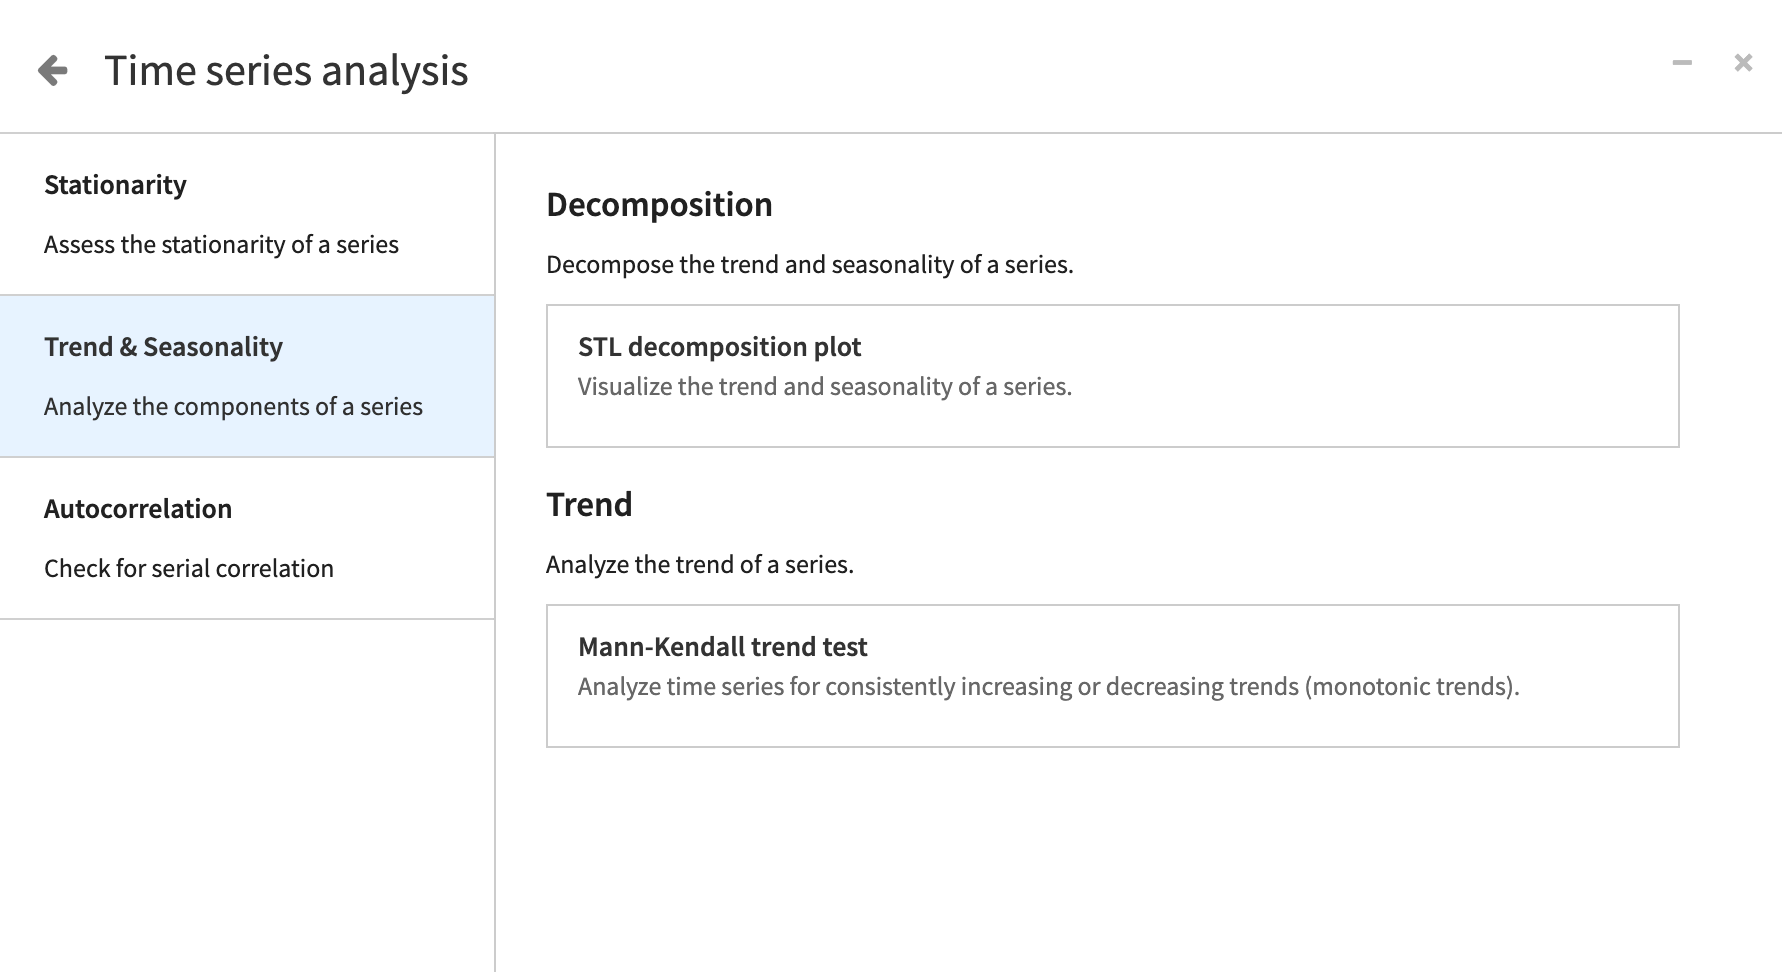
For example, you can test whether your time series has a monotonic increasing or decreasing trend using the Mandall-Kendall test. For the null hypothesis that the time series has no trend, a p-value less than 0.05 will indicate that we can reject this null hypothesis.
Large positive statistics value will indicate that your data have an increasing trend while negative statistics value will point toward a decreasing trend over time. Similarly to the stationary tests, we can only reject the null hypothesis — we can’t confirm it.
Note
A time series that has seasonality is autocorrelated.
Autocorrelation#
In a time series, autocorrelation represents the level of similarity between a time series and a lagged version of itself over successive time intervals. It’s the same as calculating the correlation between two different time series, except that autocorrelation uses the same time series N times for N lags. In Dataiku specifically, there are 25 lags.
In other words, a time series dataset is autocorrelated if a variable’s current value is related to its past values.
For instance, if the price of a stock is up one day, it could be more likely to be up the next day, too. To verify the autocorrelation, you can use a few different statistical tests shown here.
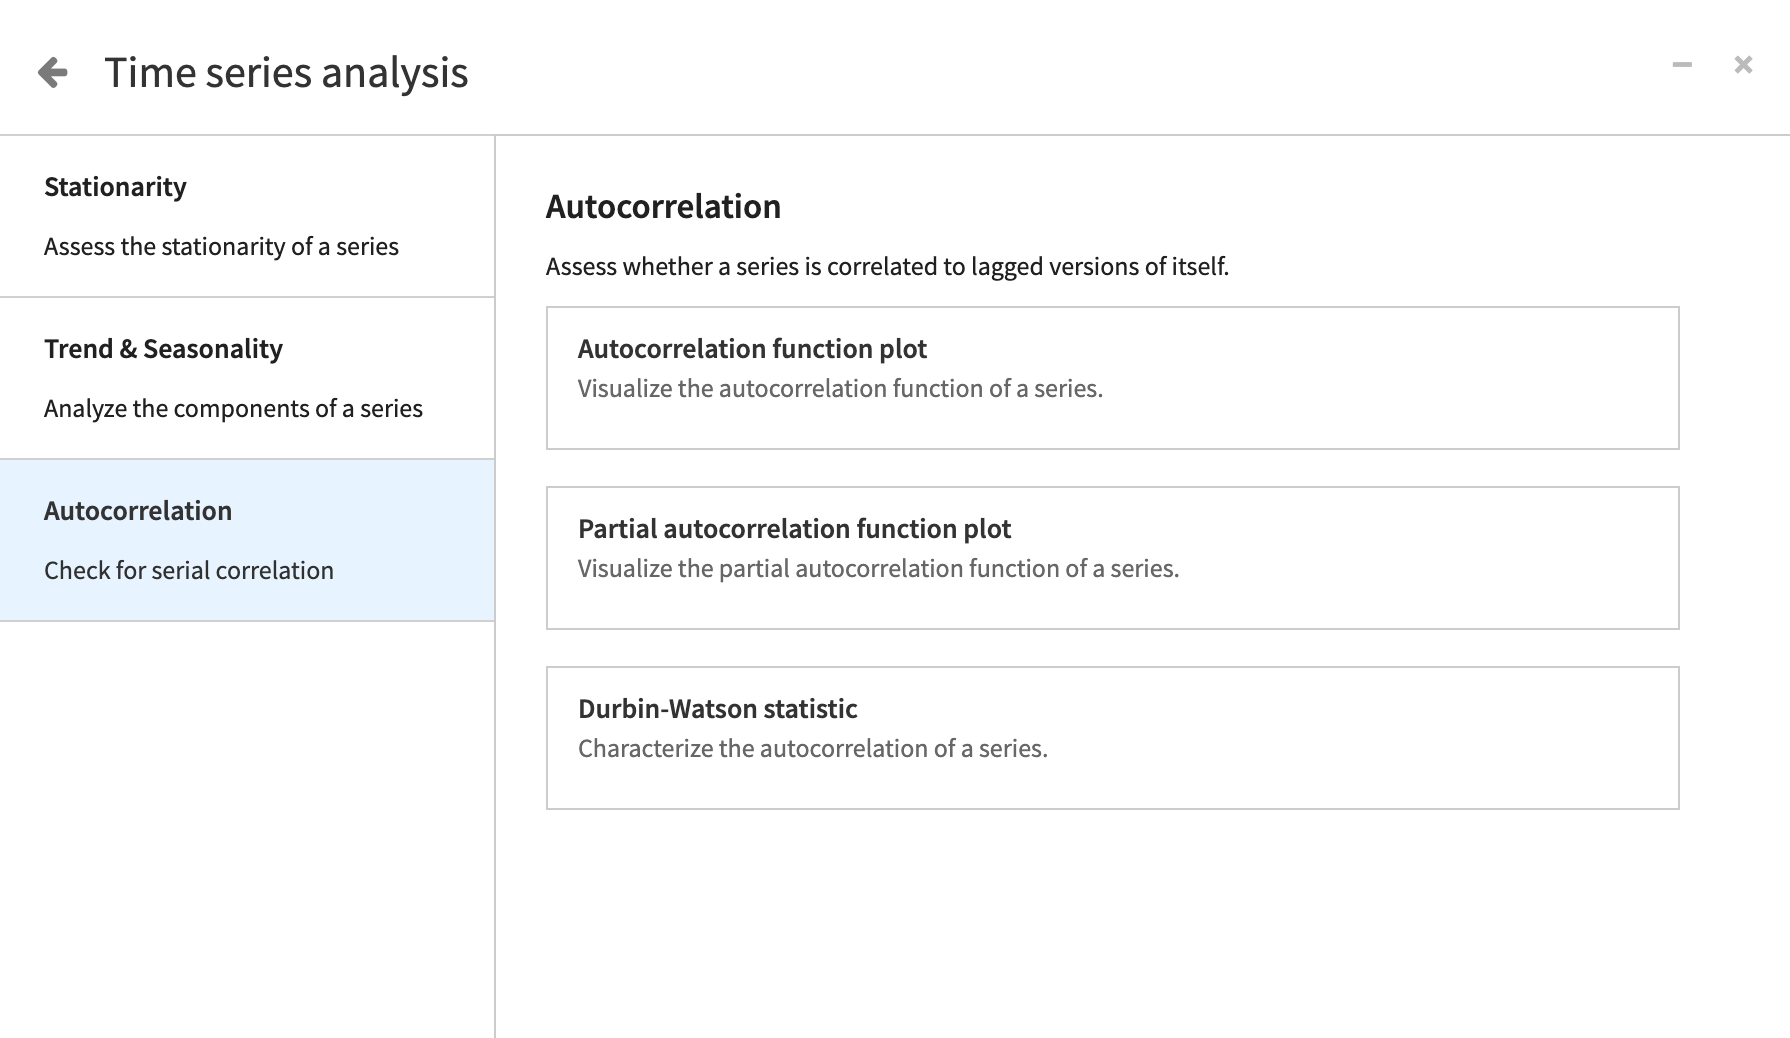
When forecasting, including lags in your model can greatly improve its performance. Autocorrelation plots and tests allow you to make a decision on the number of lags that should be included in your model. Therefore, it’s important to detect the degree of the autocorrelation in the data before modeling.
Visualizing the autocorrelation#
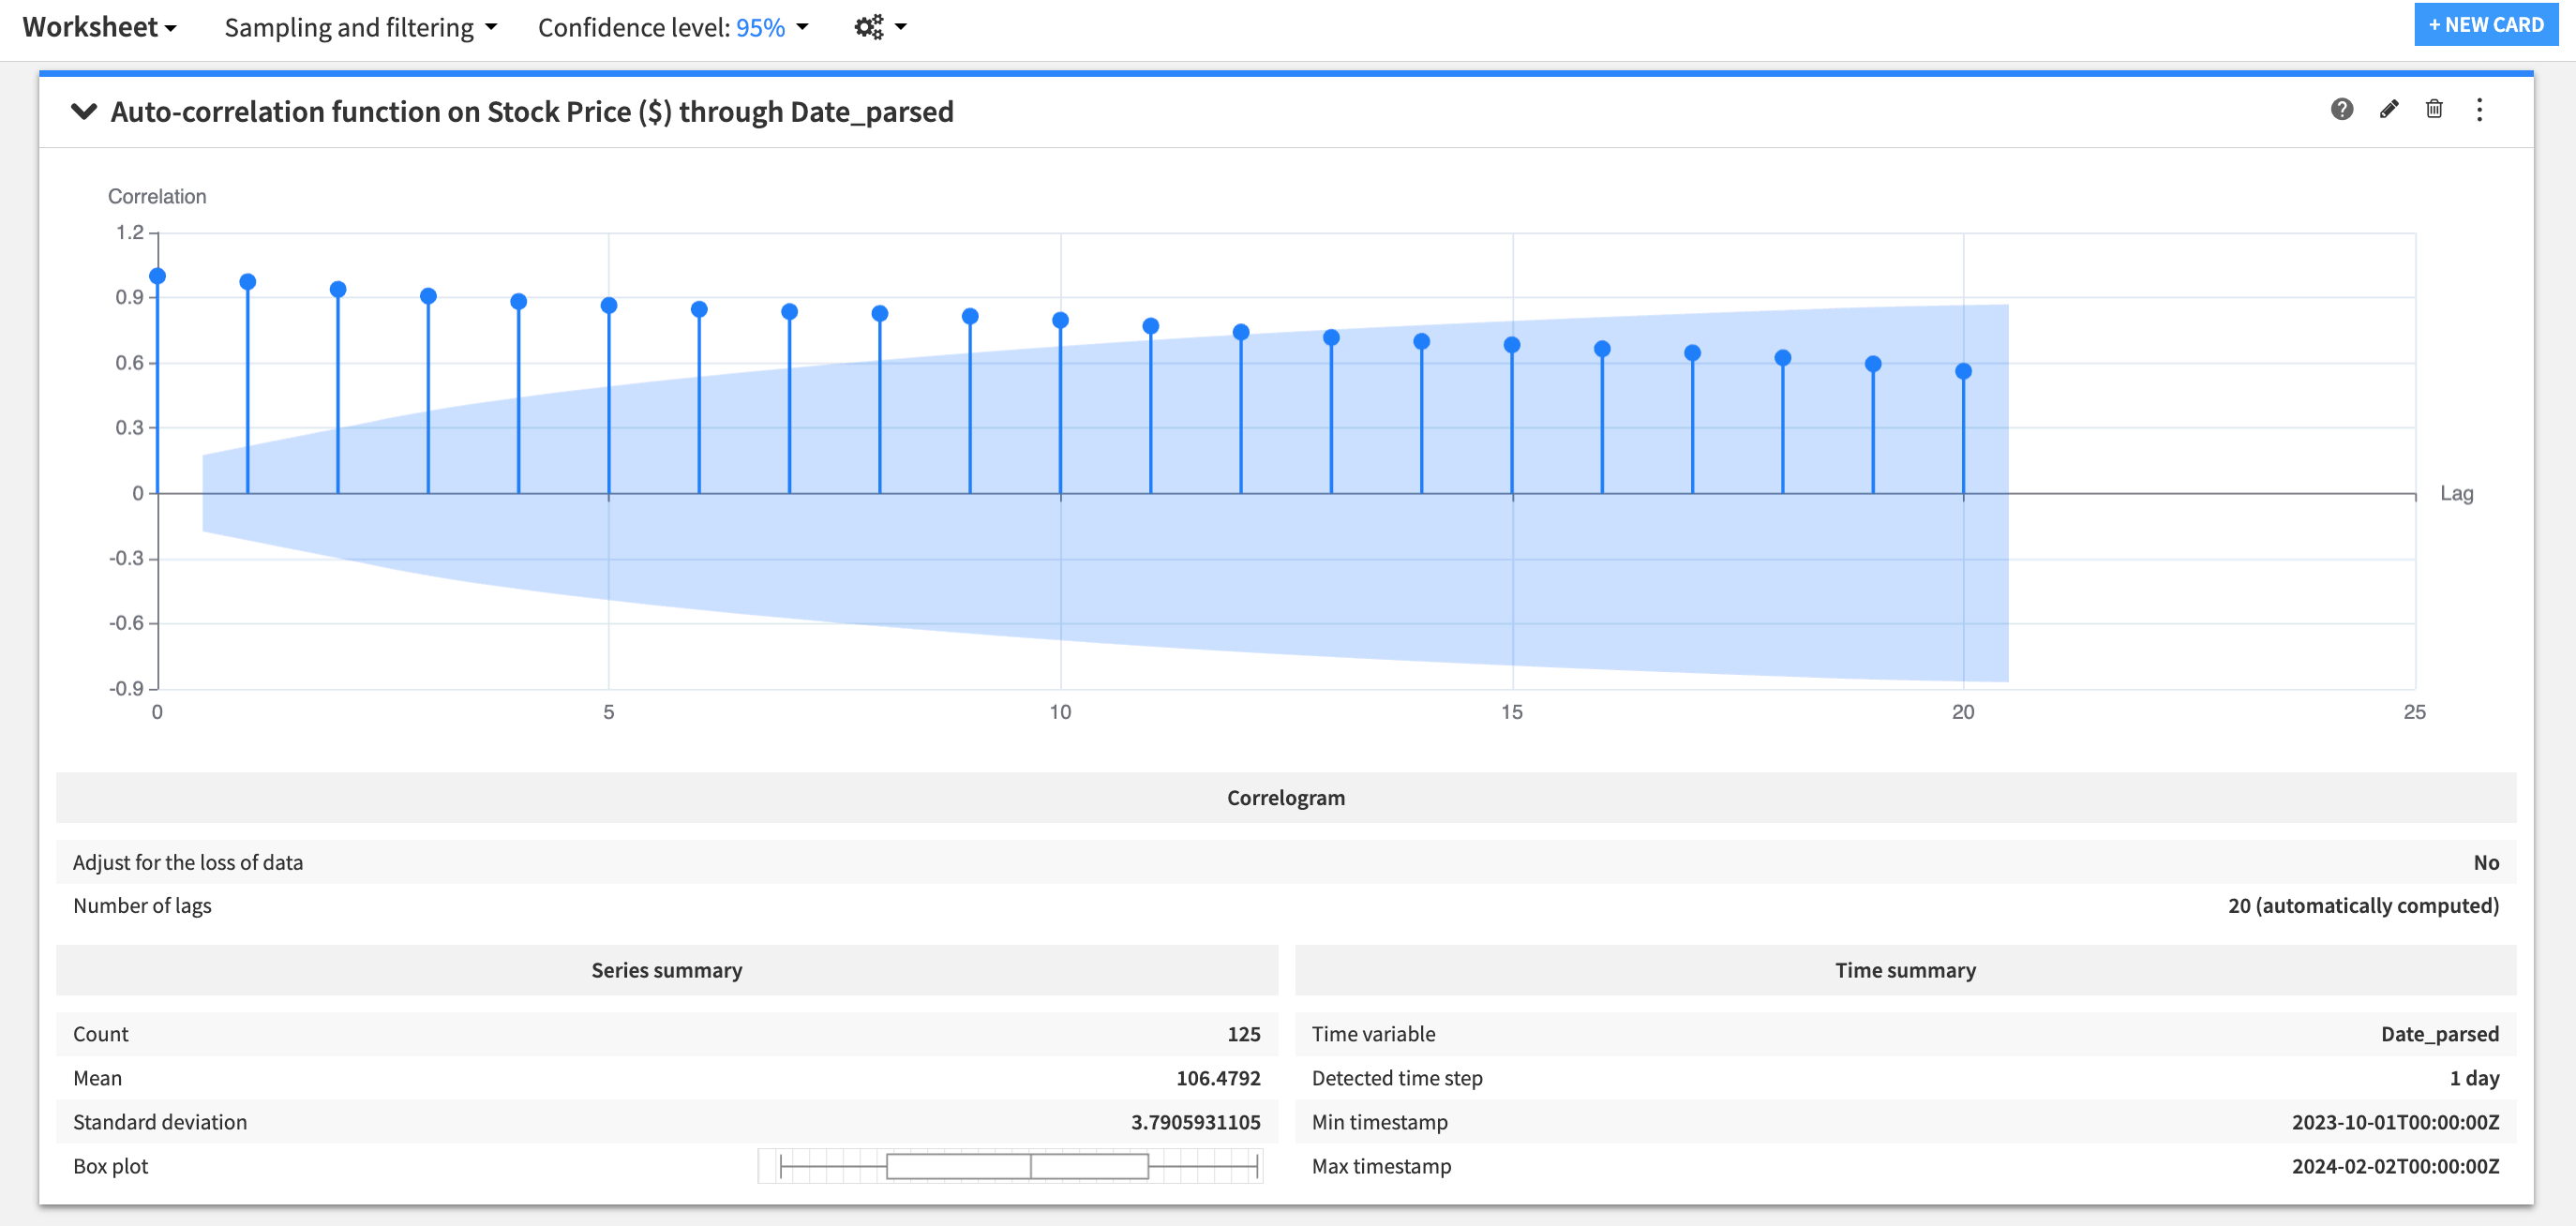
To test autocorrelation, one option is to add an autocorrelation function plot to your worksheet. This can help you visually inspect the strength of the autocorrelation.
As shown here, an autocorrelation statistic can take values between -1 (negative correlation) and 1 (positive correlation). A time series at time t has an autocorrelation of one with itself. The autocorrelation of a time series with its lagged versions can’t exceed one and can even become negative.
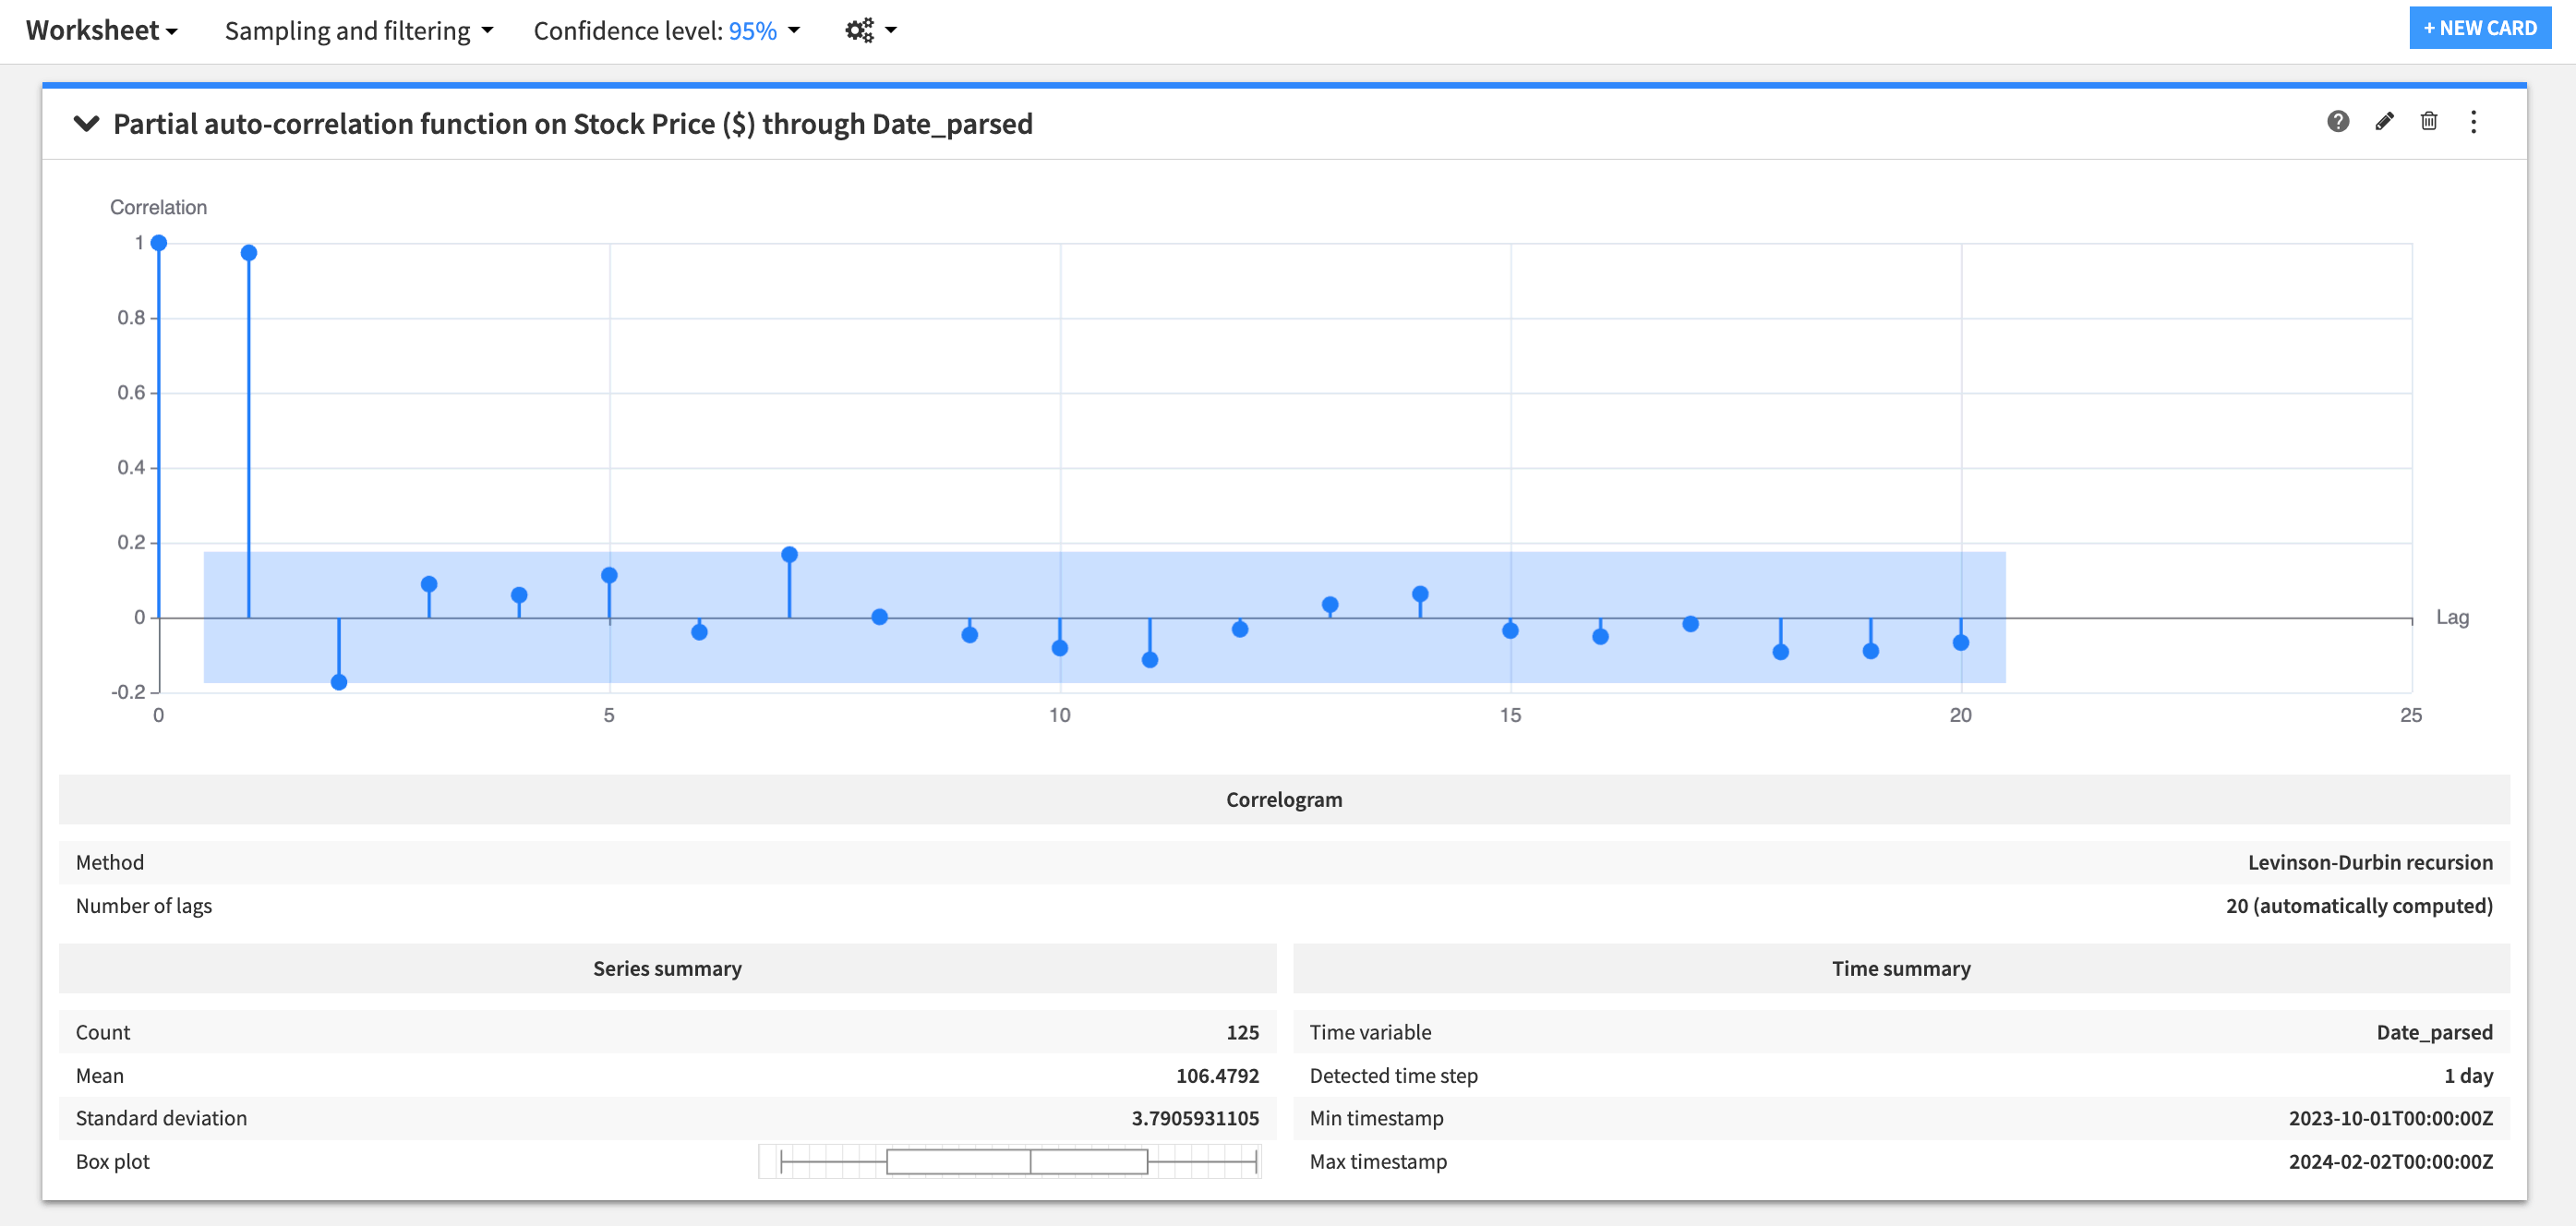
While the autocorrelation function plot simply computes a series of correlations between a time series and its lagged versions, partial autocorrelation function plot represents an adjusted version of this. For every lag, the plot is adjusted for the correlations that exist between the current time series and its lagged copies up to a lag of interest.
For a simple autocorrelation, if you have multivariate time series data, you need to specify the dimension for different time series before computing the partial autocorrelation.
Partial autocorrelation plots can be more informative than autocorrelation plots in deciding how many lagged copies of a time series to include in your model.
See also
Click to learn more about autocorrelation and partial autocorrelation plots.
Testing for autocorrelation#
Dataiku lets you compute the Durbin-Watson test for the presence of the autocorrelation in the data.
If the value of the d statistic for the Durbin-Watson test equals two, it indicates the absence of the autocorrelation in the data. If d is less than two, it shows evidence for the positive autocorrelation. A d value greater than two indicates that there might be a negative autocorrelation present in the data.
Next steps#
You have just learned about some statistical tests you can perform on time series in Dataiku. To see more results of these tests, try out Tutorial | Time series analysis! Additional information can be found in Time Series Analysis.

