
Concept | Time series resampling#
Watch the video or read the summary below.
Resampling is critical to time series analysis and forecasting. This is why Dataiku provides multiple ways to accomplish resampling, including:
Using the Resampling recipe from the Time series preparation plugin.
Configuring the Train / Test Set step of visual time series forecasting.
Writing custom formulas (not covered here).
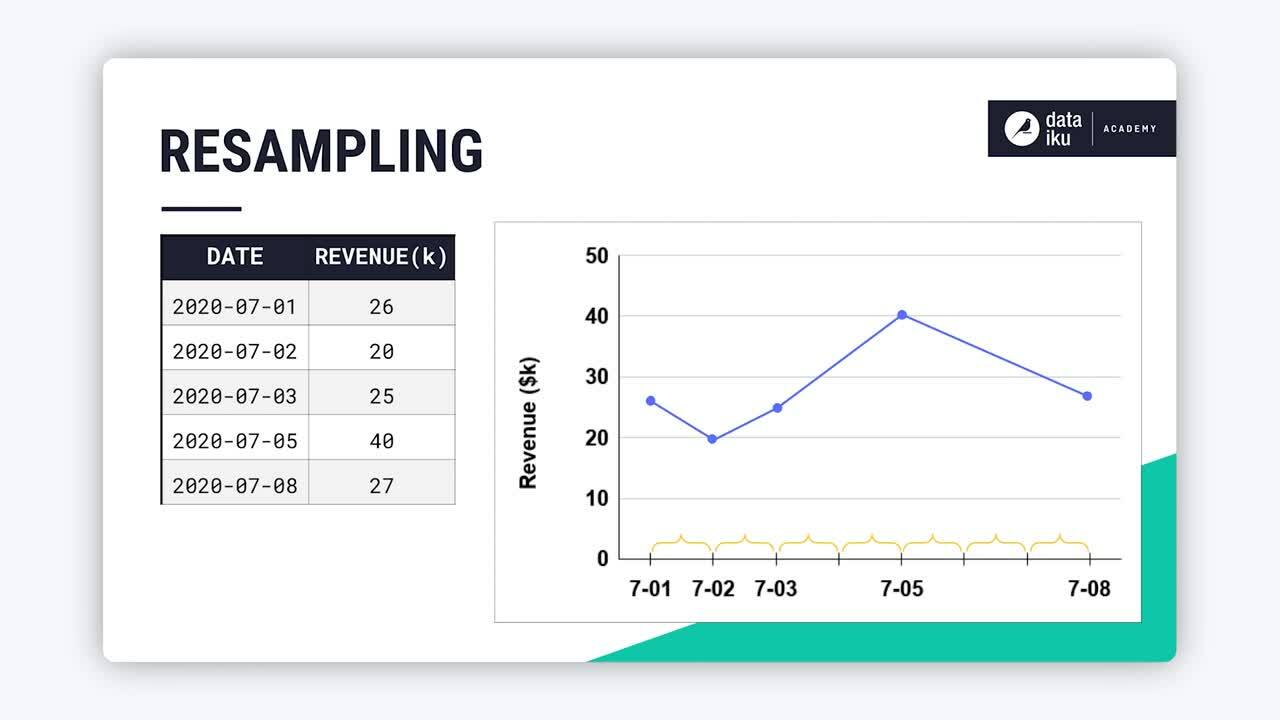
Now, let’s start learning about resampling and its application through the use case of revenue from T-shirt sales over time!
Resampling introduction#
Time series resampling is a technique used to change the frequency of the time intervals in a time series dataset. You’ll often want to fill in missing dates in your datasets.

One reason is because many time series models (like ARIMA) assume that you provide equispaced data, meaning that each data point within a time series is uniformly separated by a consistent time interval.

Once you have resampled your data, you need to add values to the new date records! Let’s see how to do so using data imputation.
Data imputation#
In the context of data analysis and statistics, data imputation refers to the process of replacing missing or incomplete data with estimated values. In Dataiku, you have the following built-in imputation methods:
Method |
Definition |
|---|---|
Interpolation |
Estimates the values of a time series between observed data points. |
Extrapolation |
Predicts values beyond the observed range of a dataset. |
Non-numerical imputation |
Fills in categorical values during interpolation and extrapolation. |
Imputation techniques#
The table below describes the few options you can choose from for each method.
Type |
Description |
Visualization |
|---|---|---|
Linear |
Connects the points with a straight (linear) line. |

|
Previous |
Carries forward the previous value. |

|
Next |
Populates backwards from the next value. |

|
Quadratic |
Uses a quadratic model. |

|
These are just a few of the possible options. The one you choose will depend on your own understanding and assumptions about the data.
Resampling recipe#
Let’s explore the Resampling recipe. From the example data below, in wide format, we can see that the timestamps aren’t equispaced. Many dates are missing.

To solve this issue, the Resampling recipe lets you:
Choose a timestamp column.
Define your time series format.
Input a time step.
Pick from various resampling methods.
Remove first or final values in the dataset.
Remember that if we don’t interpolate, extrapolate, or impute any values, we end up with new date rows with missing information — so let’s experiment with some techniques!

Constant value interpolation#
One option is to interpolate a constant value like zero. The value you choose will depend on your use case.
In the output, we can see that values of 0 have been added between the original data points. Note that there are null values because we didn’t choose an extrapolation method.

As shown in the image, the first sale of men’s black T-Shirts was for 19 dollars. The next purchase was about one month later for 57 dollars. All dates between those dates had a 0 filled in.
Extrapolation#
To reiterate, because we didn’t perform any extrapolation, Dataiku didn’t insert any values before any individual series began. That’s why there are still missing values before the first recorded value for some time series.
We can fill the missing values with zeros so we have a common start and end date for each time series in the dataset by using the same interpolation method for extrapolation.

Clip series#
Before moving on to data analysis, we may want to shorten the series. For the first month, sales are sparse. Perhaps we don’t want to include this data. The plugin makes it easy to clip the series from the beginning or the end in the same time unit as the resampling parameter.
In this case, we removed 31 days from the beginning of the time series:

See also
You can try using the Resampling recipe yourself in Tutorial | Time series preparation.
Resampling during model design#
The Resampling recipe is a powerful tool, but you might not always need to create an extra recipe for resampling. In fact, resampling is a step that’s embedded in the model design phase of visual time series modeling.
Most of the configurations in this panel are analogous to the Resampling recipe settings.

Next steps#
Now that you know the basics of resampling, you can do further data preparation like calculating total sales per month or a rolling 7-day average, for example.
Next, see how to identify periods when data values are within a given range under certain conditions using the Interval Extraction recipe!