

Concept | In-database charts#
Dataiku can render charts using either its default DSS engine or a connected database’s own engine. The choice affects both which data gets used and how fast charts render.
By default, Dataiku uses the DSS engine to process the data used for creating charts. It renders the charts on the same data sample that’s chosen in the Explore tab of the dataset.
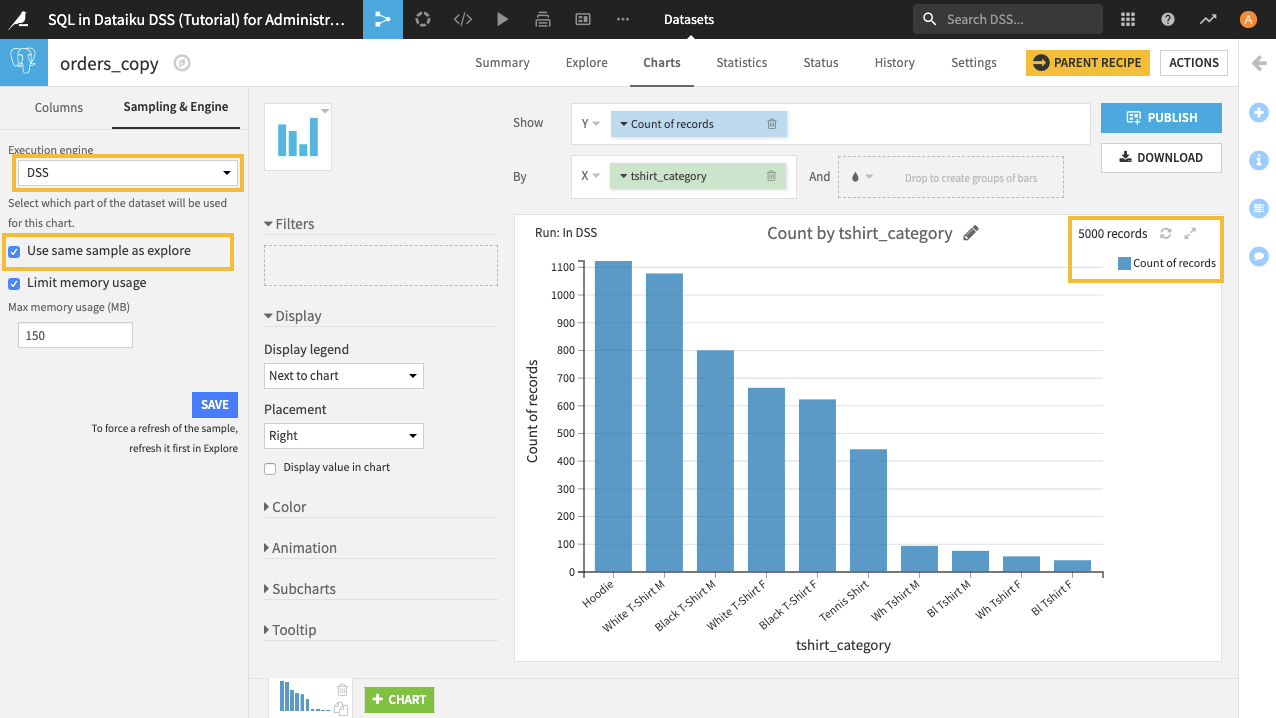
Alternatively, selecting a database engine to process the data uses the full dataset for creating charts, and can speed up computation, so that charts render faster.
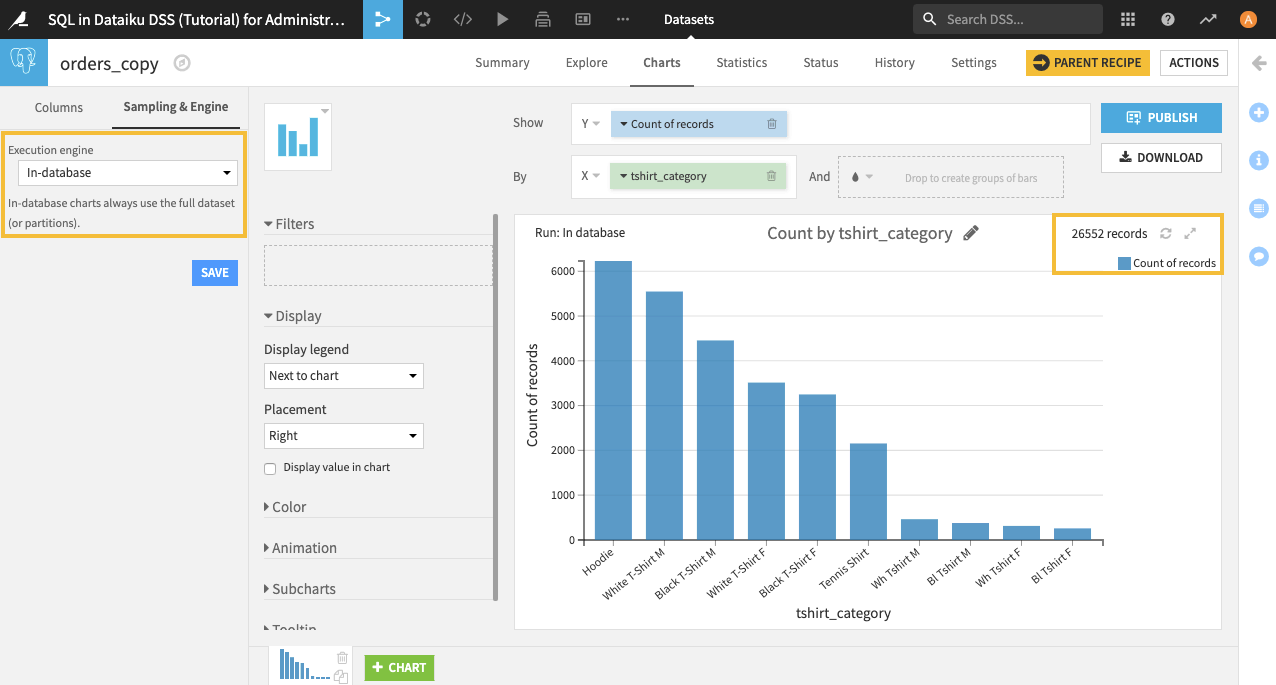
If the dataset is large, try choosing a dedicated engine when you want to render charts on the entire dataset.
See also
For more information, see Sampling & Engine in the reference documentation.
To try it out for yourself, see Tutorial | In-database data visualization and preparation.