Concept: Static Insights in Dataiku DSS
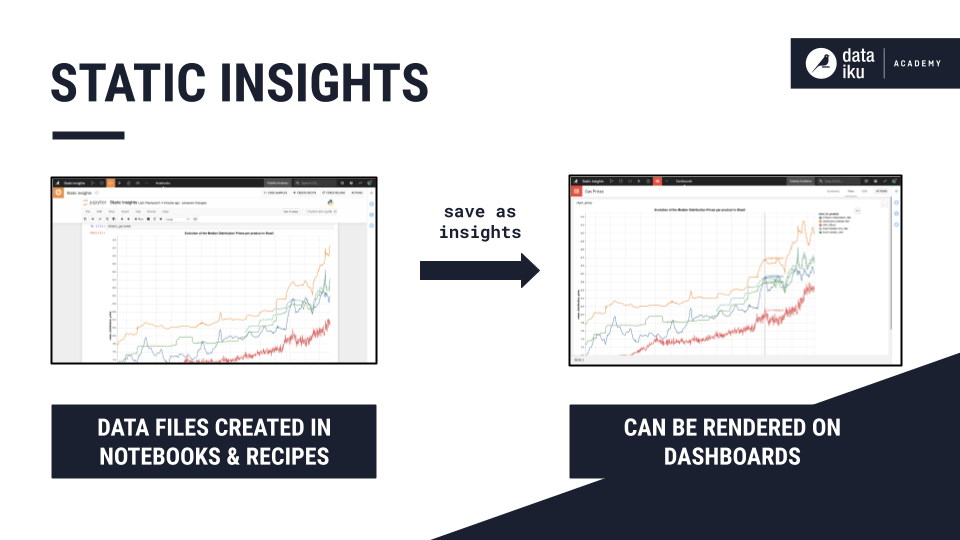
Static insights are data files that are created in Dataiku DSS notebooks and recipes using code, and that can then be rendered on dashboards.
Like webapps, static insights allow coders to create visualizations that are not natively found in Dataiku DSS. These visualizations can then be published on a dashboard and consumed by other users. Unlike webapps, however, static insights are generally stand-alone charts.
Create a Static Insight
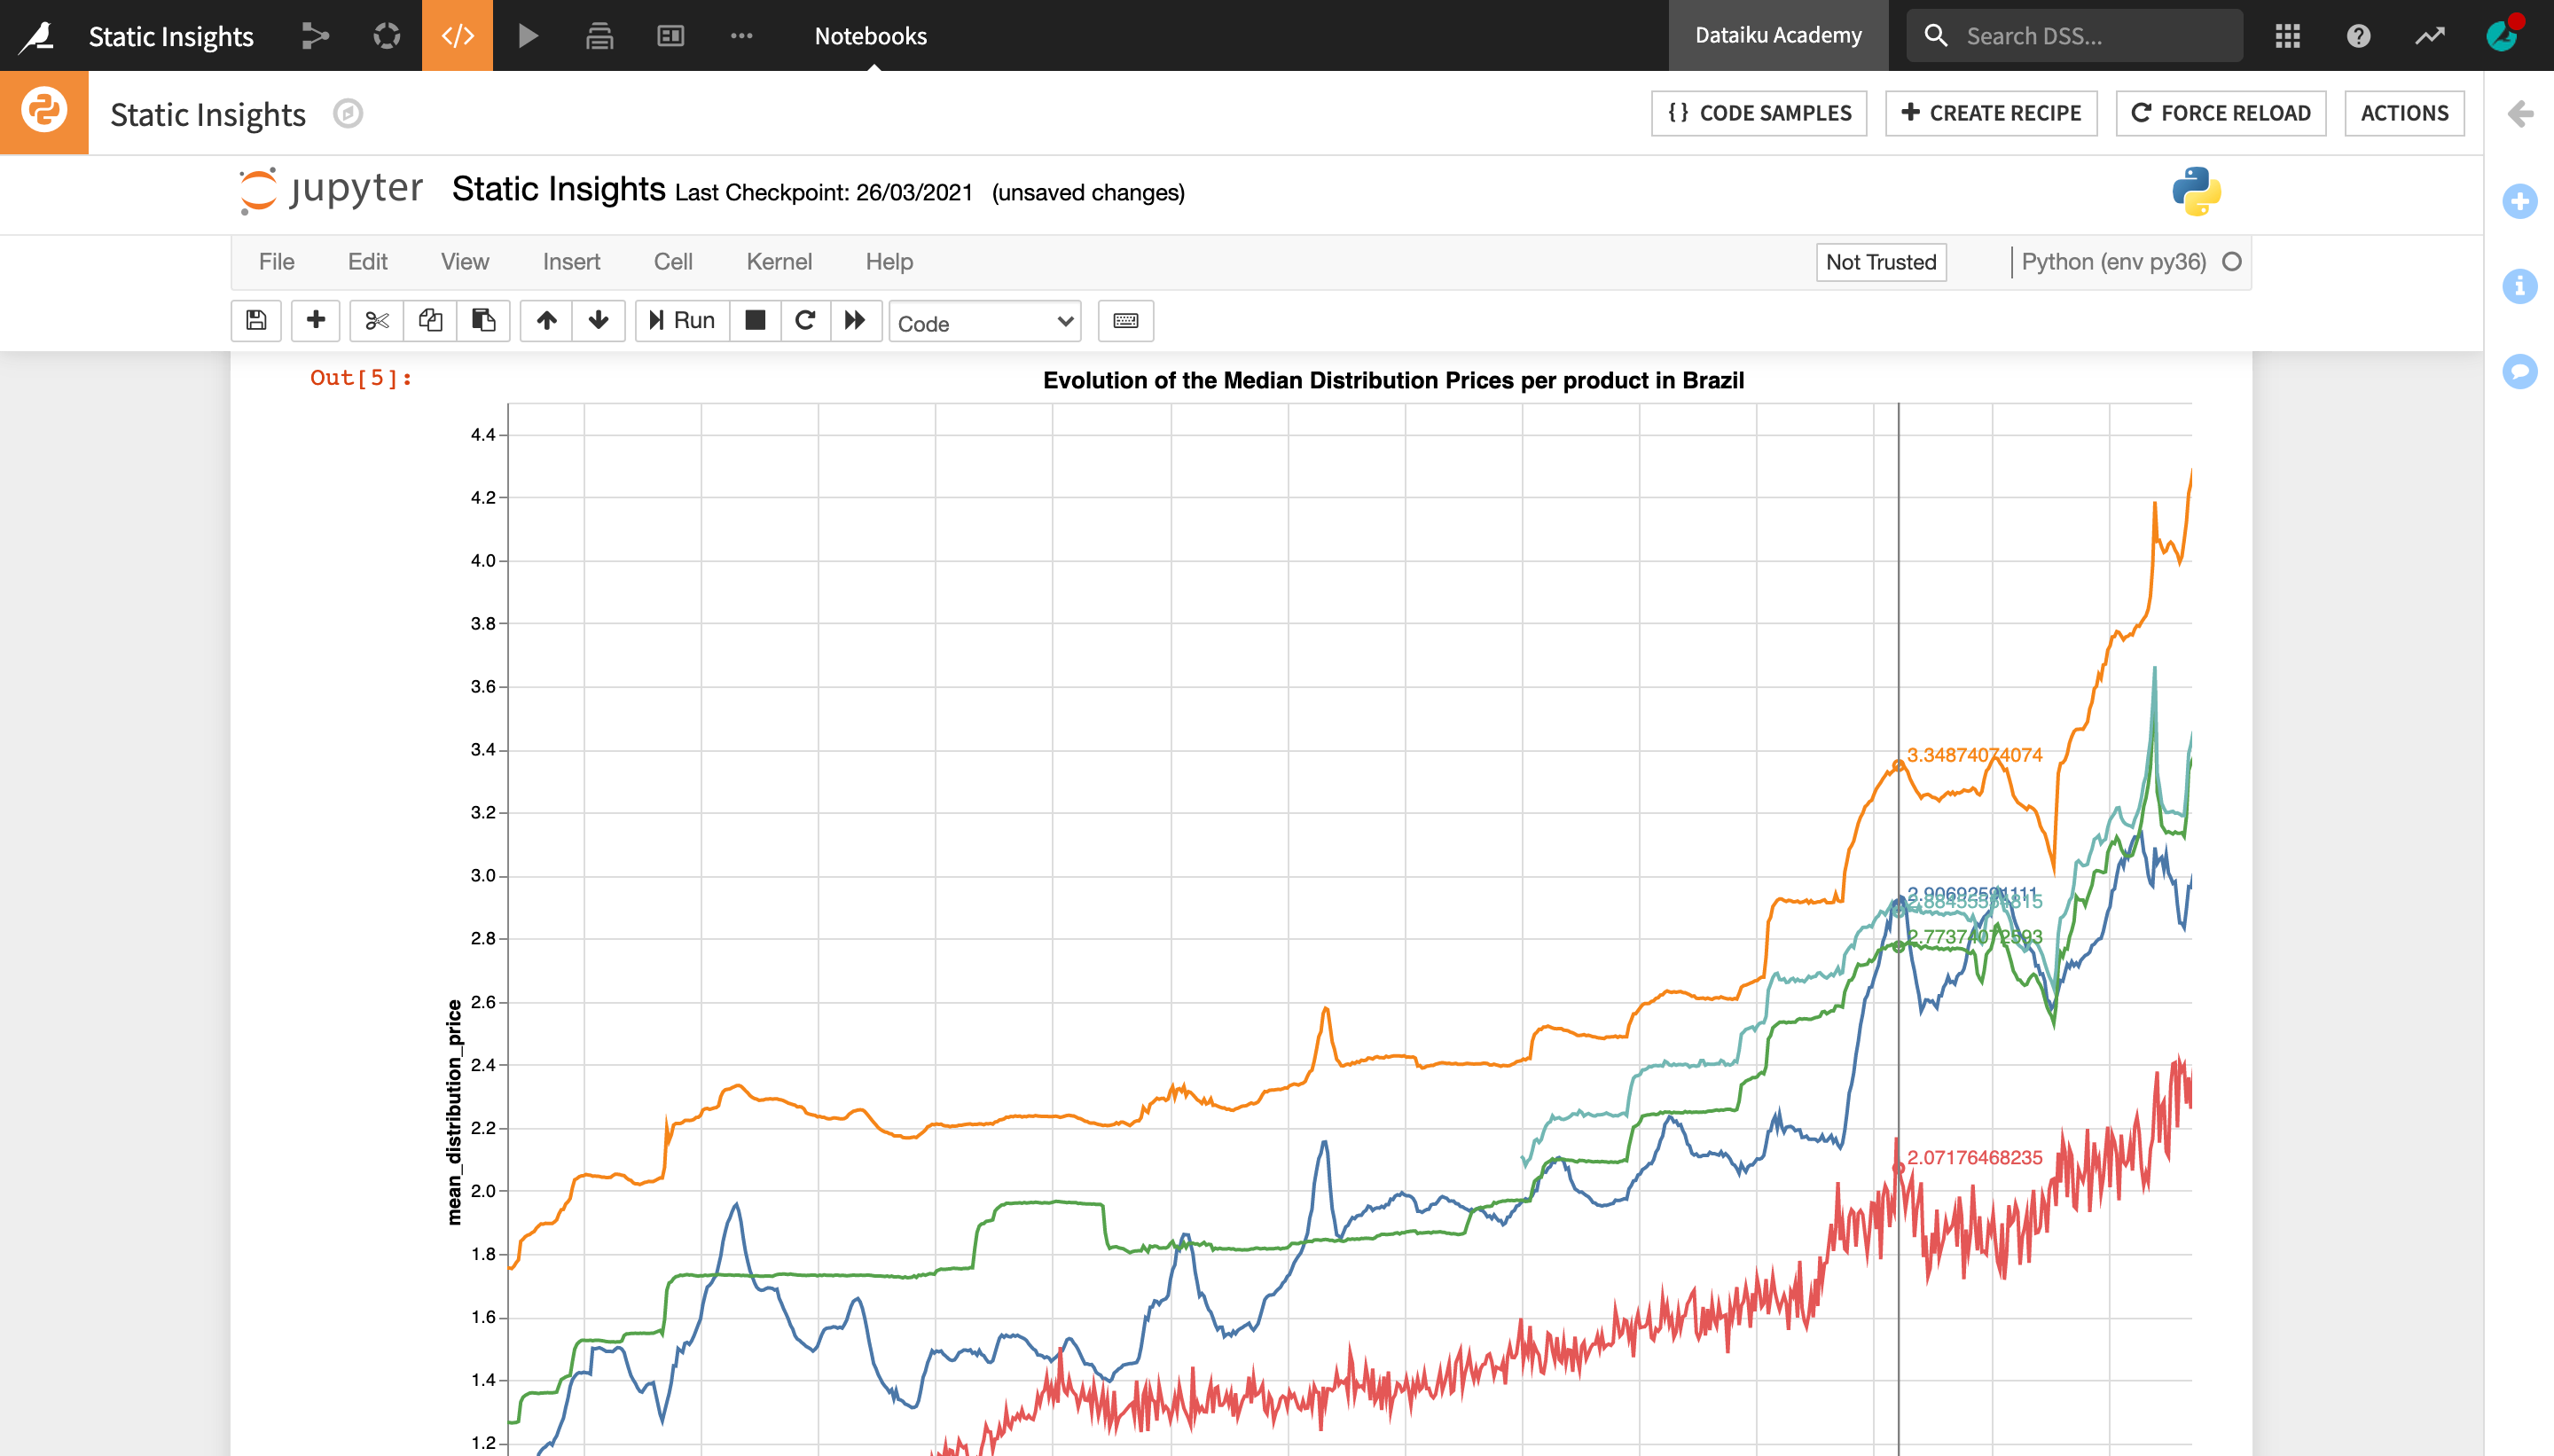
You can leverage any code library in a Jupyter notebook or code recipe to create custom visualizations in Dataiku DSS. You can then display your figure inline with Jupyter notebooks, or better yet by publishing them as consumable static insights in dashboards.
Save a Chart
Dataiku DSS allows you to save a figure from any library as an HTML object or image.
To save a figure as a static insight, you can use the dataiku.insights.save_data() function.
dataiku.insights.save_data(id, payload, content_type, label=None, project_key=None, encoding=None)
Specific “Save” Functions for Popular Code Libraries
Although Dataiku DSS allows you to create and save as static insights visualizations in any Python or R library, it has specific integrations with some of the most popular libraries to make it even easier to save and publish insights.
Instead of the save_data function, when using these libraries, users can leverage a dedicated function which is specific to the given library and its properties, and serves as a convenience wrapper to simplify the process of saving figures as insights.
Python coders can leverage a dedicated “save” function for insights from the following libraries:
For R users, Dataiku DSS provides a dedicated “save” function for the following libraries:
Example: Save Static Insights With Plotly
The process is similar for all integrations, so let’s just take a look at one example and walk through creating static insights with the Python-based Plotly library.
In order to use Plotly in Dataiku DSS, you need to install the plotly package in a code environment.
To create and display a Plotly chart in a Jupyter notebook, you can write your code as you would outside of Dataiku DSS.
You can then save your chart as a static insight using the dataiku.insights.save_plotly function.
Here is an example code:
df = px.data.iris()
fig = px.scatter(df, x="sepal_width", y="sepal_length", color="species")
fig.show()
# fig is a plot.ly figure, or any object that can be passed to iplot()
insights.save_plotly("my-plotly-plot", fig)
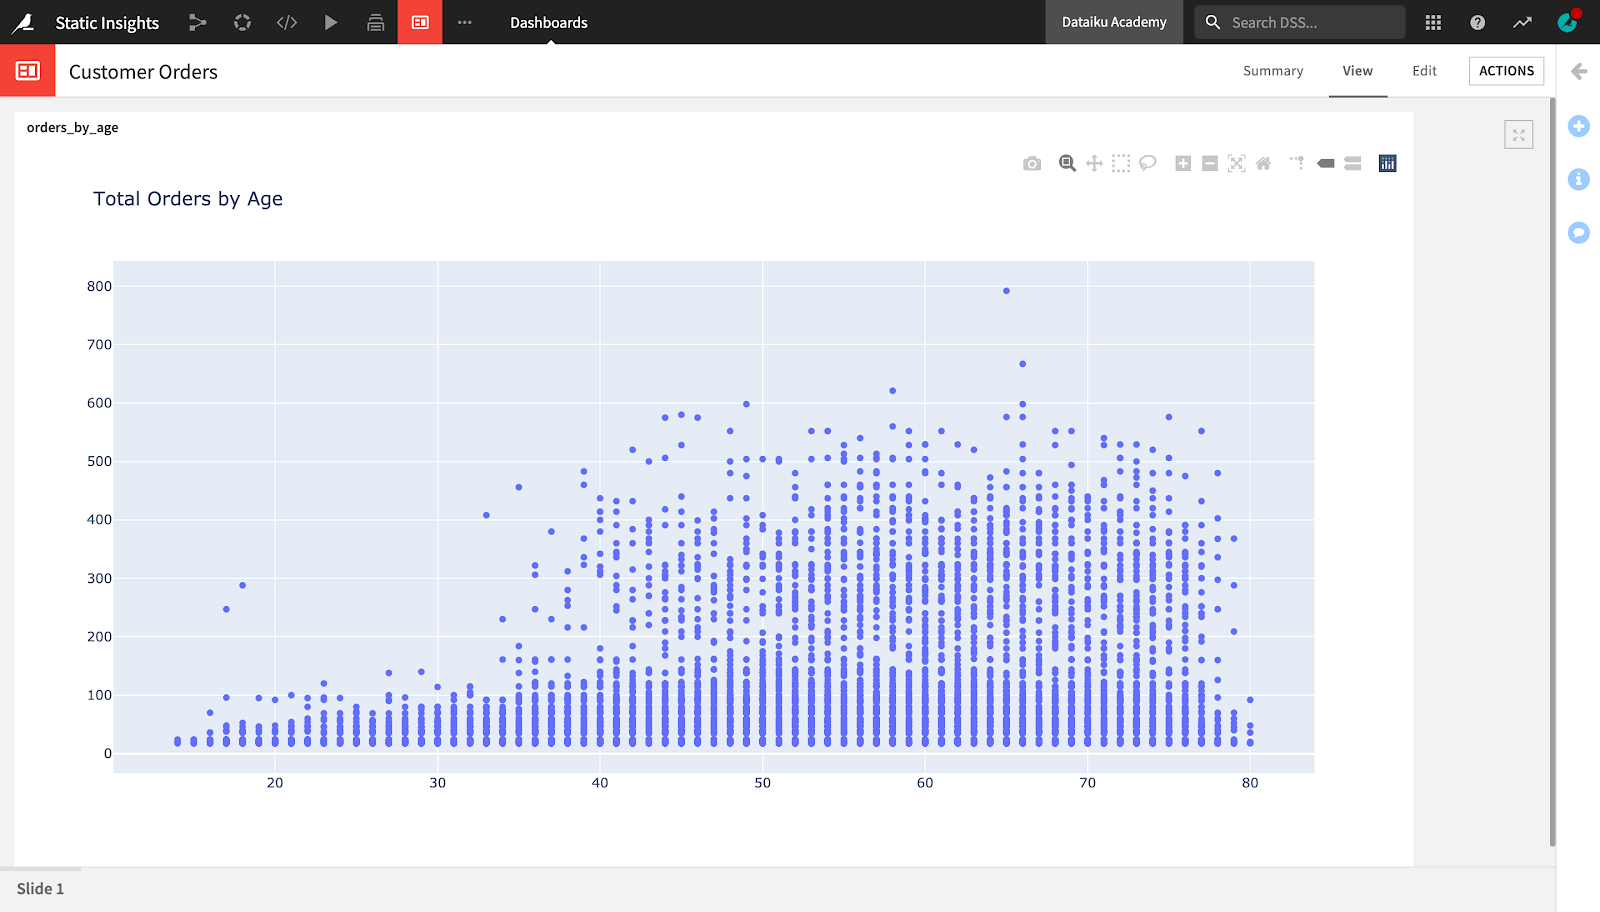
Publish a Static Insight on a Dashboard
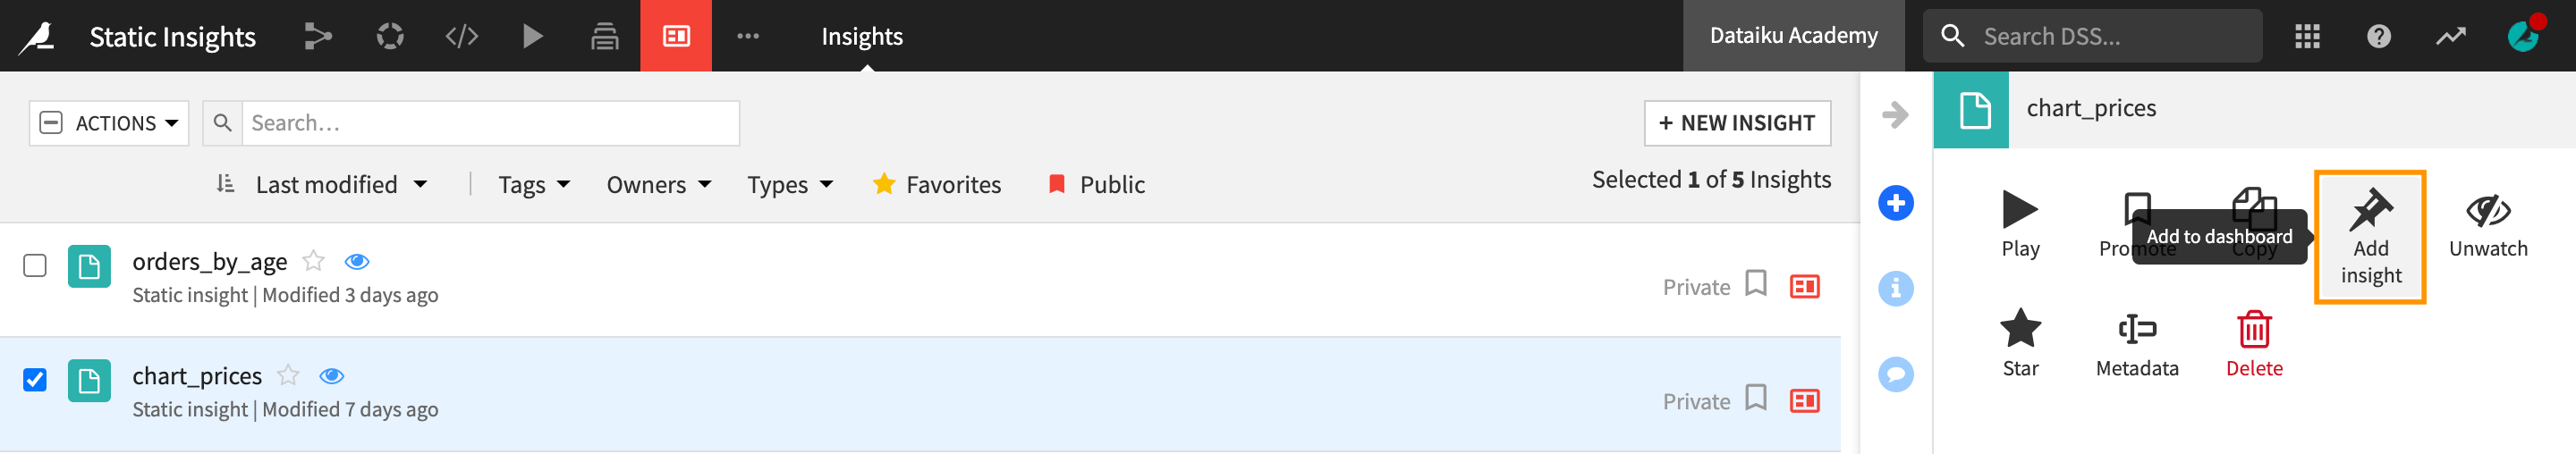
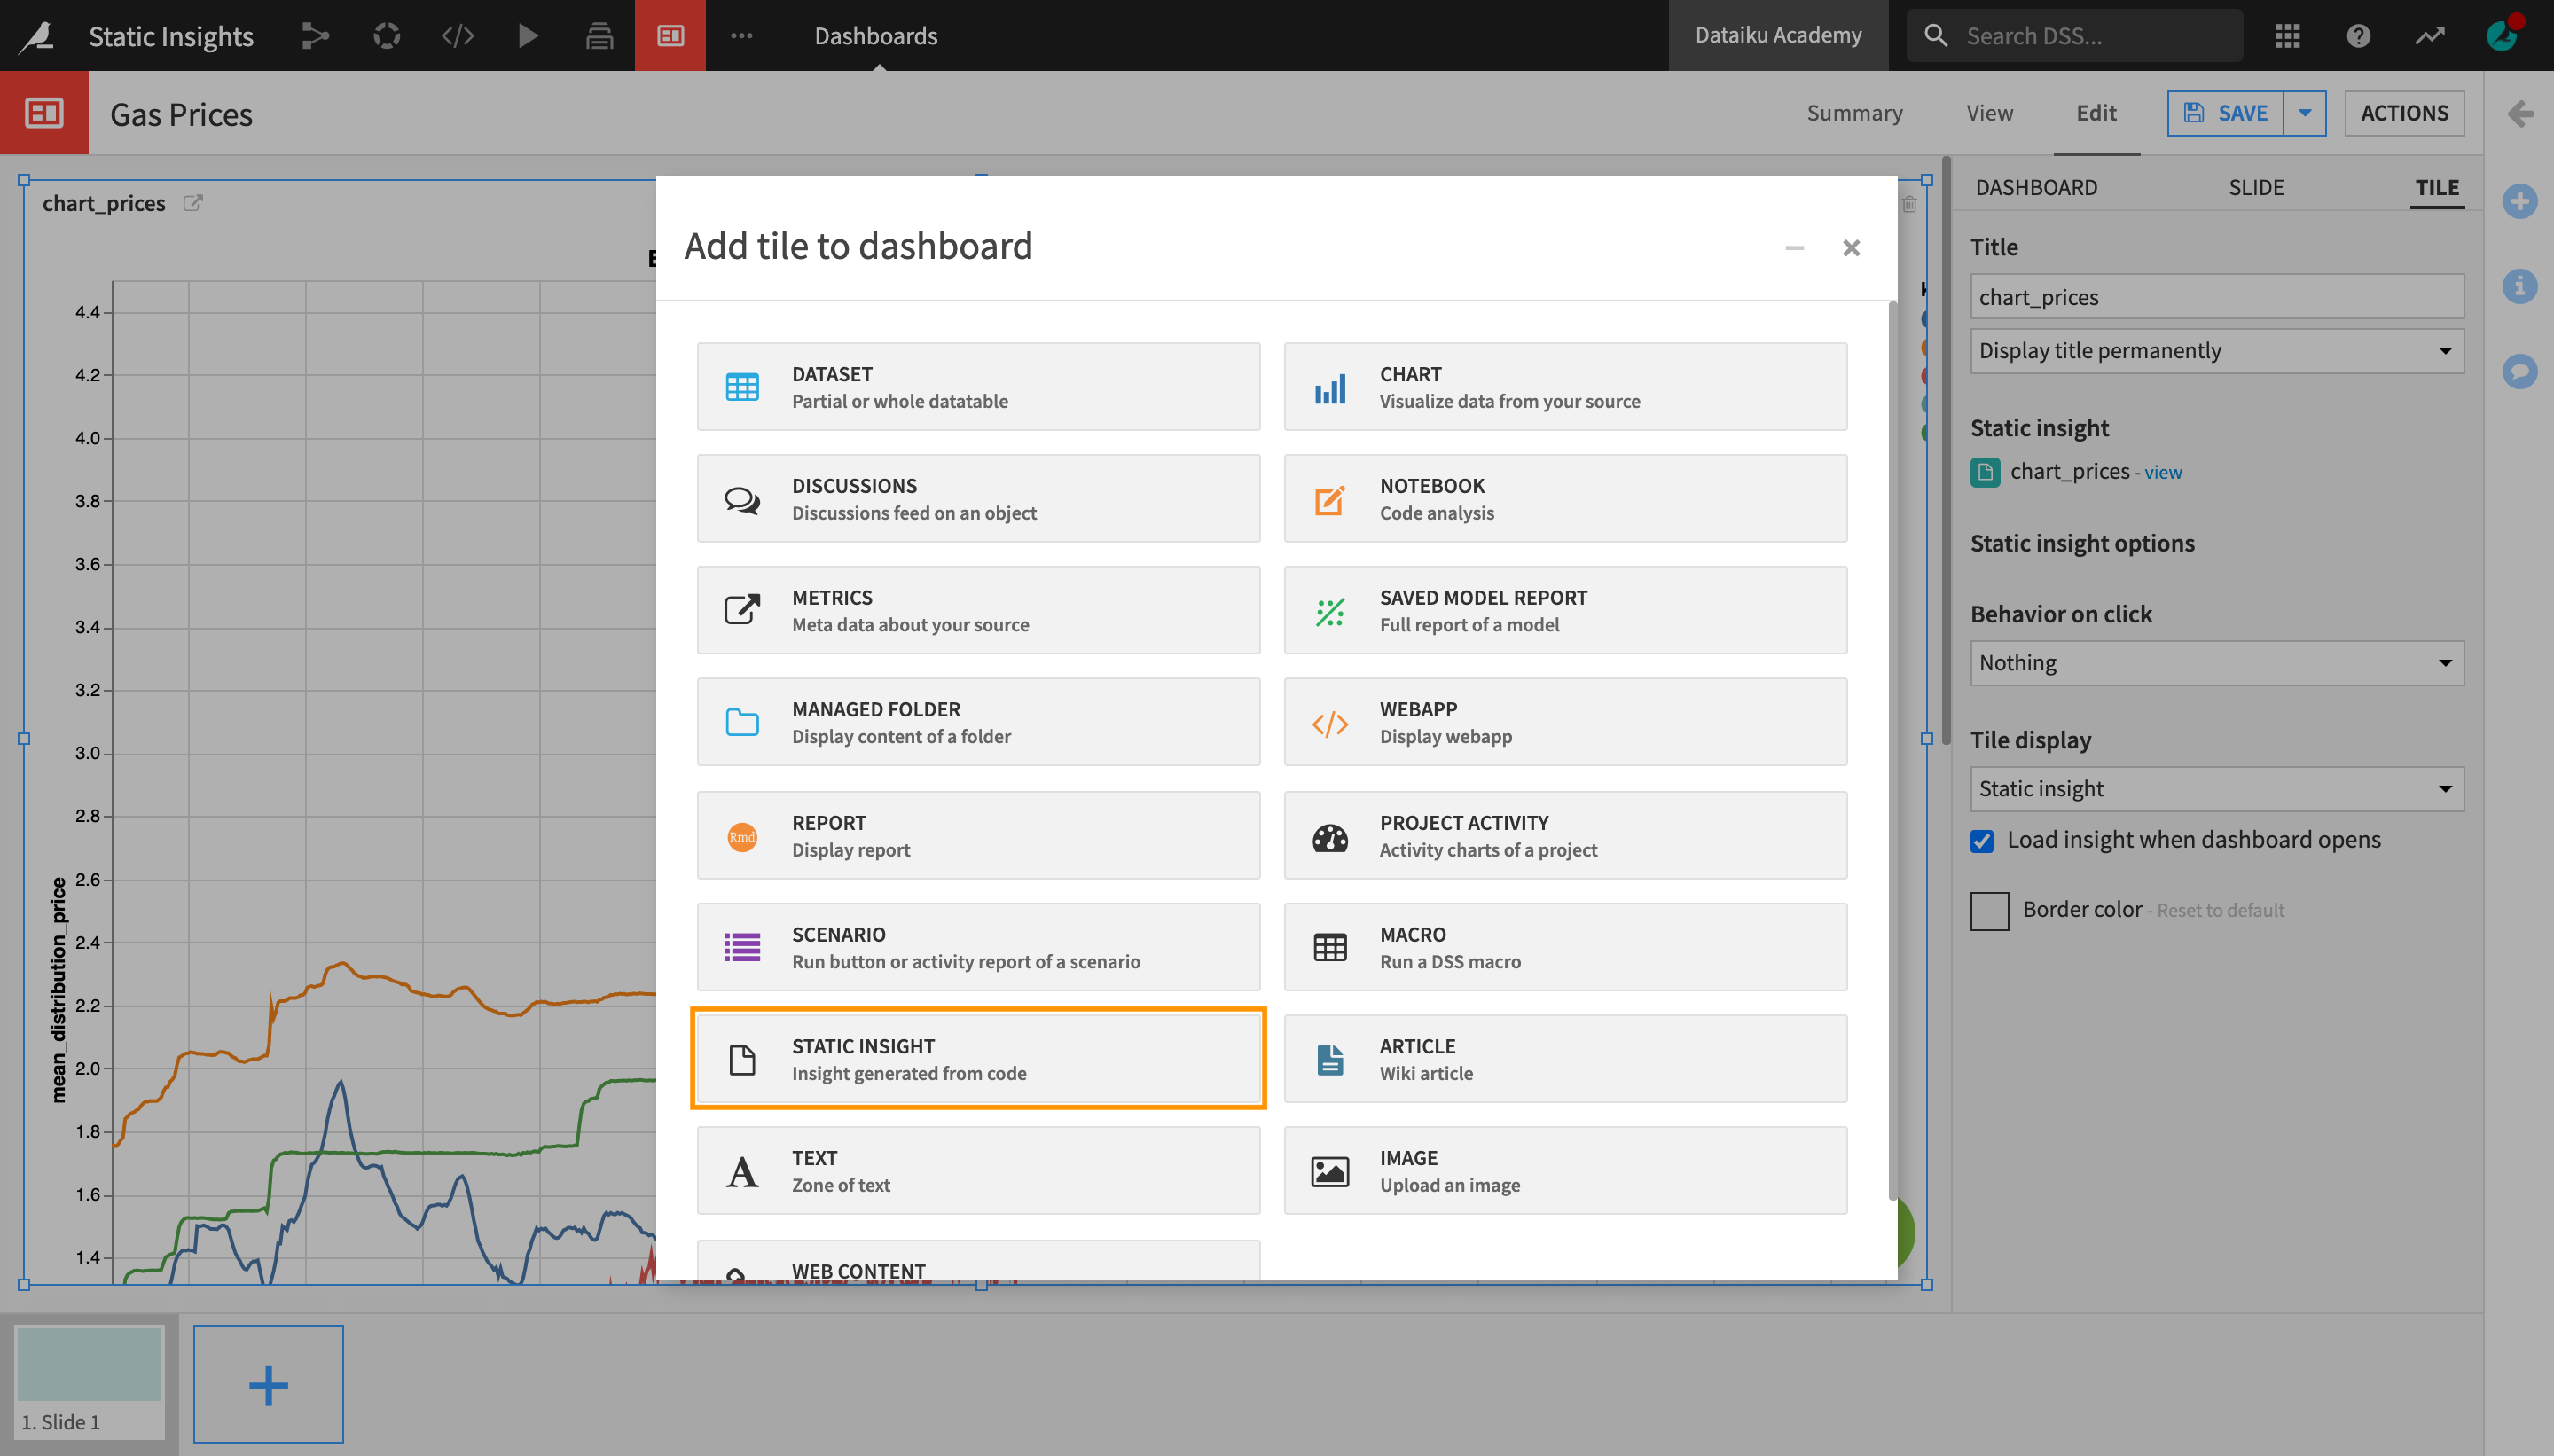
Once saved, your figure will appear in the Insights page and can then be published to a dashboard from the Actions menu, by clicking Add Insight.
You can also publish a figure from the dashboard directly, by clicking the green + Add Insight button and selecting “Static insights” from the menu.
Each published Plotly chart retains its full zoom/pan/select/export capabilities.
Refresh a Static Insight With a Scenario
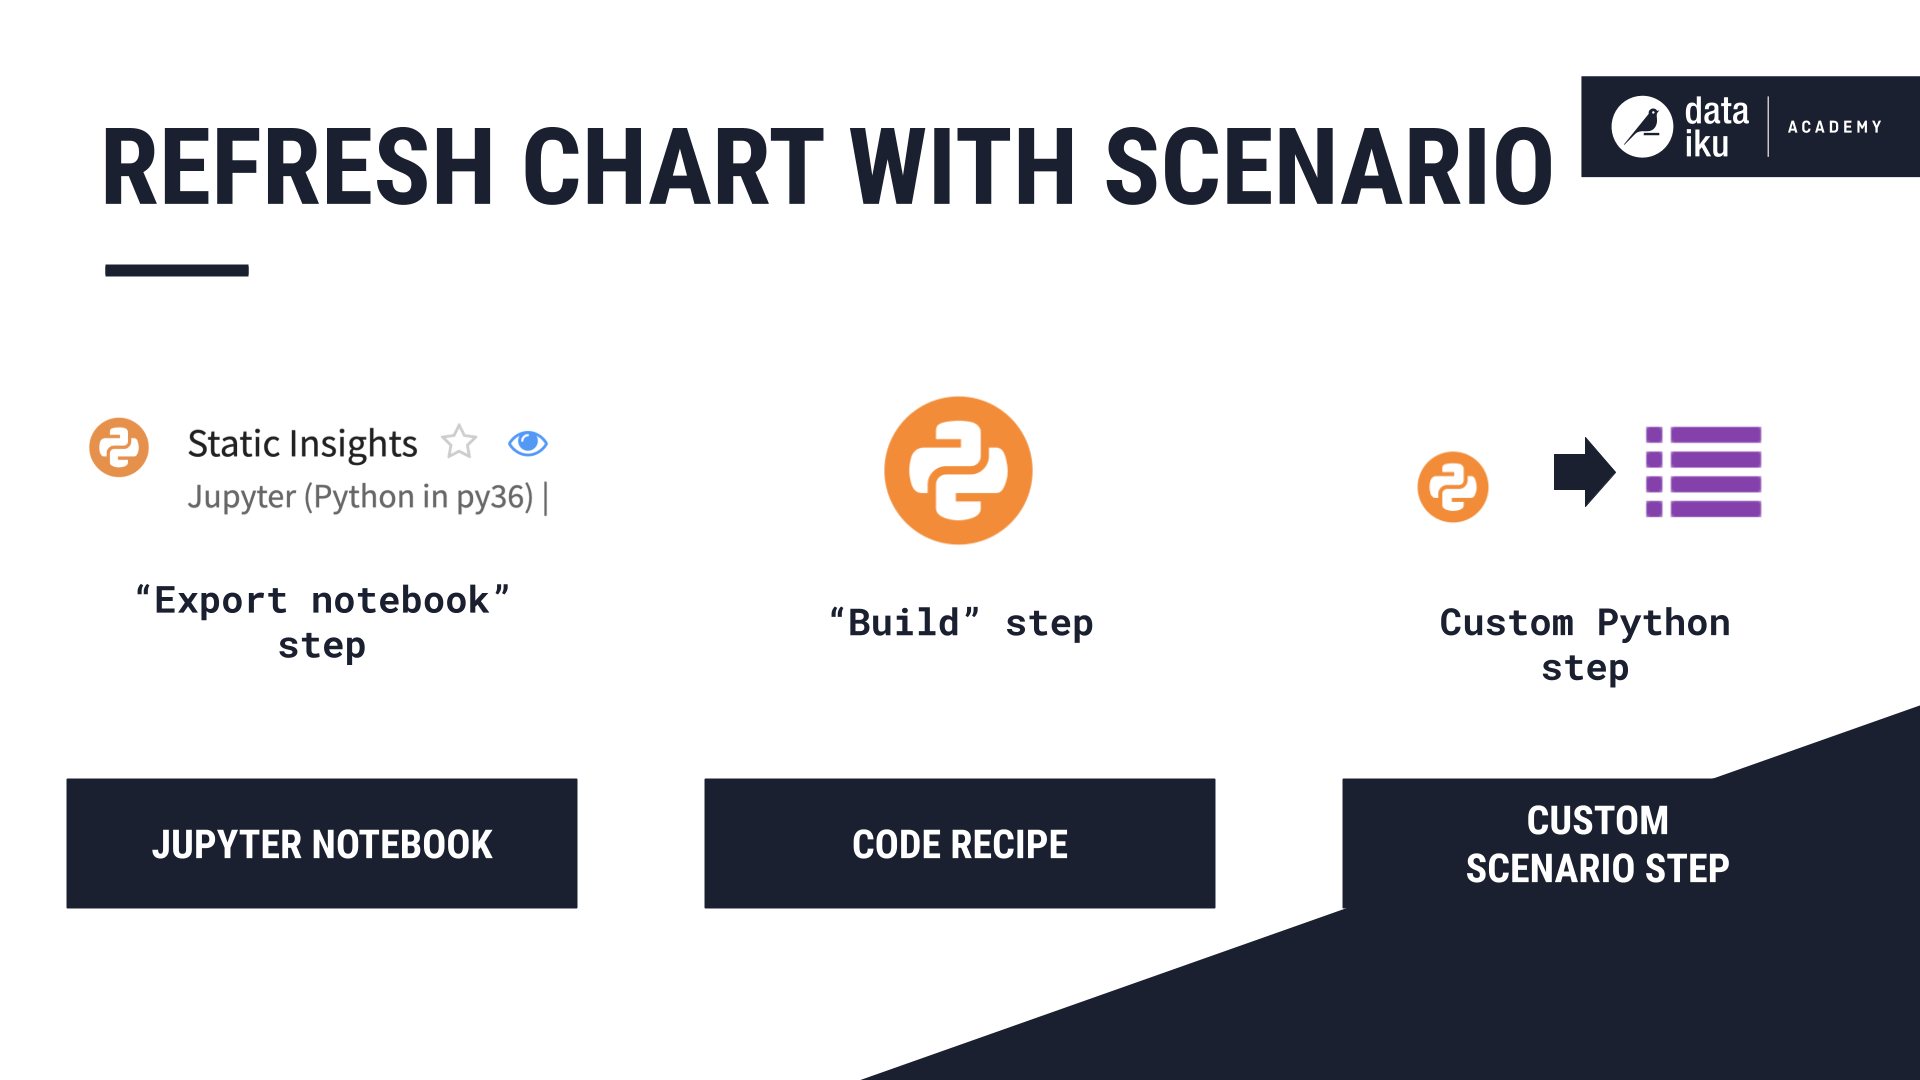
You can refresh static insights automatically by using a scenario to re-run the dataiku.insights() function. This can be done:
by using an “Export notebook” scenario step to refresh the code generating and saving the chart in a Jupyter notebook;
with a regular “Build” scenario step to refresh the code in a Dataiku DSS recipe; or
as a custom Python scenario step.
This article introduced the concept of static insights, and how you can leverage static insights to display custom visualizations in Jupyter notebooks and dashboards. Now you can create and share your own consumable static insights in Dataiku DSS!