News Sentiment Stock Alert System
Overview
Business Case
When managing stock portfolios of hundreds or thousands of stocks, it is necessary but challenging or impossible to follow the news happening for each of them.The volume of potentially market-moving information is too large to handle manually. In this project news headlines are pulled and linked with market data to learn which news items are most impactful. As a result of this model, fresh news headlines loaded in real time are linked with firms in the market and transformed into volatility scores. This score enables the user to focus on the stocks deemed more likely to exhibit anomalous moves as a result.
Technical Requirements
To leverage this solution, you must meet the following requirements:
Have access to a DSS 9.0+ instance.
A python 3.6 code environment named
solution_stock-alert-systemwith the following required packages:
html5lib
bs4
scikit-learn>=0.20,<0.21
yfinance
dash==2.3.1
dash_core_components
dash_bootstrap_components
dash_html_components
dash_table
tzlocal
Installation
Once your instance has been prepared, you can install this solution in one of two ways:
On your Dataiku instance click + New Project > Industry solutions > Financial Services > News Sentiment Stock Alert System.
Download the .zip project file and upload it directly to your Dataiku instance as a new project.
Note
If running a DSS 9 instance, the solution is found by navigating to + New Project > Sample Projects > Solutions > News Sentiment Stock Alert System.
Data Requirements
The Dataiku flow is built using publicly available data on stock prices and the news. They are retrieved using EOD but will require a user-specific API key. This project does not require any other data to successfully run. Customizations on what stocks and news are retrieved can be completed using the Dataiku Application. There are scenarios which can be set to run at specified time intervals in order to update the stocks prices and news automatically.
Workflow Overview
You can follow along with the sample project in the Dataiku gallery.
The project has the following high level steps:
Input the list of tickers and news source on which the analysis will be done with a Dataiku Application
Retrieve stock prices and news into partitioned datasets
Analyze the stock prices to detect anomalies
Train a model to predict stock price anomalies using the news
Score real time data to produce risk scores and impact rankings
Visualize data using a pre-built Webapp and Dashboard insights
Walkthrough
Note
In addition to reading this document, it is recommended to read the wiki of the project before beginning in order to get a deeper technical understanding of how this solution was created, the different types of data enrichment available, longer explanations of solution specific vocabulary, and suggested future direction for the solution.
Tailor the Alert System to your interests
By default the project already contains tickers for the S&P 500 stocks. The project can be used as-is or overridden by inputting a new list of tickers to the Dataiku Application. To begin, you will need to create a new instance of the News Sentiment Stock Alert System Application. This can be done by selecting the Dataiku Application from your instance home, and click Create App Instance.
Once the new instance has been created you can begin by (optionally) uploading a new list of tickers. The dataset should contain a first column called ticker with the ticker name (e.g. AAPL) and a second column named company with the corresponding company name (e.g. Apple Inc.). The lookback period can also be changed in this first section. The minimum lookback window that won’t degrade performance of the models is 90.
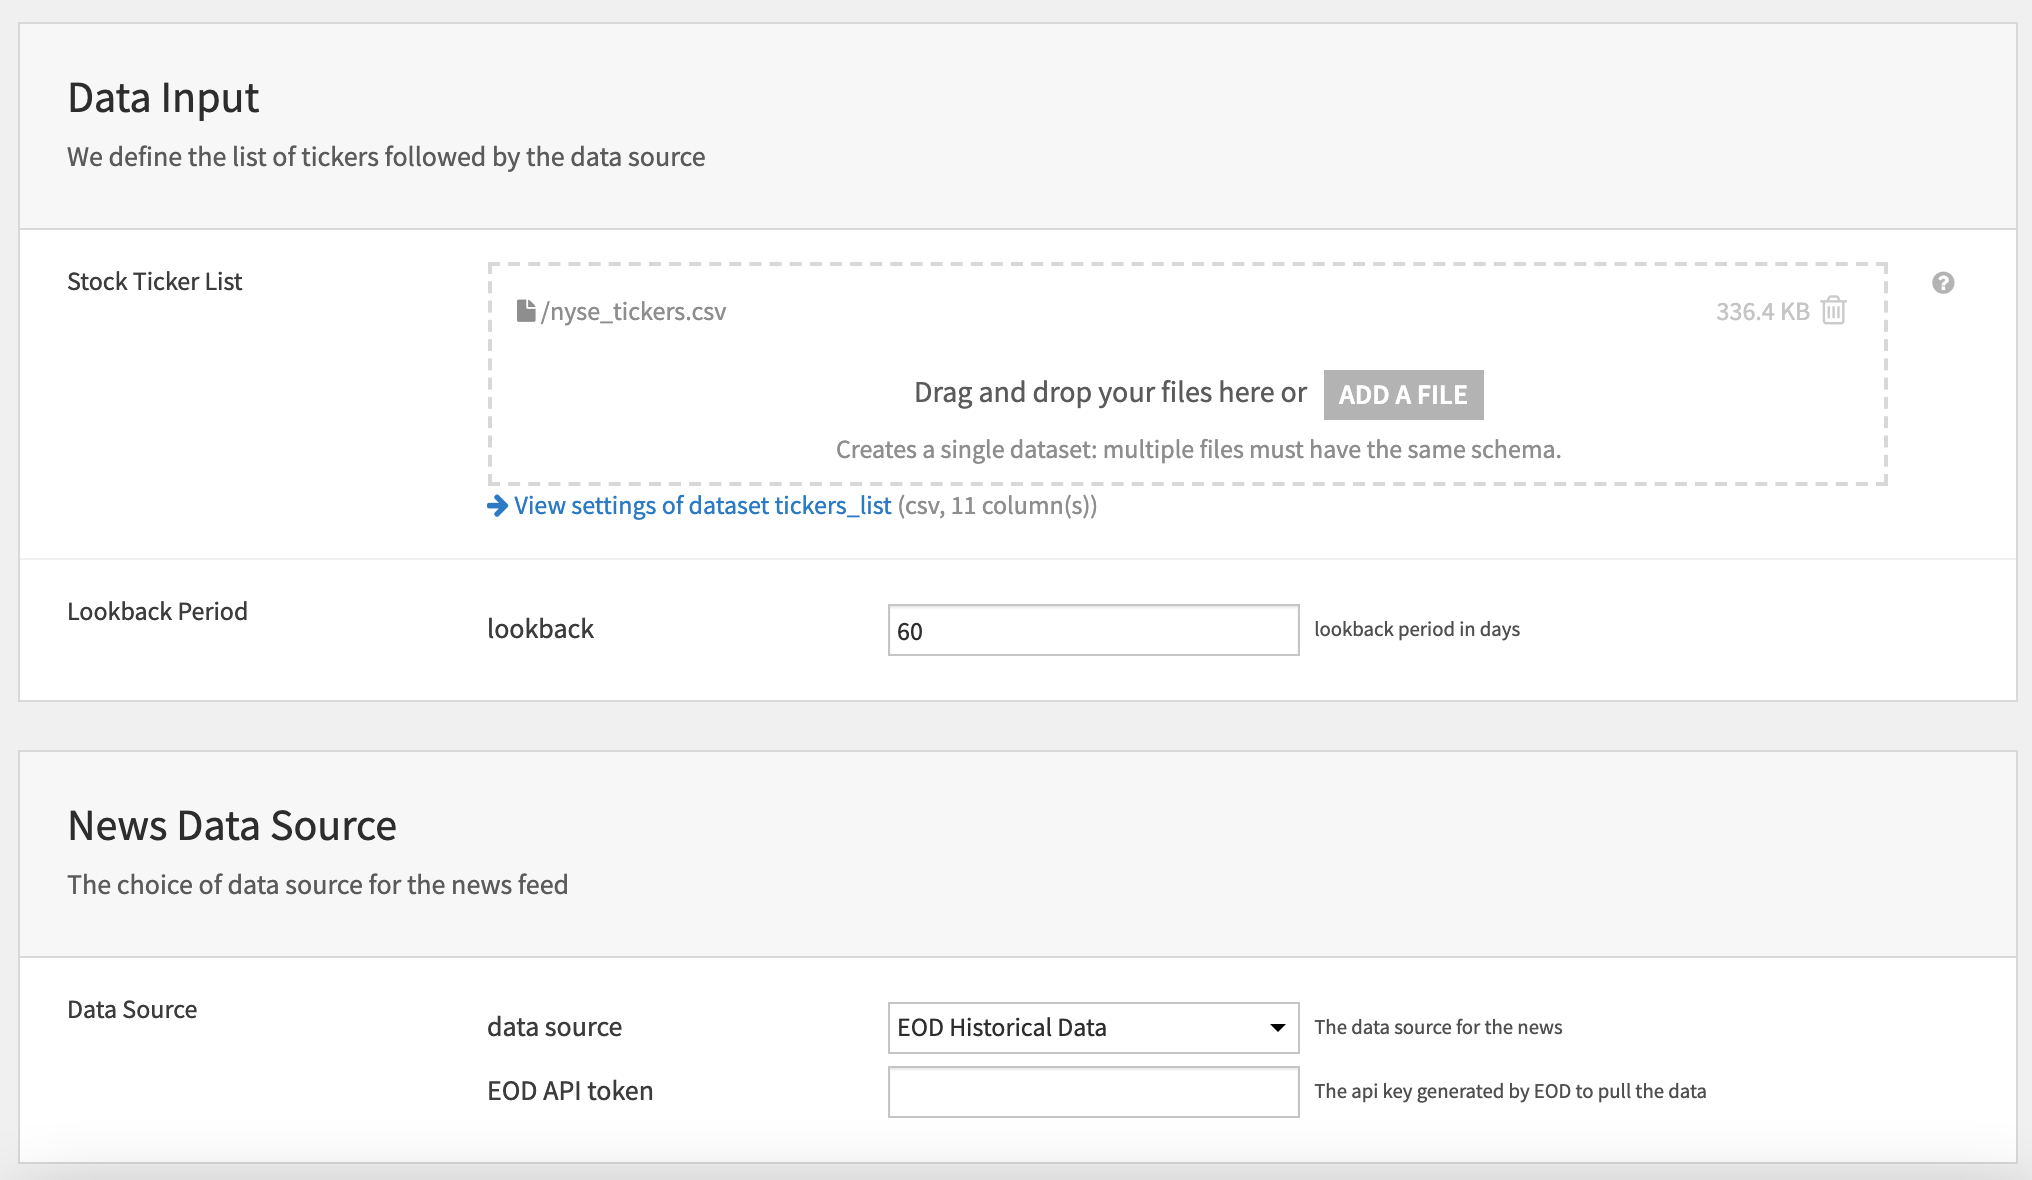
When running the app using the paid EOD service, an API key will be needed. Building the project will update the flow with the new stocks data and news source.
Retrieve Stock Prices and The News
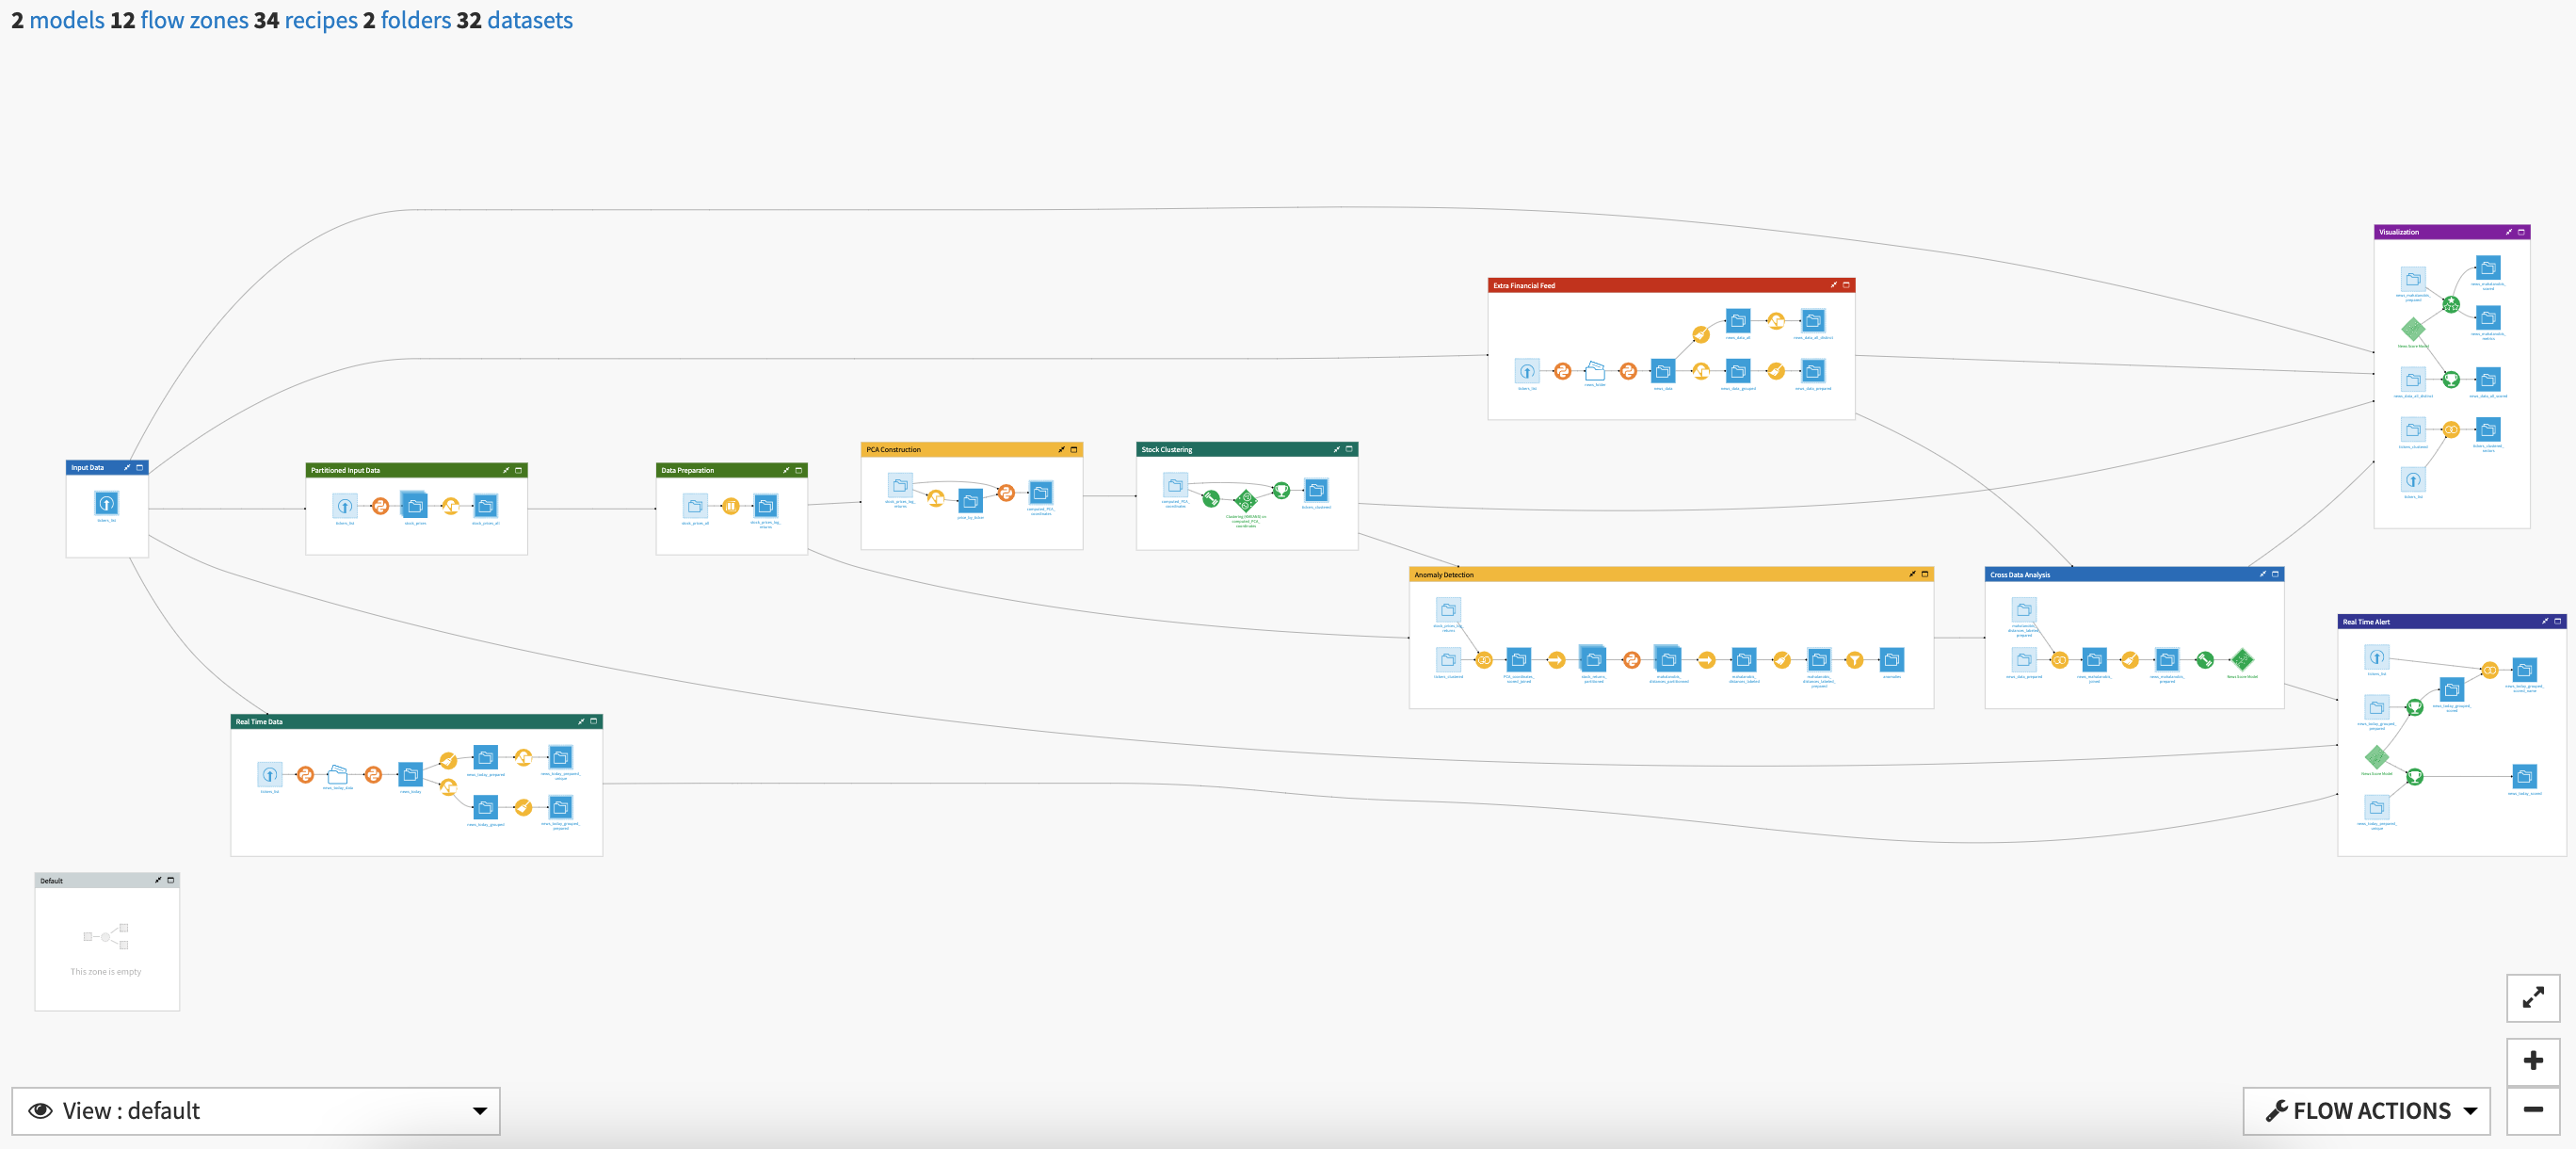
There are 4 flow zones involved in managing the incoming data of the project:
The Input Data zone contains the ticker_list on which analysis will be run. This can be customized using the Dataiku Application.
The Partitioned Input Data zone retrieves the stock prices based on the list of tickers provided. The dataset stock_prices is partitioned by date before being grouped to ensure there are no duplicates.
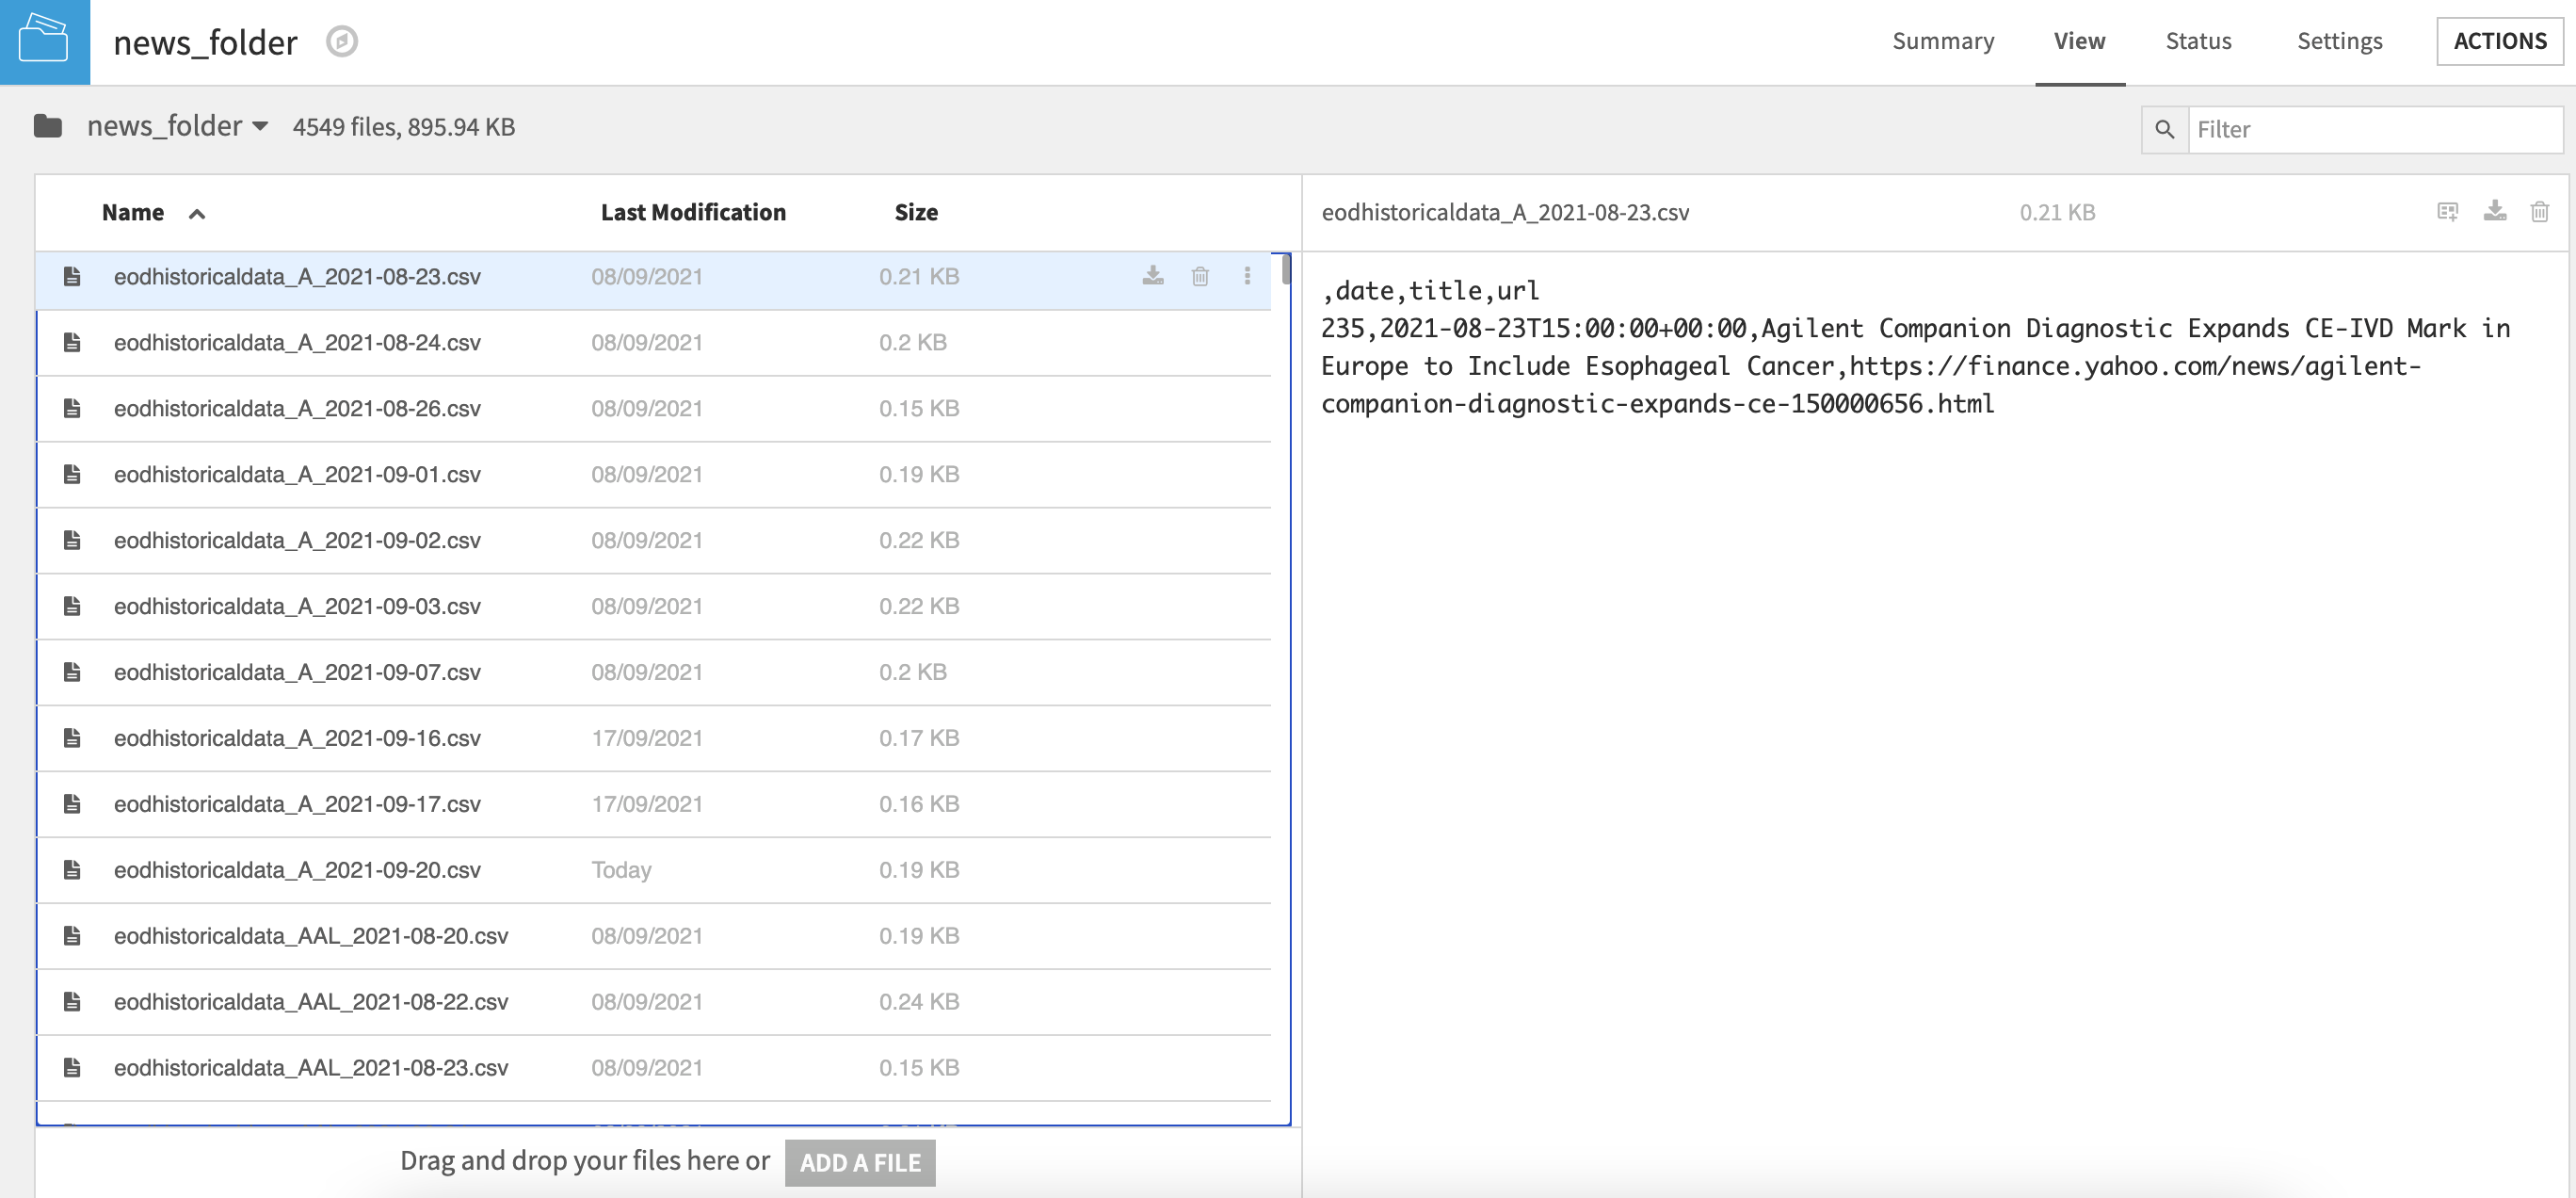
The Extra Financial Feed zone retrieves news via a python recipe which writes one file per day and stock into a folder. A second python recipe creates a flat file with relevant information before news article titles in the file are concatenated to have one line per stock and day. A prepare recipe is used to process the text.
Finally, the Real Time Data zone only pulls in news data for the current day.
Detect Anomalies in Stock Prices
An anomaly is defined as a move that is peculiar with regards to the historical moves of a stock. Further detail on what we consider as “peculiar” behavior for stocks in this solution, how we cluster stocks, and the anomaly detection algorithm used is detailed in the Anomaly Detection section of the wiki.
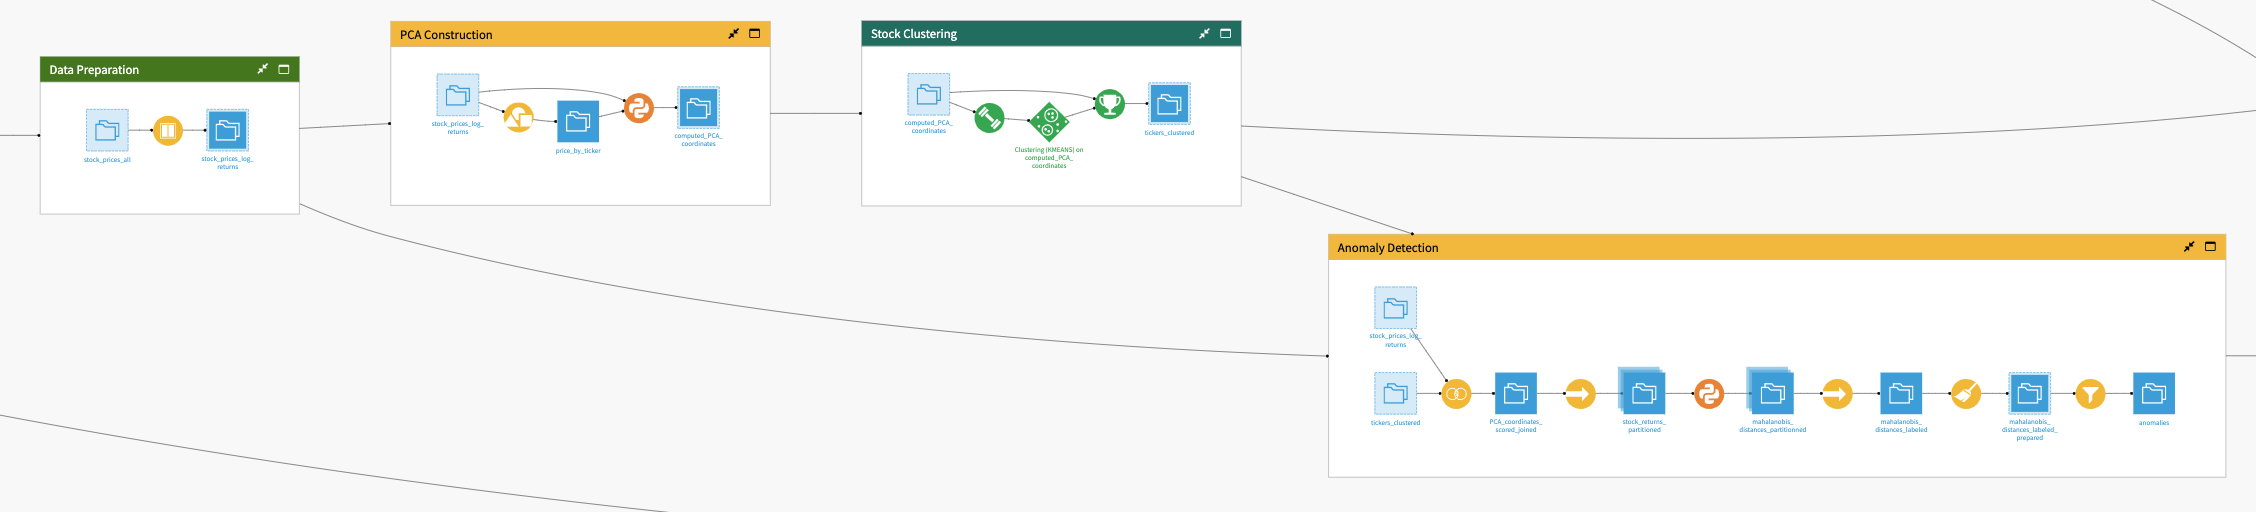
The analysis to detect anomalies is comprised of 4 parts:
To begin, stock prices are processed in order to compute the log returns in the Data Preparation zone.
Within PCA Construction, a python recipe takes the data with the log returns from the previous zone, computes the covariance matrix and then runs the Principal Components Analysis (PCA). The recipe outputs the coordinates on the first four Principal Components for each stock.
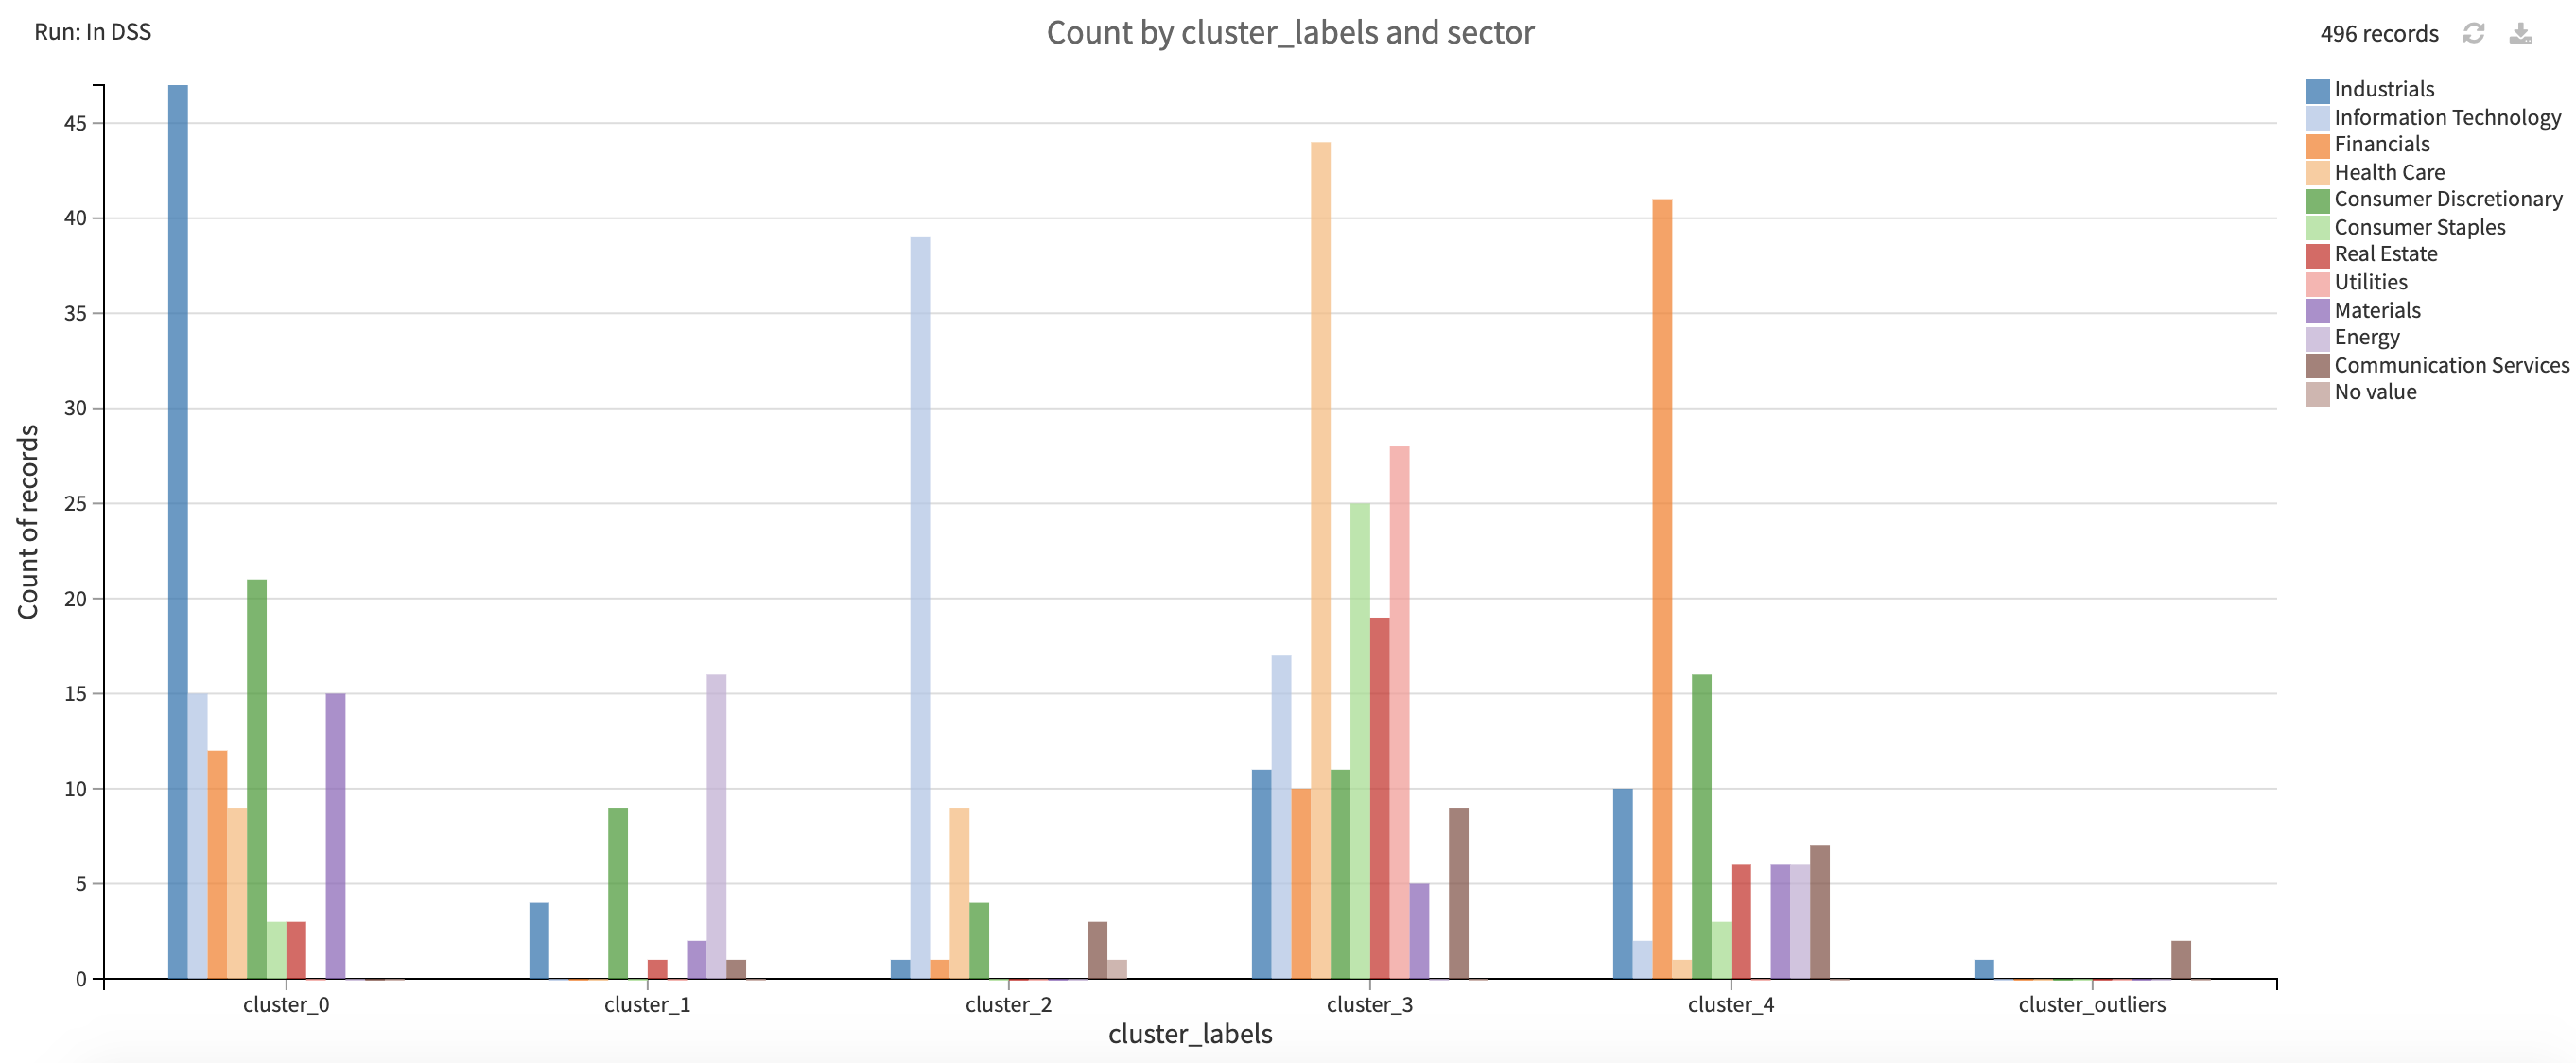
The Stock Clustering zone takes the PCA coordinates and runs clustering on the stocks using a K-Means algorithm. The algorithm and cluster number (8) used for this solution was chosen for its simplicity but other algorithms could be tried for more in depth cluster analysis.
The Anomaly Detection zone partitions the initial log return dataset using the clusters output from the Stock Clustering zone so that anomaly detection is run on each partition independently. Anomaly detection is based off of Mahalanobis Distance computations run within a python recipe and labelled based on a predefined threshold.
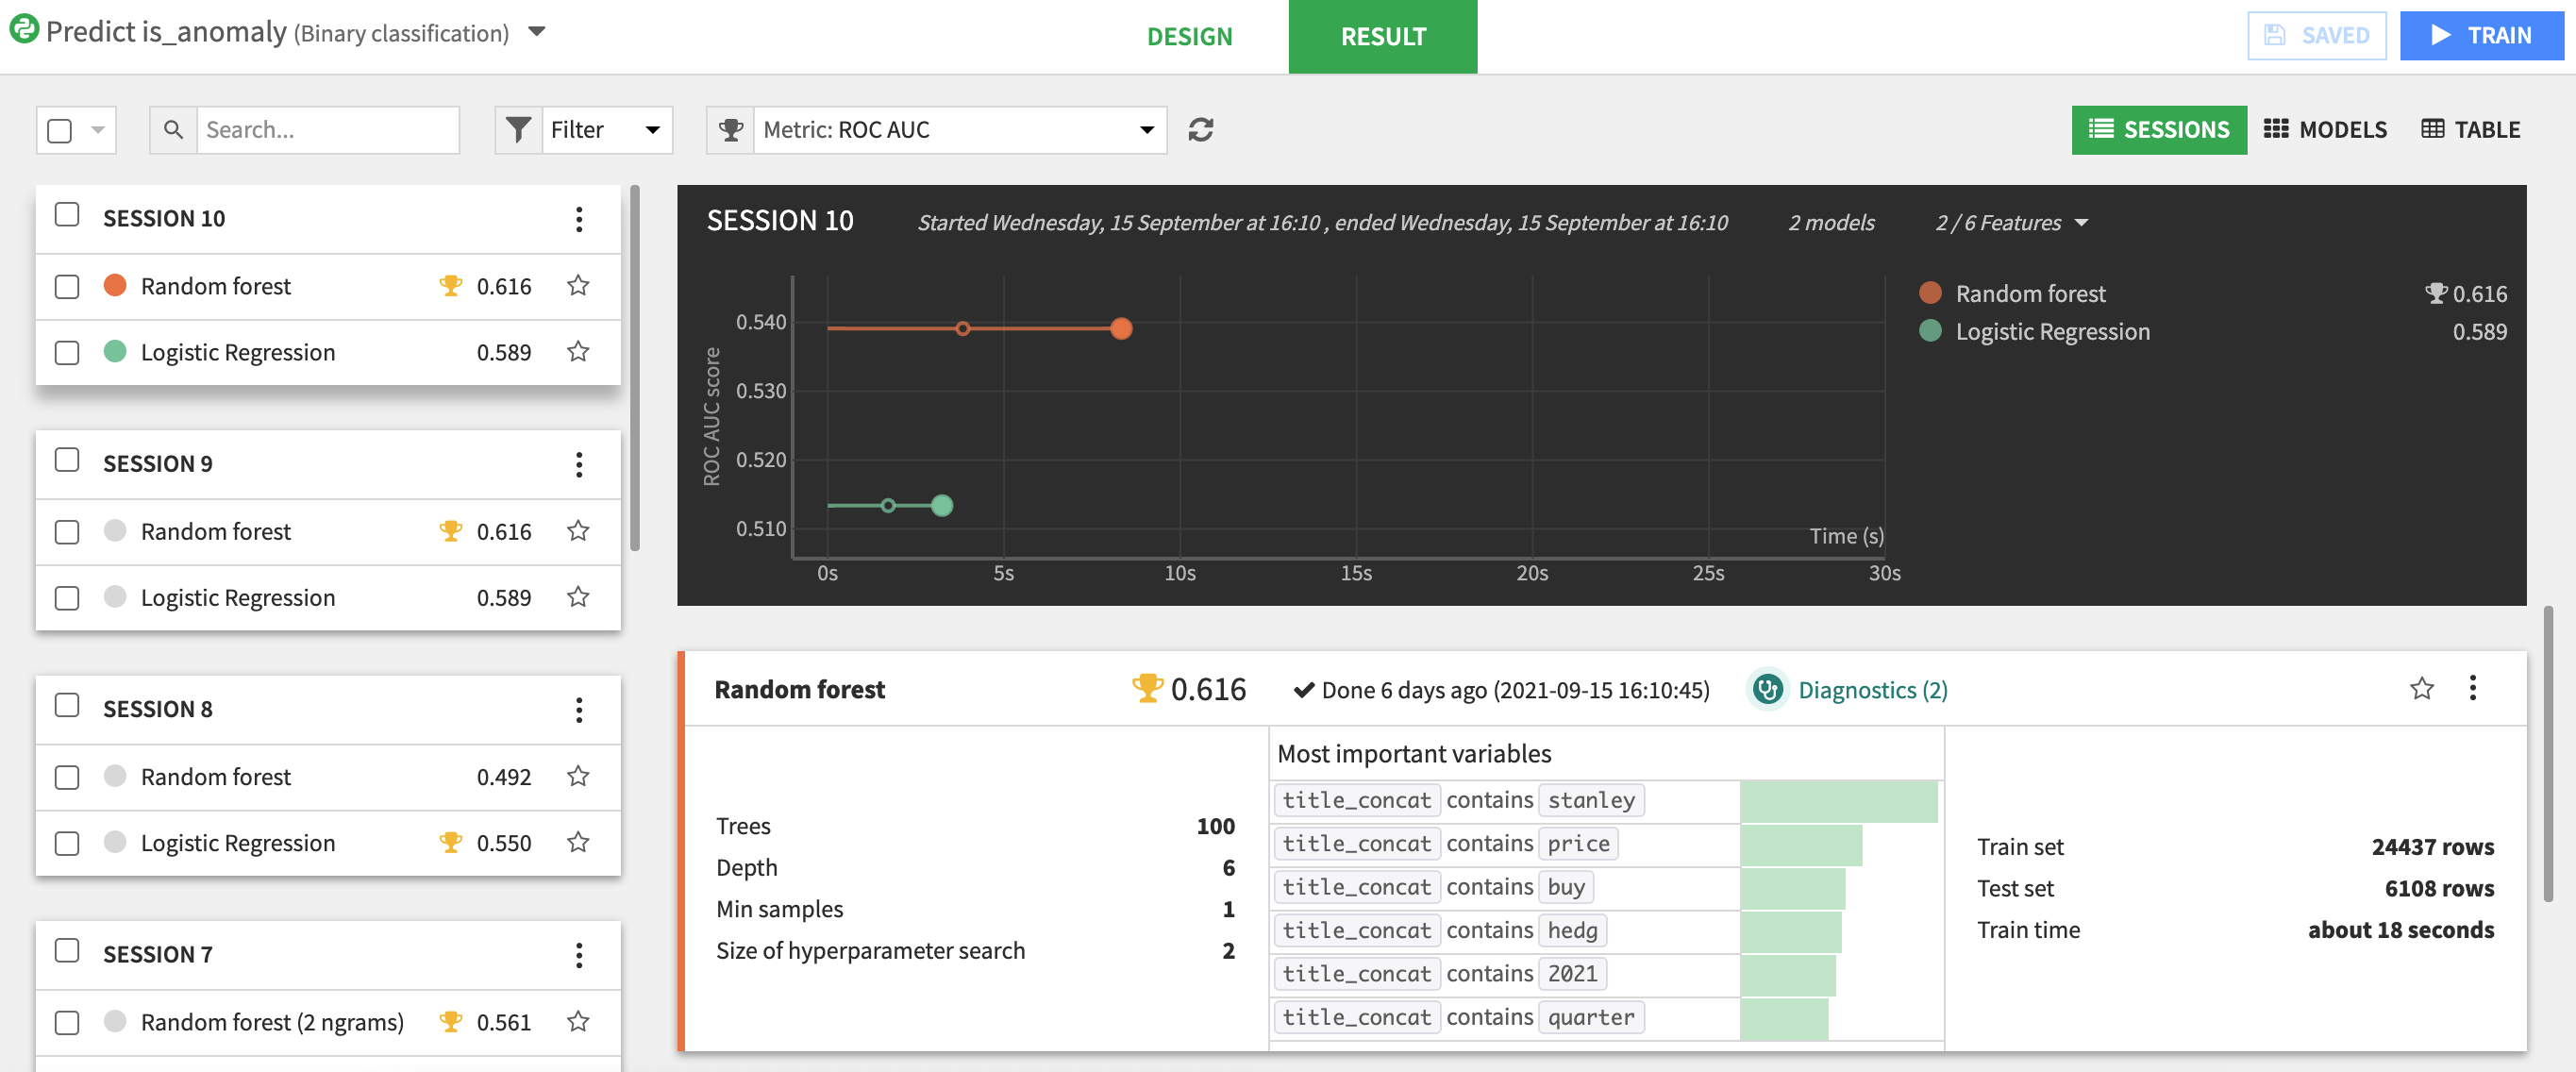
Train predictive models and score real-time data
The processed news data and cleaned stock pricing data are joined and further cleaned in the Cross Data Analysis zone. The combined dataset is then used to train a logistic regression model to detect anomalies. The final model is used to score real time data within the Real Time Alert flow zone to produce a risk score for each stock today. Additionally, individuals news events are ranked with regards to the impact they have on related stocks movement. Past data is also scored within the Visualization zone in order to enable users to investigate past news events with large impacts on stock movements within the webapp interface.
Two scenarios have been created in order to automate the flow and keep it up to date with real-time data.The Overnight Batch scenario adds the previous day’s data and updates the models. Real Time Risk Scoring retrieves the most recent news, processes and scores them to feed real-time investigation of stocks from the WebApp.Additional configurations can be made to these scenarios to send reports.
Investigate the impact of news on stock prices
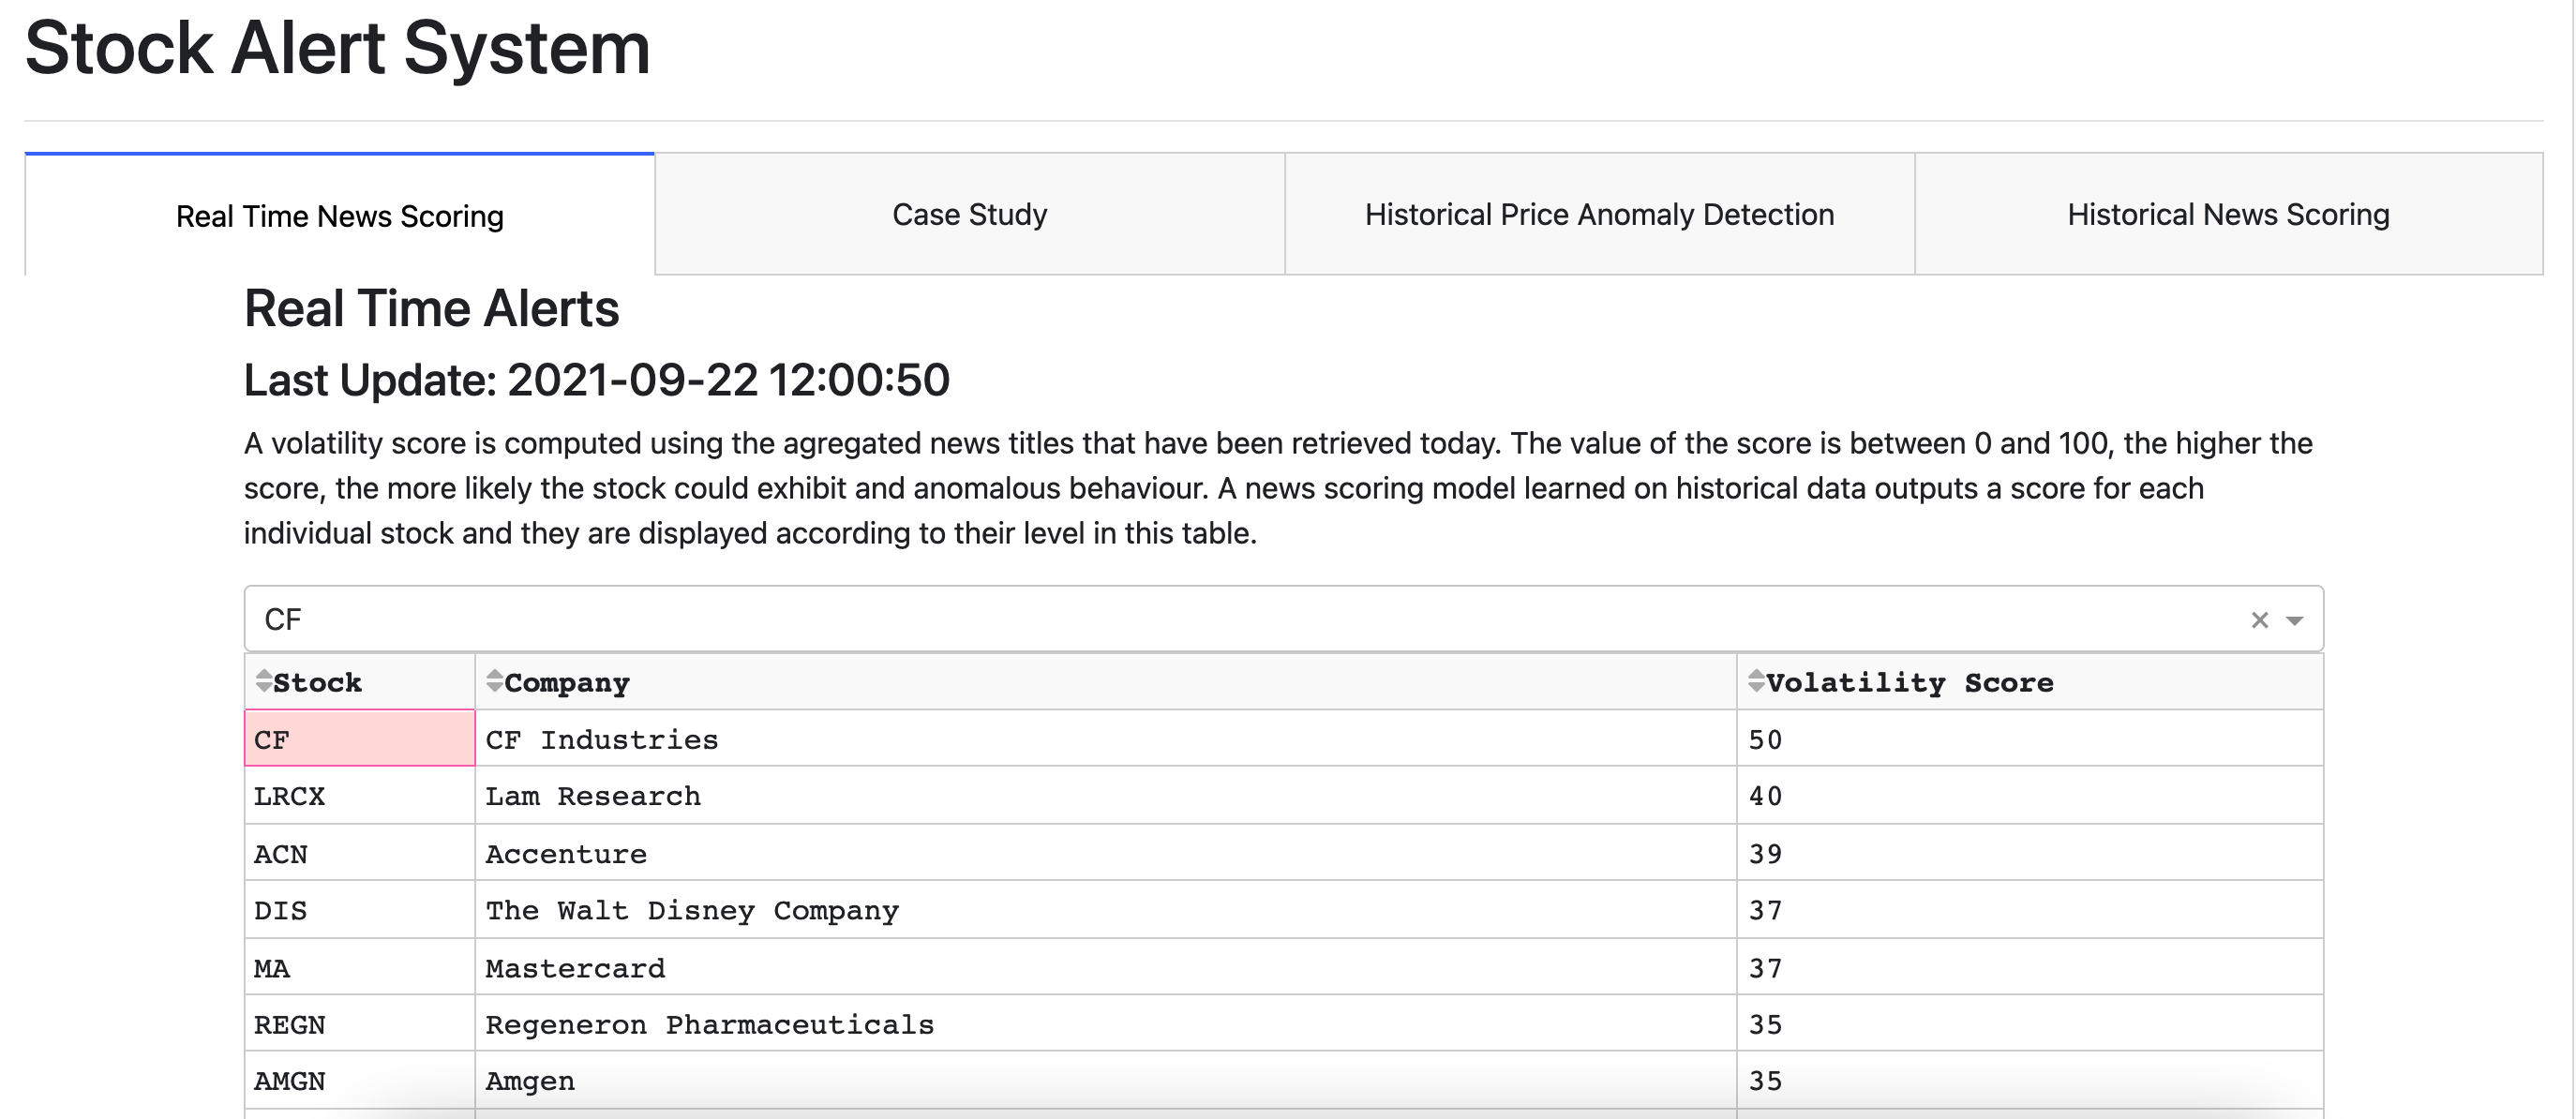
The solution contains both a WebApp and Dashboard to consume the results of the analysis. The WebApp made up of 4 tabs:
Real Time News Scoring gives, in real time, the volatility score per stock and allows users to browse through news of the day. Each row of the first table of stocks is selectable in order to filter a second table of news articles that impact a particular stock. The whole view is reset at midnight UTC but will re-populate throughout the day.
The Case Study tab makes it possible to navigate through past anomalies detected by the algorithm and visualize the price evolution and the news around the anomaly. Once again, the first table consists of selectable rows that will update a graph of the price of the stock around an anomalous event and a table showing news leading up to and following the event.
Historical Prices Anomaly Detection presents a visualization of the historical prices of a given stock with an adjustable time frame.
Historical New Scoring enables users to browse through the full news dataset that has been processed in the project for each stock.
The Dashboard also contains four tabs to allow users to visualize the real time view of the scores by stock, a report on the New Scoring Model, insights into the anomalies detected, and visual cluster analysis.