Production Quality Control
Overview
Business Case
Providing products with consistent quality is at the forefront of any industrial company’s priorities. And it’s no surprise: consequences when facing a drop in quality are multiple and can sustainability damage customer trust and company brand. In more practical terms, quality incidents lead to an increase in costs, add pressure on supply chain management, increase waste generation, and can even trigger fatalities and serious injuries for customers. The goal of this adapt and apply solution is to show Factory Management and Operations teams how Dataiku can be used to improve the quality of your production and adjust your manufacturing processes in near real-time.
Technical Requirements
To leverage this solution, you must meet the following requirements:
Have access to a DSS 9.0+ instance.
Please also note that Dataiku instances with a builtin environment of Python2, instead of Python 3, will receive errors when opening the “Explanations” tab of the Defects prediction Dashboard and will be unable to use the webapp. For instances with a builtin environment of Python2, users should create a basic Python3 code env and set the project to use this code env.
The version of the Solution that’s available for download is built using filesystem-managed datasets. It’s possible to integrate Streaming with this project for real-time monitoring.
Installation
If the technical requirements are met, this solution can be installed in one of two ways:
On your Dataiku instance click + New Project > Industry solutions > Manufacturing and Energy > Production Quality Control.
Download the .zip project file and upload it directly to your Dataiku instance as a new project.
Note
If running a DSS 9 instance, the solution is found by navigating to + New Project > Sample Projects > Solutions > Production Quality Control.
Data Requirements
The data contained in this project represents the overmolding process where silicone is injected onto a toothbrush handle, resulting in a seamless combination of plastic and rubber. The injection process depends on the right control of injection pressure, temperature, and curing time to avoid defects.
The solution takes in 2 input data sources:
The process-data dataset contains measurements from the machines and is composed of 8 columns:
DateTime : Date of the measurement event
Press : The Machine’s number
Recipe : The Recipe number being used
CampaignID : A unique identifier for the campaign
InjectionID : A unique identifier for the injection (equating to the production of 4 toothbrushes in this use case)
InjectionTime : Time measurement from the machine as an average of the 4 toothbrushes
Pressure : Pressure measurement from the machine as an average of the 4 toothbrushes
Temperature : Temperature measurement from the machine as an average of the 4 toothbrushes
The quality-data dataset contains a simplified view of the quality results, composed of 2 columns:
InjectionID : A unique identifier for the injection (equating to the production of 4 toothbrushes in this use case)
Defect: A boolean that indicates if the injection has defects or not
Note
This project is meant to be used as a template to guide the development of your own analysis in DSS. The results of the model should not be used as actionable insights and some of the data provided with the project may not be representative of actual data in a real-life project.
Workflow Overview
You can follow along with the solution in the Dataiku gallery.
The project has the following high-level steps:
Ingest and Prepare our Data
Train and Score a Defect Prediction Model
Detect and Raise Alerts for Drifts in Injection time
Predict Defects based on data from the last 24h
Evaluate our model, identify injection drifts, and analyze our Production Quality with pre-built Dashboards.
Automate the Solution for continuous, real-time analysis
Walkthrough
Note
In-depth technical details can be found in the wiki of the project.
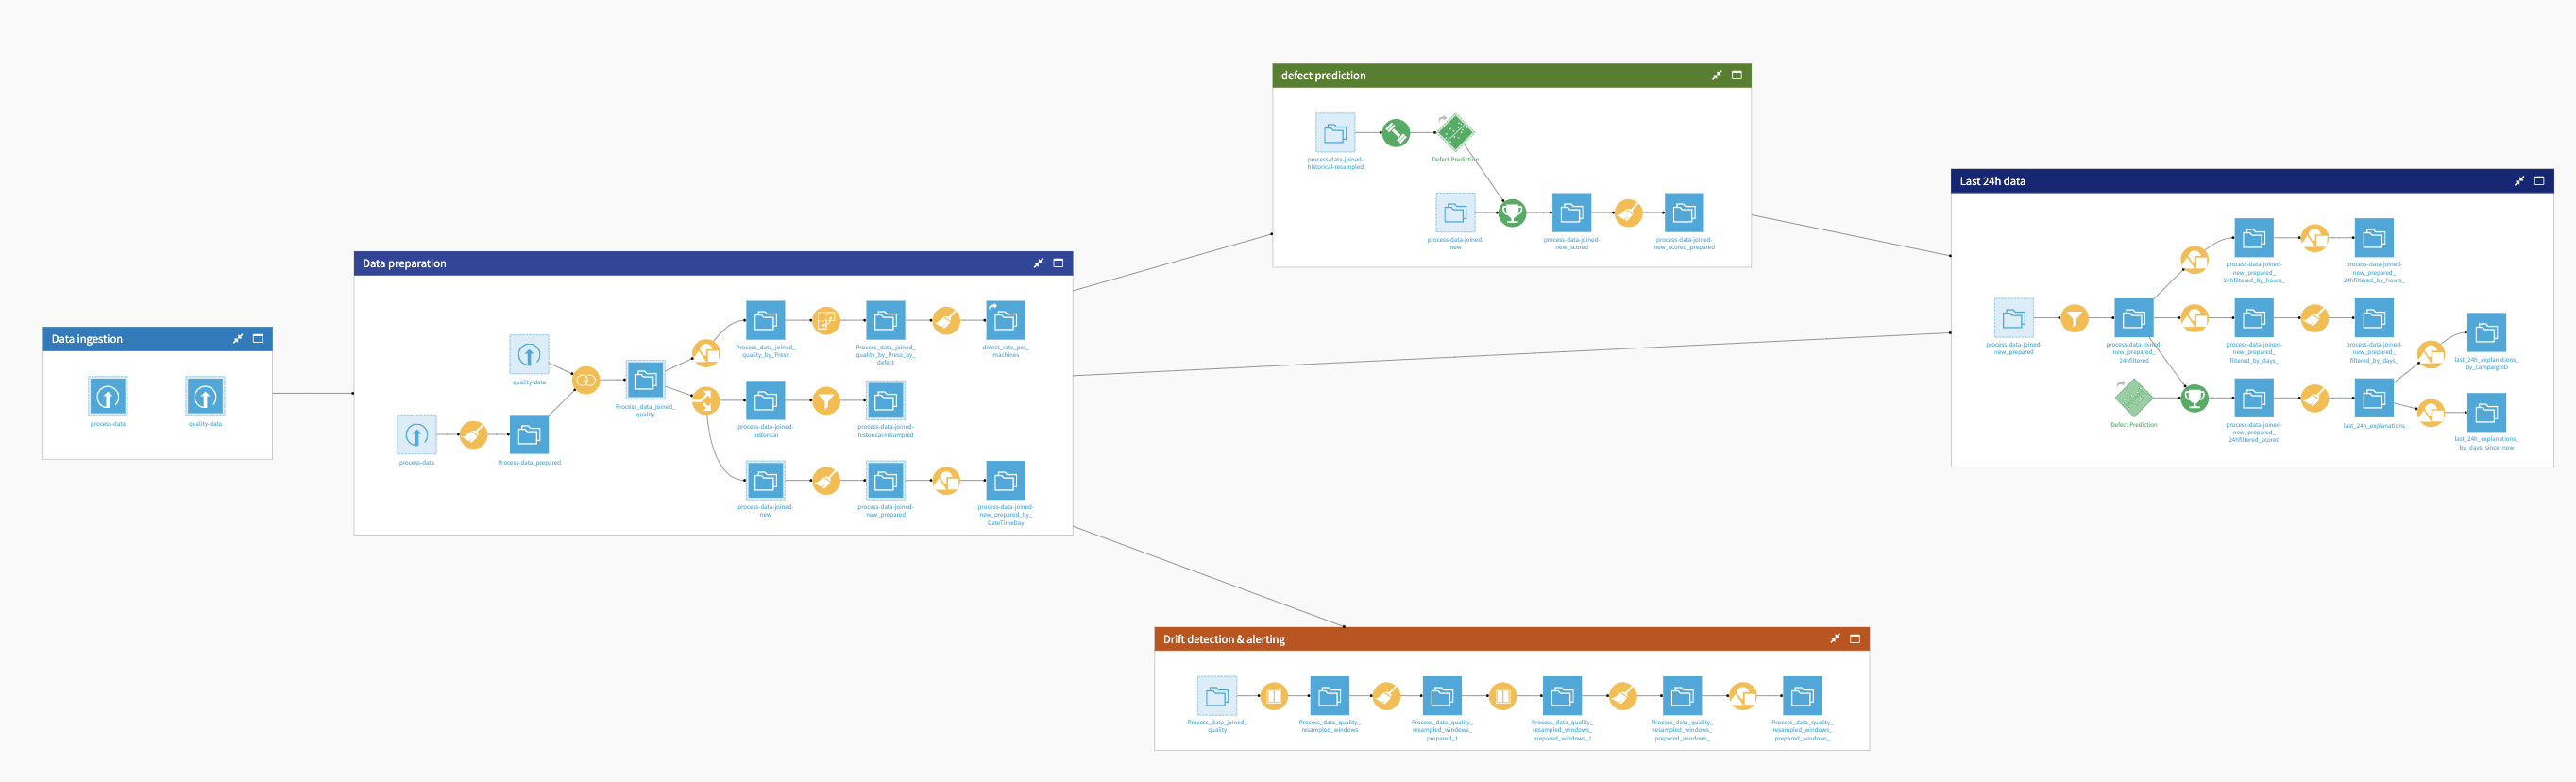
Ingest and Preparing our Data
The first two flow zones of our project are fairly straightforward. We begin in the Data Ingestion flow zone by bringing in 2 initial datasets that are detailed in the previous Data Requirements section.
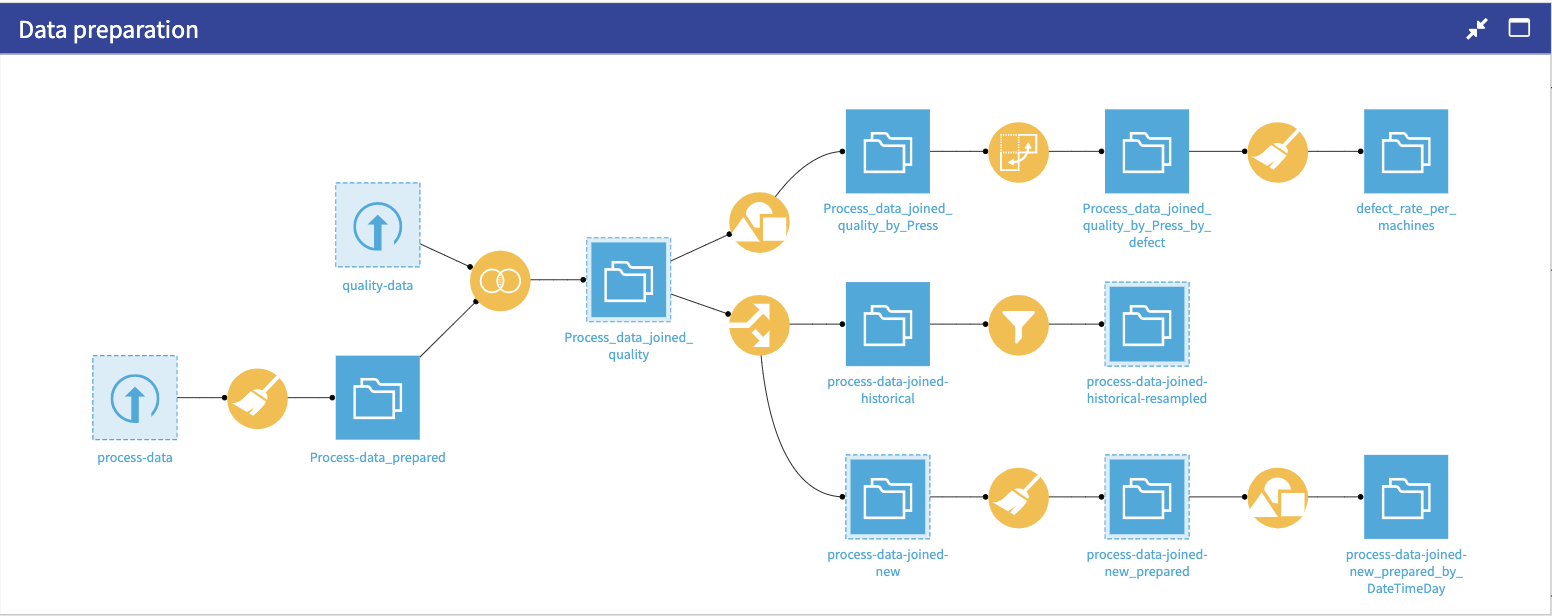
Now that we have access to all of our input datasets, we can move along to the Data preparation flow zone. We first round values in the Process-data dataset before joining it with quality-data on the InjectionID. This dataset is the source for several charts available in the Dashboard. Three branches for data preparation result from this dataset:
Computation of the overall defect rate per machine (top branch) used by the Webapp to display the defect rate per machine
Resampling of the historical data (middle branch) used to train the models
Computation of the defects and number of injections per day (bottom branch) used by the Webapp to display the daily production rate for the past 7 days
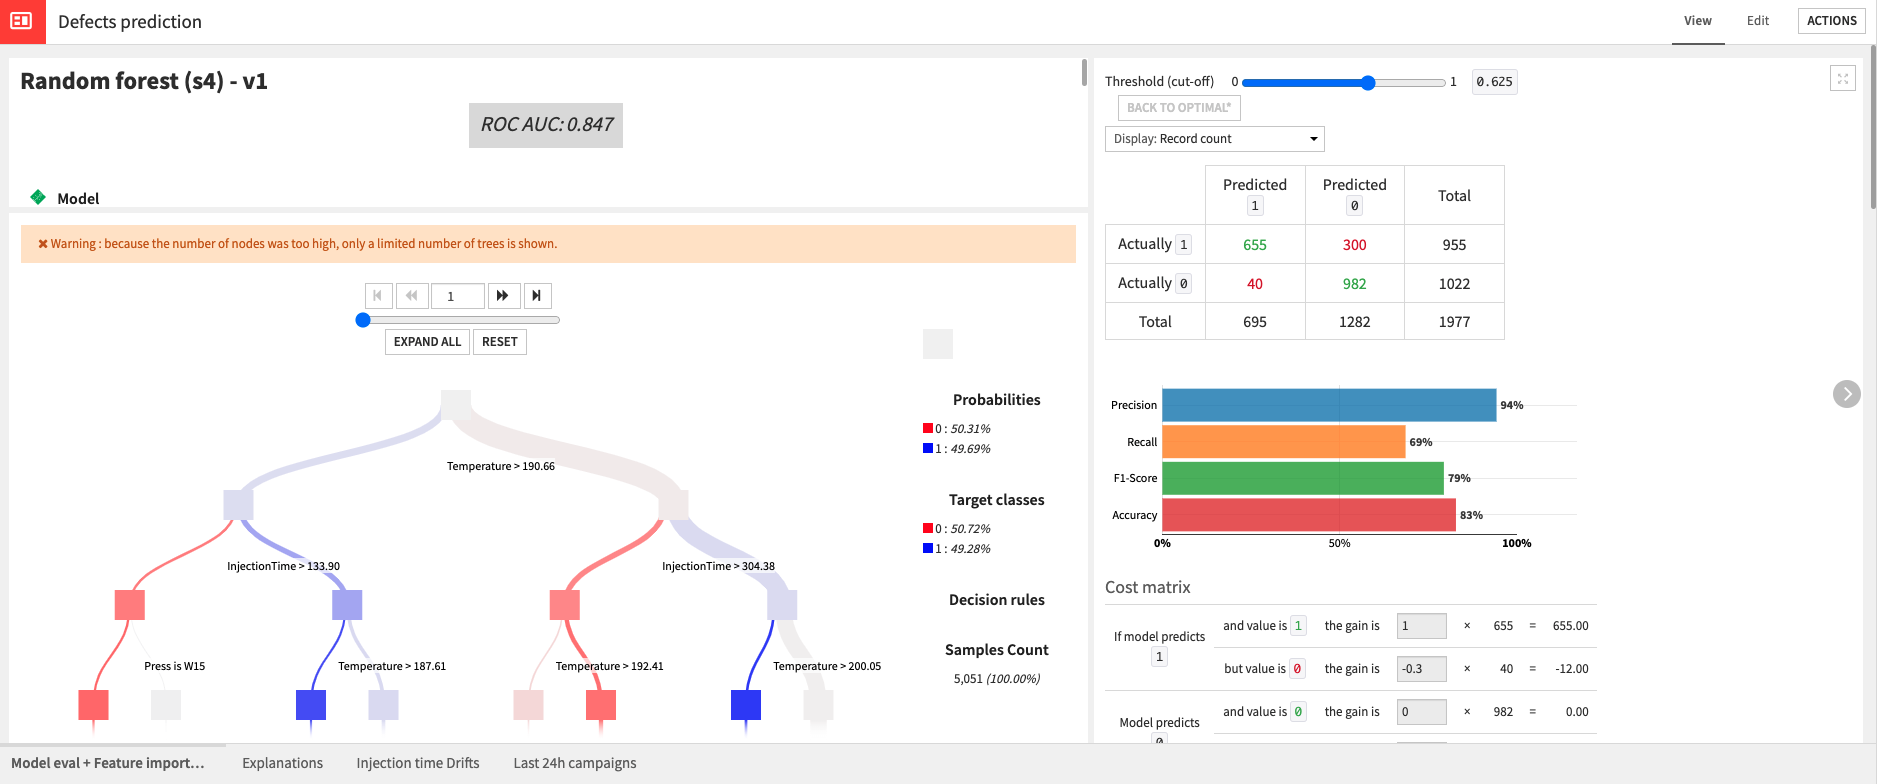
Proactive Quality Control: Training a Defect Prediction Model
Having previously created the process-data-joined-historical-resampled dataset we are ready to train and score a model for predicting defects made by our machines in the Defect prediction flow zone. The dataset used to train our model represents data that was downsampled to have more accurate results at a ratio of 50/50 which is quite aggressive but will cause more false positives rather than false negatives. When training the model we also used the cost matrix available in the VisualML recipe to optimize. Ultimately we chose to deploy a Random Forest model which, despite taking 5x longer to train than the XGBoost model, still performed better.
We can test out our model by using it to score the process-data-joined-new dataset which represents all of our new data which was split out in the previous Flow Zone.
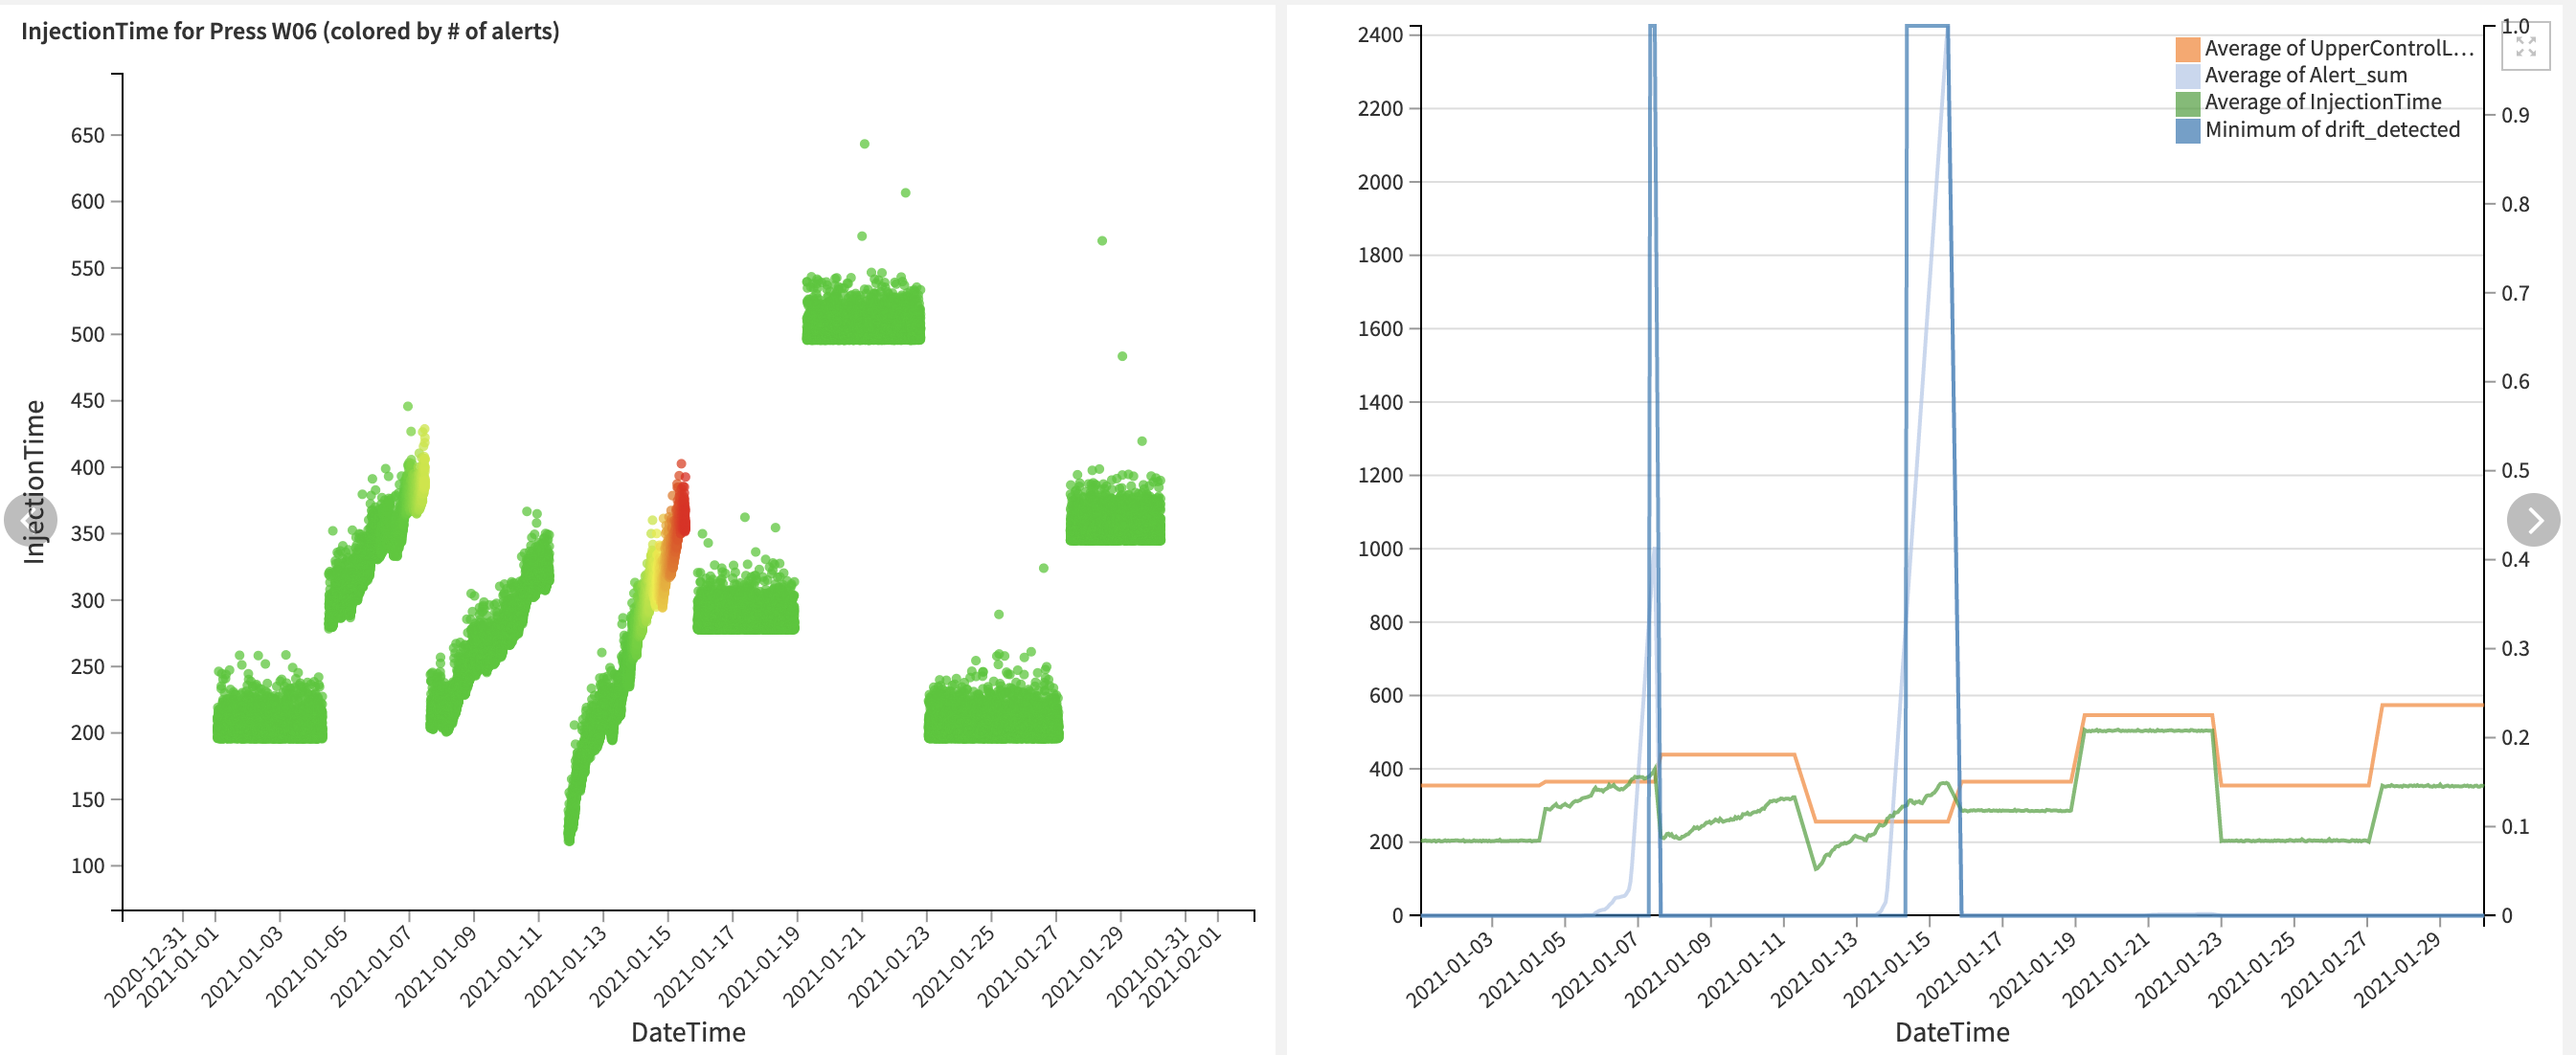
Detecting Drifts in Our Data
In addition to predicting Defects with our trained model, we can also detect drifts in the injection time as a way to monitor our Product Quality. We begin the Drift detection & alerting flow zone by using a window recipe to compute the average and standard deviation of the injection time per recipe. Then we compute the Upper Control Limit as a distance from the average. Finally, we set an Alert variable as true if the injection Time exceeds our set limit. This, however, resulted in A LOT of alerts being raised so we further refined our monitoring by setting a threshold of Alerts (currently set to 800) that our injection Times needs to pass before we consider a Drift to be occurring. The generated Alerts can be used in a Scenario defined below to send notifications to a maintenance team. The limits used can be played with and tuned to achieve optimal results on your own data.
Focusing on Relevant Updates
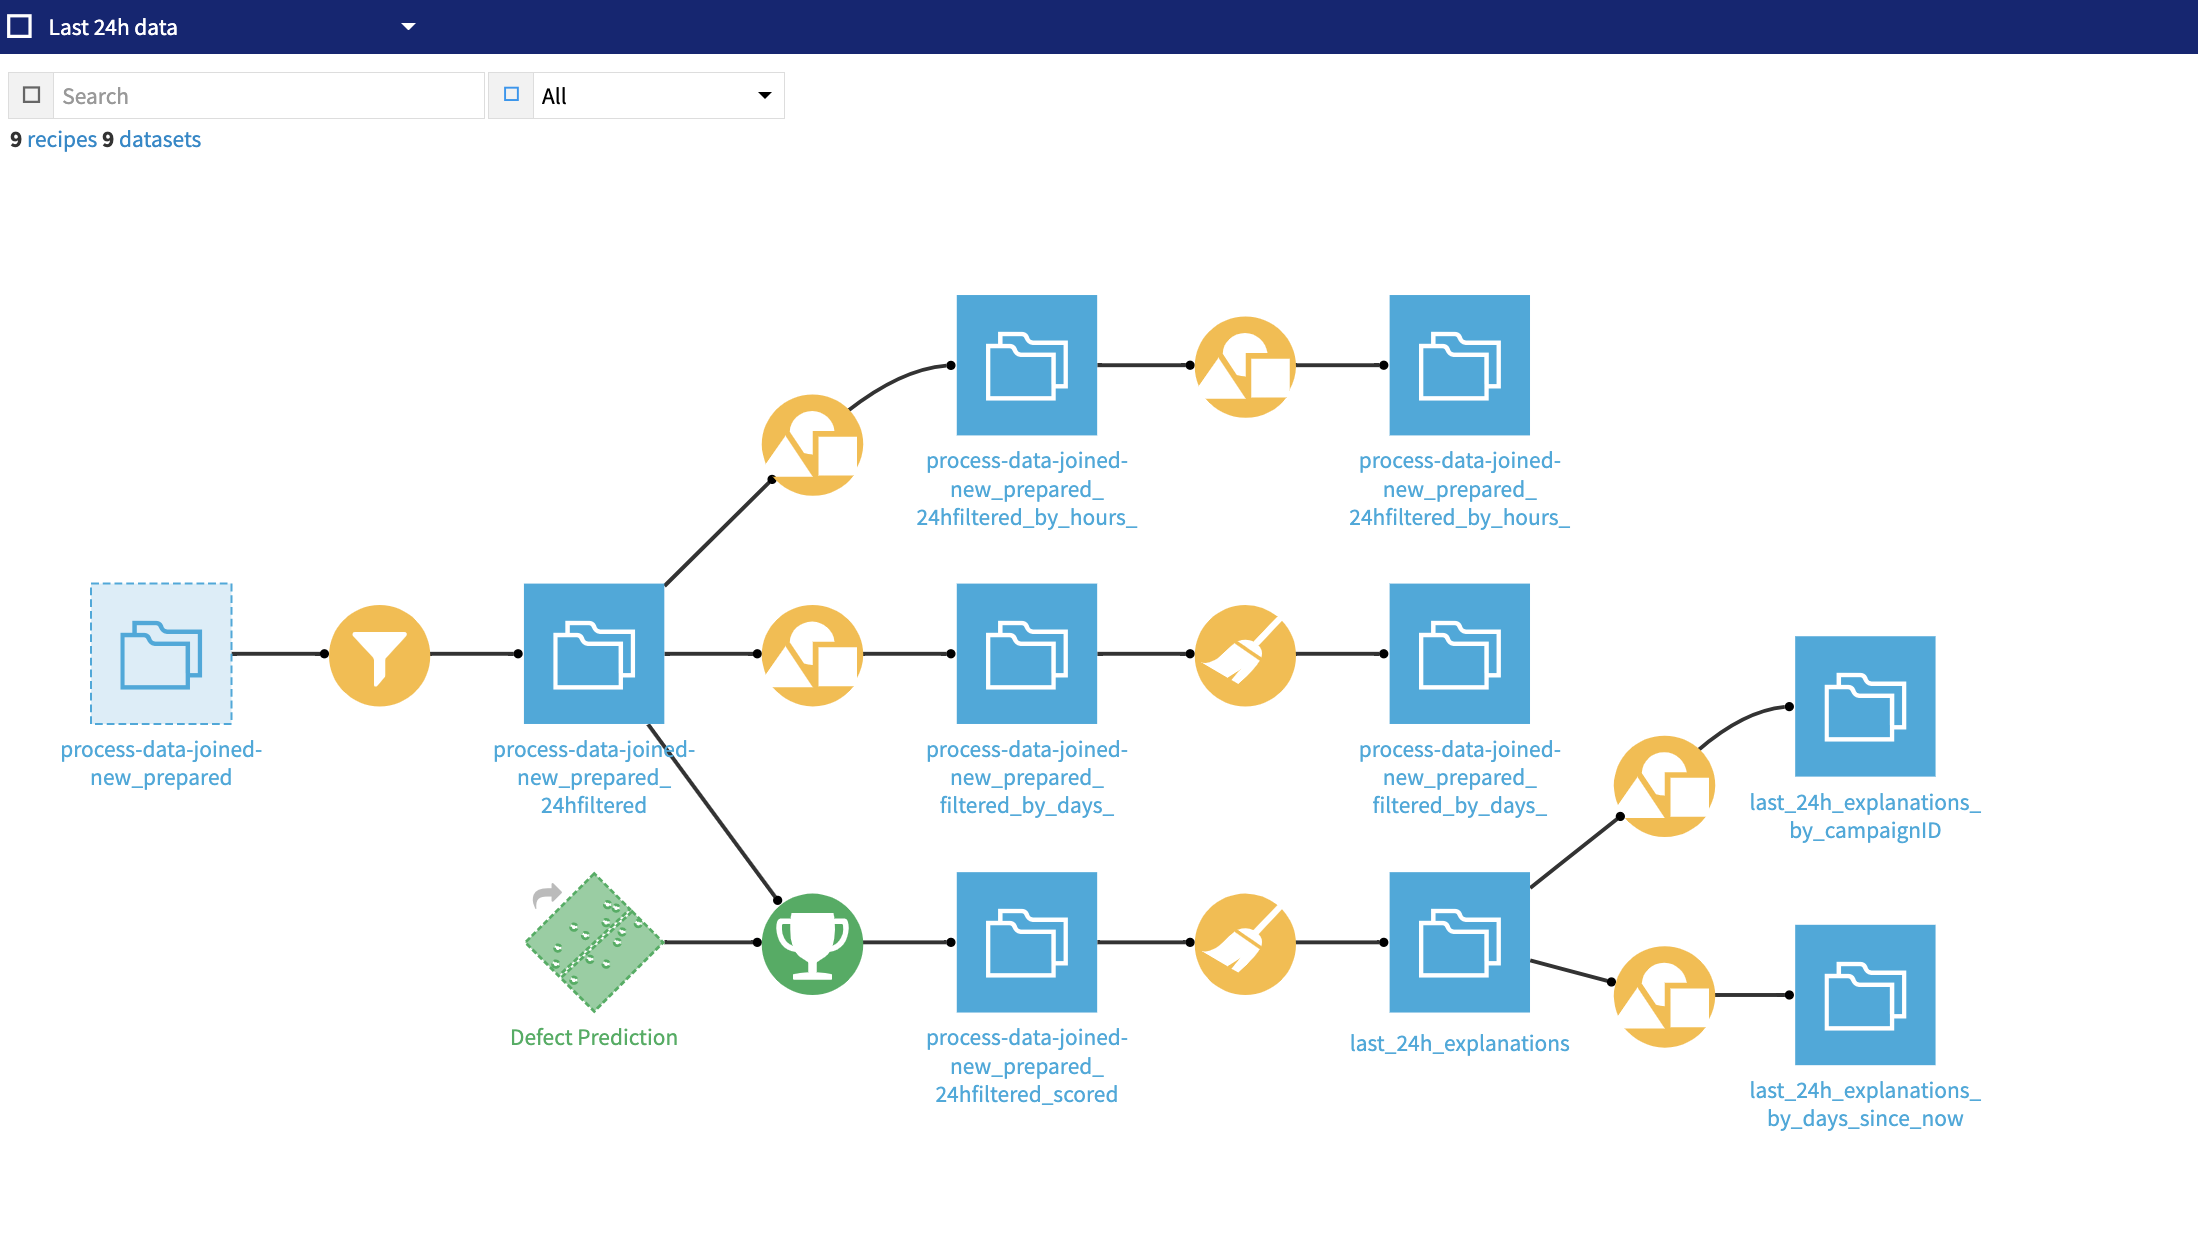
When putting a Solution like this into production, it’s handy to have a flow zone like Last 24h data to perform faster data updates and scoring. We take, as an input to the flow zone, process-data-joined-new_prepared and filter to focus on data from the last 24 hours. From this filtered dataset we create 3 branches each with its own goal:
Compute the average Injection Time, Pressure, and Temperature for the last 24 hours
Compute the defect rate per machine for the last 24 hours
Score data from the last 24 hours using the previously trained and deployed model.
All of the resulting metrics from these branches are available in the Webapp for monitoring.
Visual Monitoring and Data Exploration
This Solution comes with 2 pre-built Dashboards to assist you in monitoring and controlling your Production Quality. The first Dashboard, Defects Prediction uses Dataiku’s native charts to give a more detailed understanding of our Production Data and the Model used to predict defects. This Dashboard is composed of 4 tabs:
Model eval + Feature importance: provides some explainability values about the trained model
Explanations: includes an interactive scoring visualization for our model
Injection time drifts: shows the drift of injection time and examples of how charts specific to the performance and alerting of individual machines can be created
Last 24h campaigns: shows the last 24 hours’ campaigns distributions and if any drifts have been detected.
Note
If your Dataiku instance’s builtin Python environment is Python2, instead of Python3, there will be errors when trying to use the Explanations tab of the Dashboard. These errors can be fixed by retraining the model and deploying the newly trained model. There are no other impacts on the performance of the Solution.
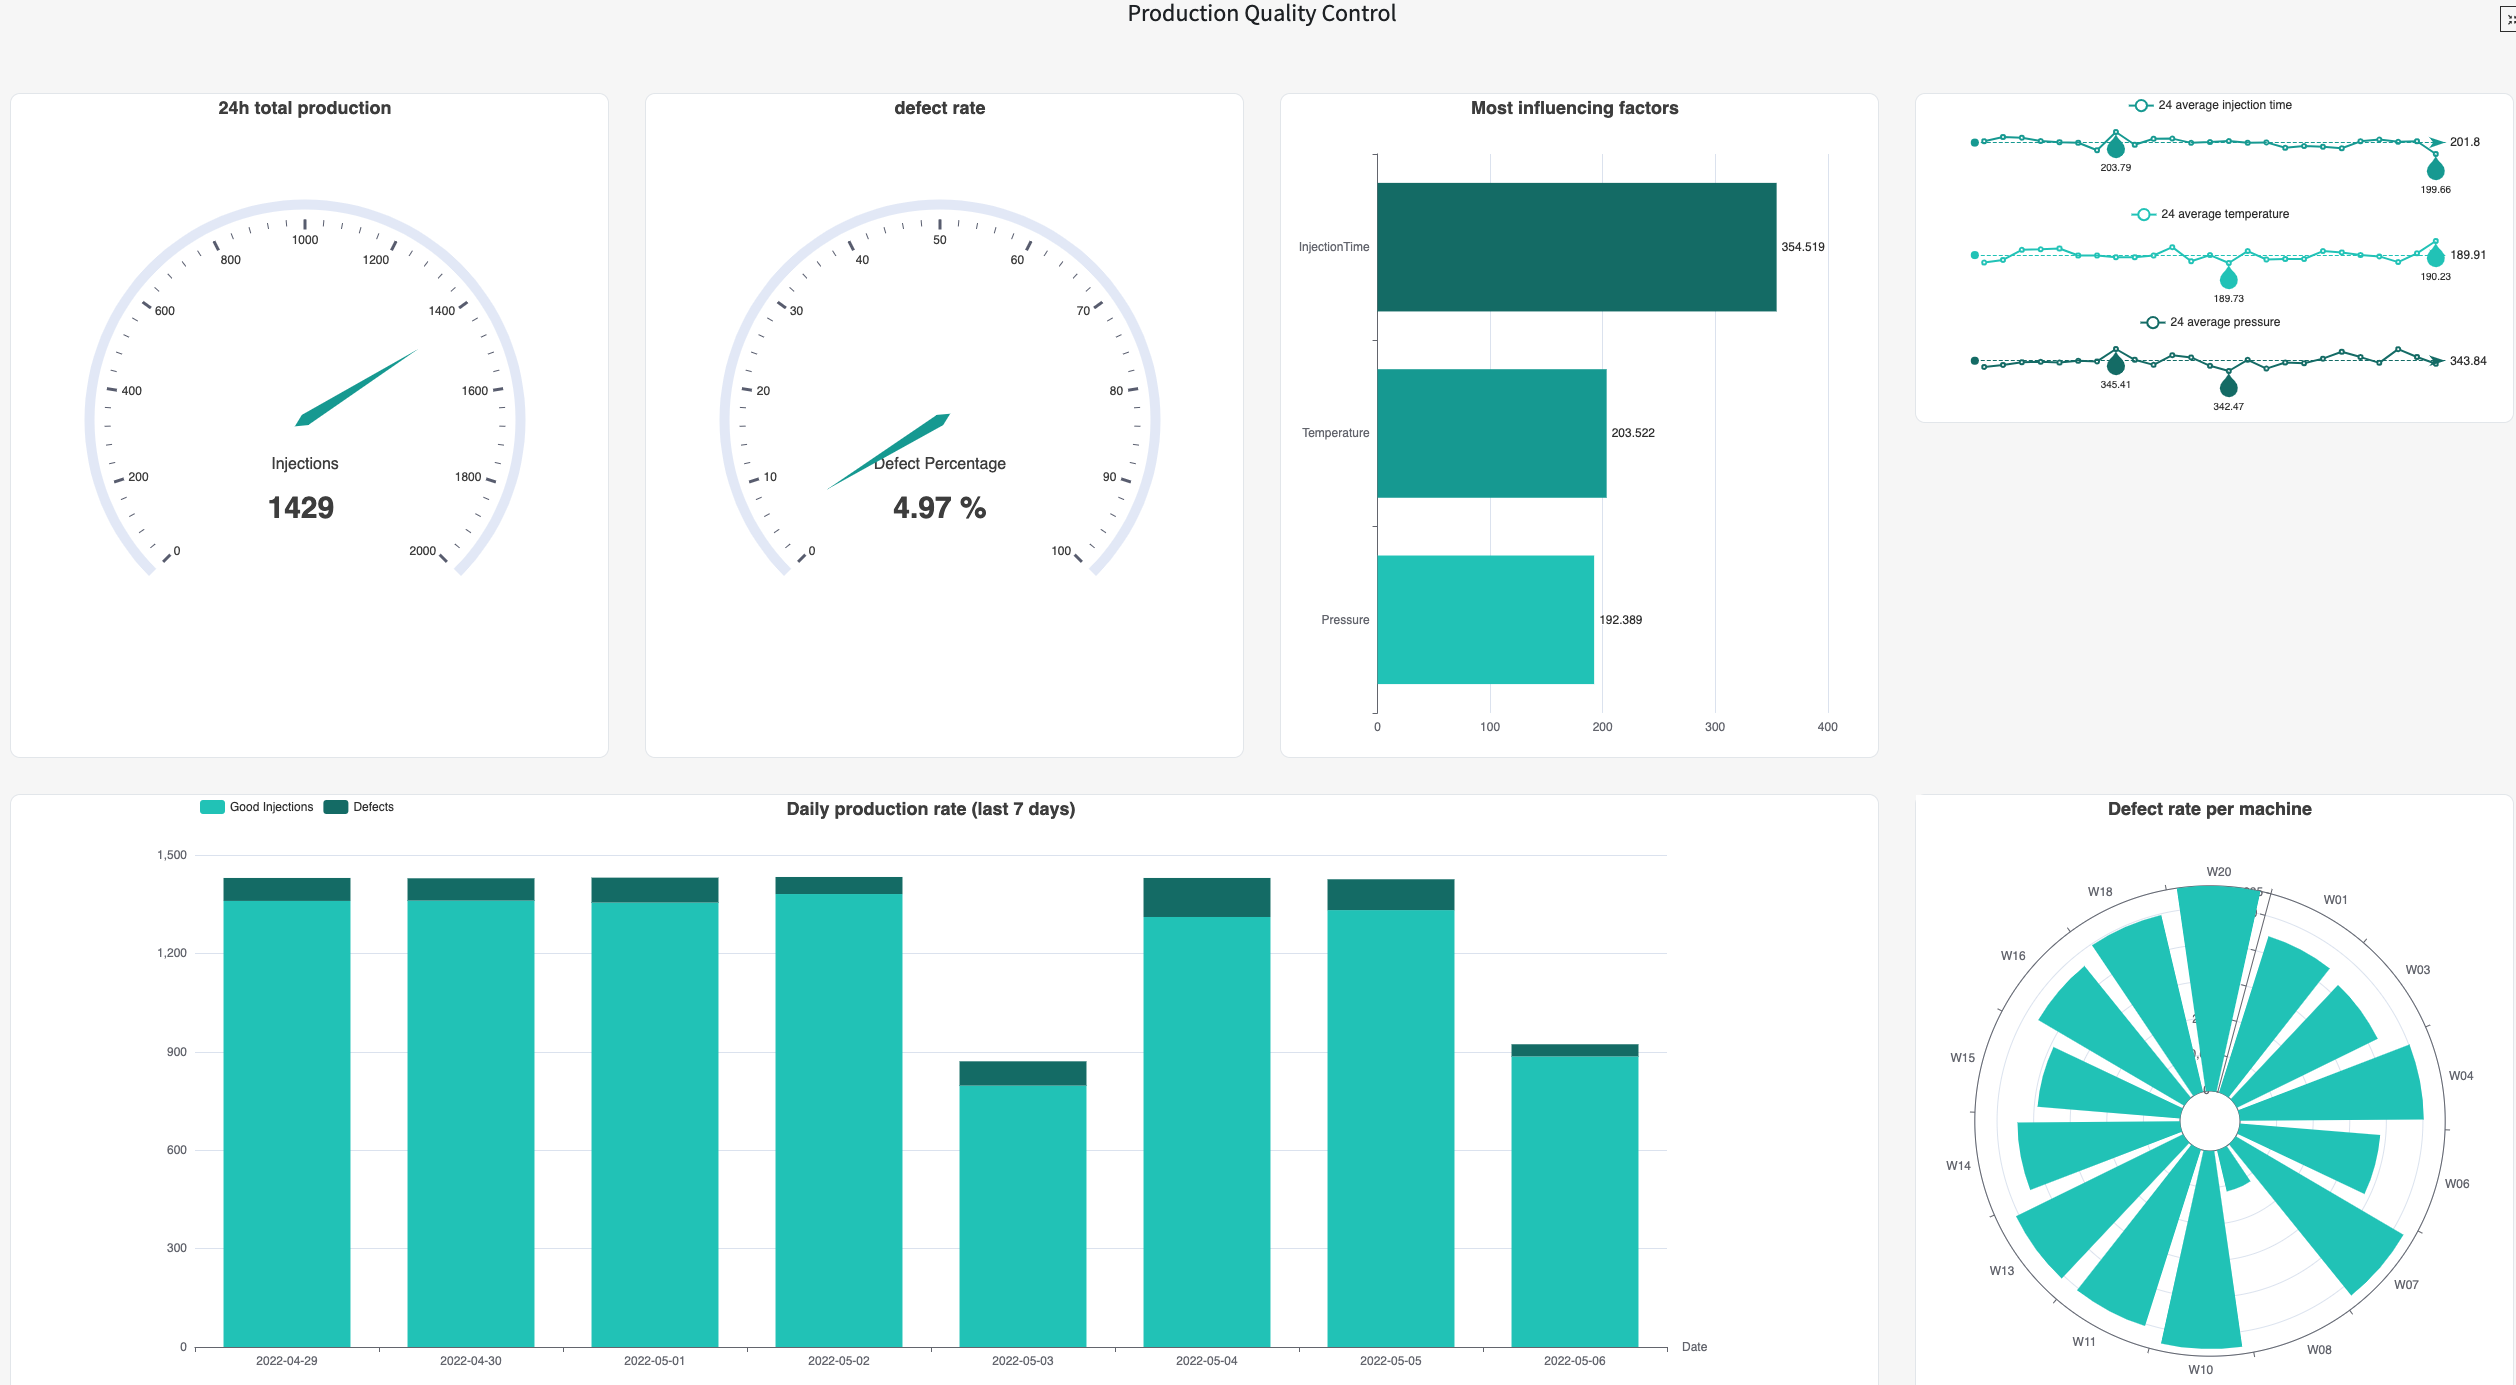
The second Dashboard Production Quality Dashboard contains the Webapp which has been specifically designed with easy-to-understand visualizations that are customizable. Out-of-the-box it displays common KPIs about total production and defect rates, as well as information on the top 3 most influential factors for defects.
Making this Solution Reactive to Real-Time Data
For a Solution like this to be useable for real-world production quality control, we need to think about Automated Alerting and Streaming. The former has been mentioned several times already and the flow has been configured to support Alert generation based on drifts in Injection Time. This Solution comes with a Scenario that will be triggered to run every 900s to compute if the Alerts Limits have been crossed. The scenario can be additionally configured to send alerts via email, Slack, or Microsoft Teams. Streaming is also important to make this Solution responsive to real-time data. Streaming is available as an experimental Dataiku feature but is not configured in this Solution in its current version. If you’re interested in making your Streaming data work with this Solution, please contact us.
Reproducing these Processes With Minimal Effort For Your Own Data
The intent of this project is to enable an understanding of how Dataiku can be used to improve the quality of your production and adjust your manufacturing processes in near real-time. By creating a singular solution that can benefit and influence the decisions of a variety of teams in a single organization, production efficiency can be improved and changes in production can be detected with sufficient lead time.
We’ve provided several suggestions on how to use your production data to improve production quality control but ultimately the “best” approach will depend on your specific needs and your data. If you’re interested in adapting this project to the specific goals and needs of your organization, roll-out and customization services can be offered on demand.