Hands-On: Create a Correlation matrix
Note
This lesson is a continuation of the Interactive Visual Statistics hands-on tutorial.
The Correlation matrix card allows you to examine the degree to which pairwise relationships may exist for variables in the dataset. Let’s proceed to create the card.
Click the New Card button from the “Worksheet” header, and then select Correlation matrix under “Multivariate Analysis”.
Select the 11 numerical variables to add to the “Variables” column.
Click the “Pearson” radio button to use the Pearson correlation coefficient.
Click Create Card to create the card.
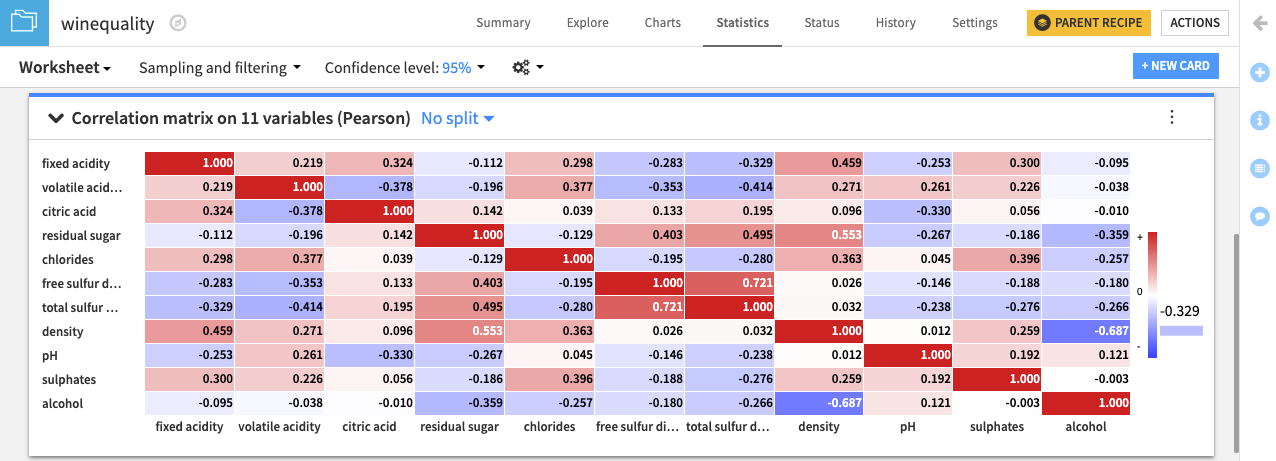
The correlation matrix card displays a heatmap with the pairwise correlation values in the matrix cells. Of all the variables in the dataset, free sulfur dioxide and total sulfur dioxide have the largest positive correlation (0.721). This confirms the observation that we made from finding the fit curve.
Also, notice that the variables density and alcohol have the largest negative correlation (-0.687) in the dataset. This negative correlation implies that wines having higher density values tend to have lower alcohol content.
For more information about the correlation matrix card, see Correlation Matrix in the reference documentation.