Hands-On: Perform Two-sample Location Tests
Note
This lesson is a continuation of the Interactive Visual Statistics hands-on tutorial.
These tests allow you to compare the location parameters of two populations.
Let’s determine whether the medians of two populations for the density variable are equal. To do this, we will use the two-sample Median Mood Test card.
Click the New Card button from the “Worksheet” header, and then select Statistical tests. Under Two-sample test, click Median Mood Test.
Select density as the “Test Variable”
Select type as the “Grouping Variable”. This prompts you to specify values of type to create the two populations.
Add
redfor Population 1 andwhitefor Population 2 to create two disjoint groups.
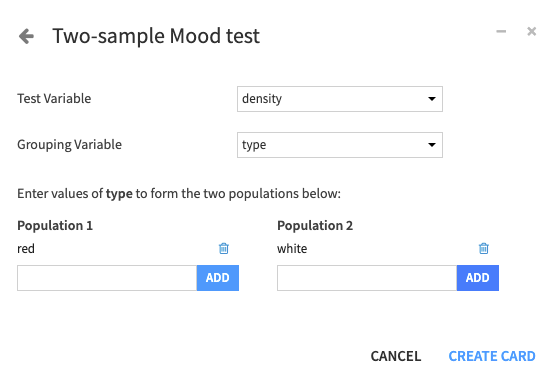
Click Create Card to create the card.
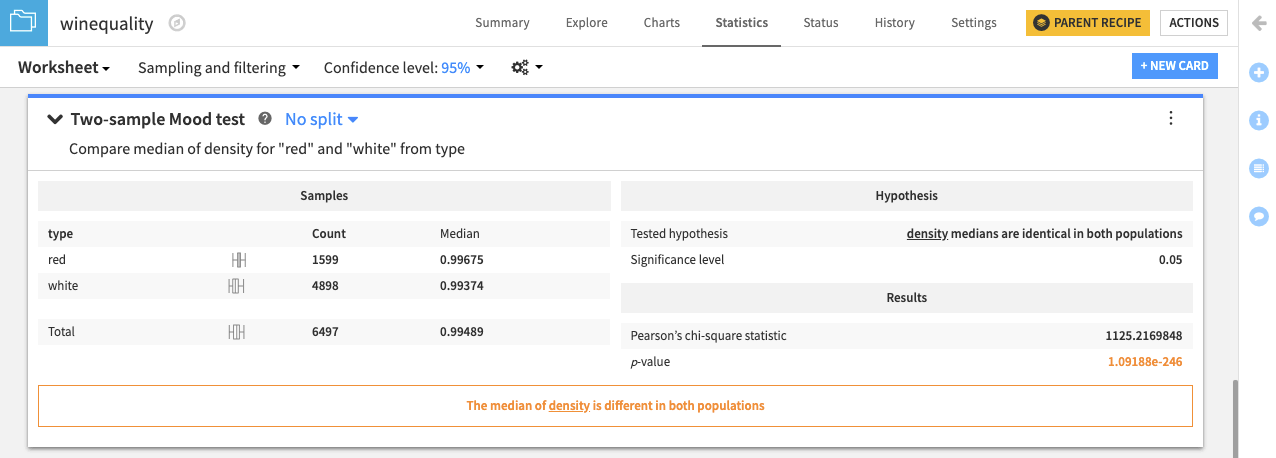
The card displays a summary of samples from the red and white wine populations, the tested hypothesis, results of the test, and a conclusion about the test — in this case, “The median of density is different in both populations”. For more information about the two-sample median mood test, see Median mood test (two-sample) in the reference documentation.
Similarly, you can test whether the means of two populations are equal for the density variable using the Student t-test (two-sample).