Hands-On: Tune the Model
Thus far you have built a basic model to classify high revenue customers and looked at a few ways to evaluate its performance. Because modeling is an iterative process, let’s now turn attention to improving the model’s results and speeding up the evaluation process.
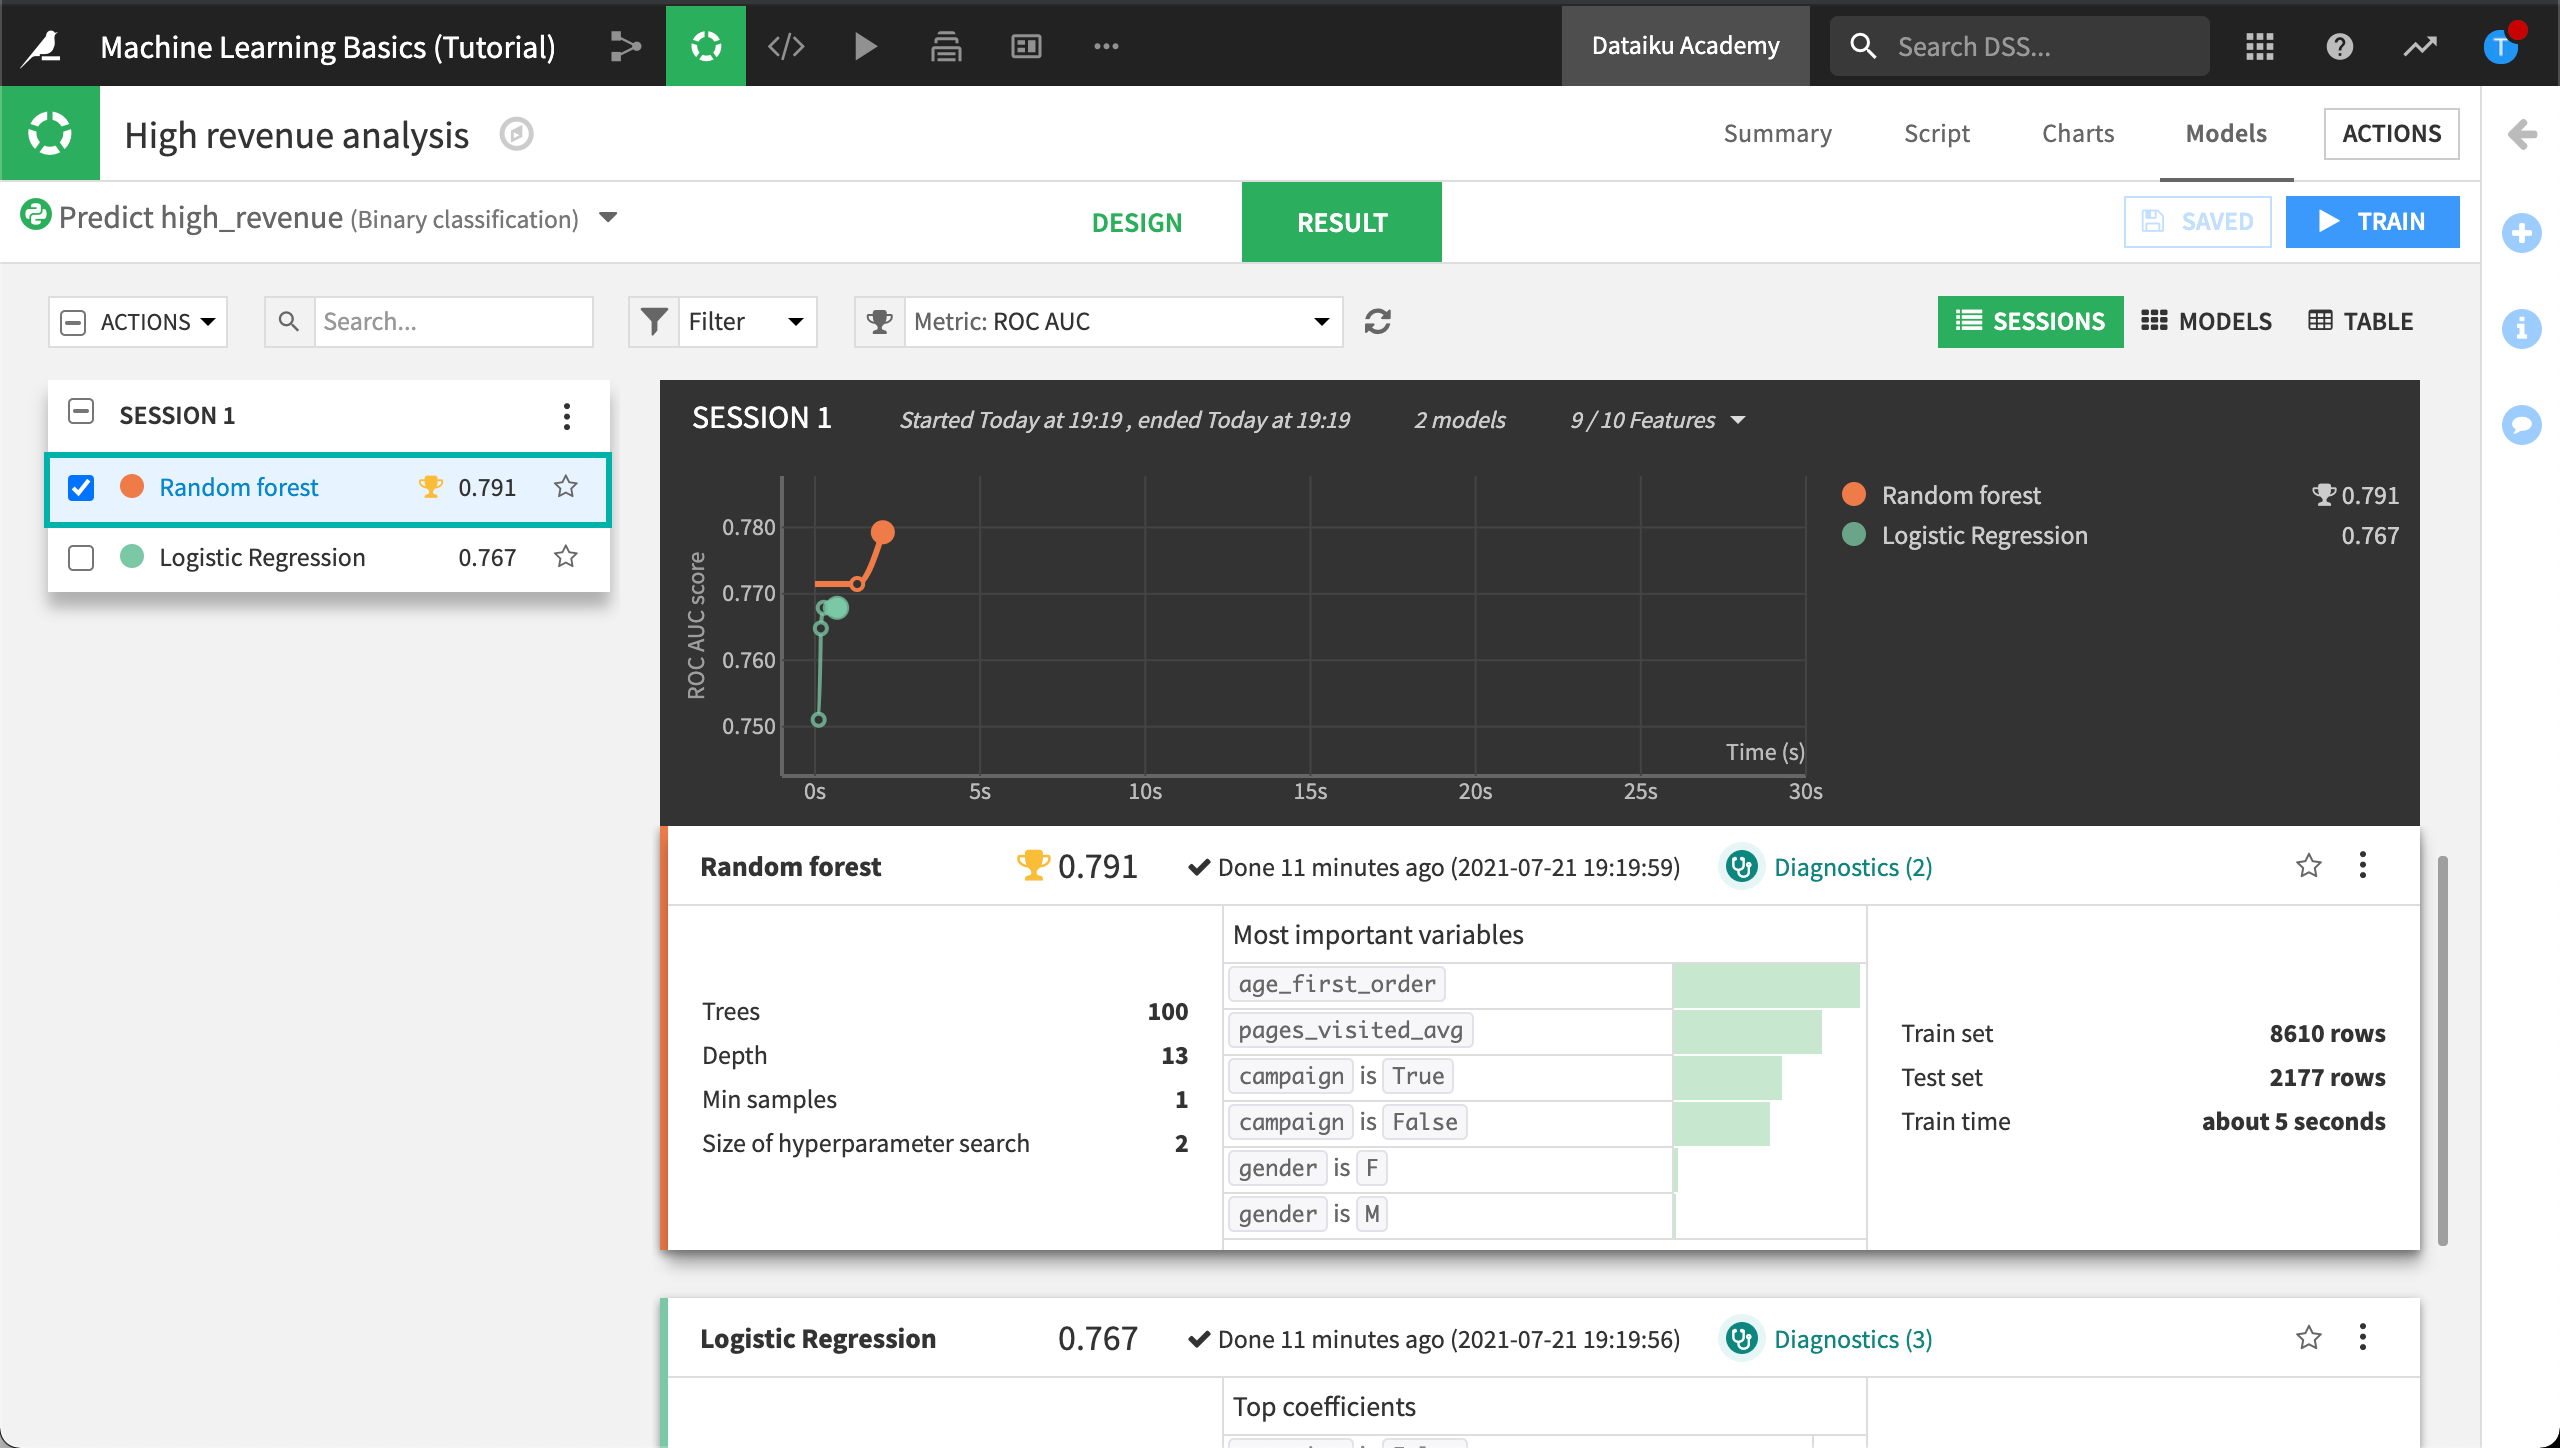
In the Machine Learning Basics (Tutorial) project, return to the Models tab of the High revenue analysis.
By default, you’ll be in the tab showing the Results of your training session. On the Results tab, we can get a sneak preview of the results of the visual ML diagnostics.
Let’s rebalance the train and test datasets, configure ML assertions to help us evaluate the model as we iterate on its design, and configure features handling. We’ll also generate new features. Then, we’ll retrain the model to see if its performance has improved and whether or not our ML assertion checks passed.
To do this, we’ll use the Design tab. The Design tab is where you can change how the models are built.
Configure the Train / Test Set
Notice that the ML model will use a sample of the first 100,000 records split randomly so that 80% of the sample goes into the train set and the rest goes to the test set. Since we have a class-imbalance problem, the default sampling & splitting strategy isn’t optimal. Let’s try to improve it.
One way to try to improve the class imbalance is to apply a class rebalance sampling method.
To configure the Train / Test Set:
Navigate to the Design tab.
In the Basic section, click Train / Test Set.
Set the Sampling method to Class rebalance (approx. nb. records).
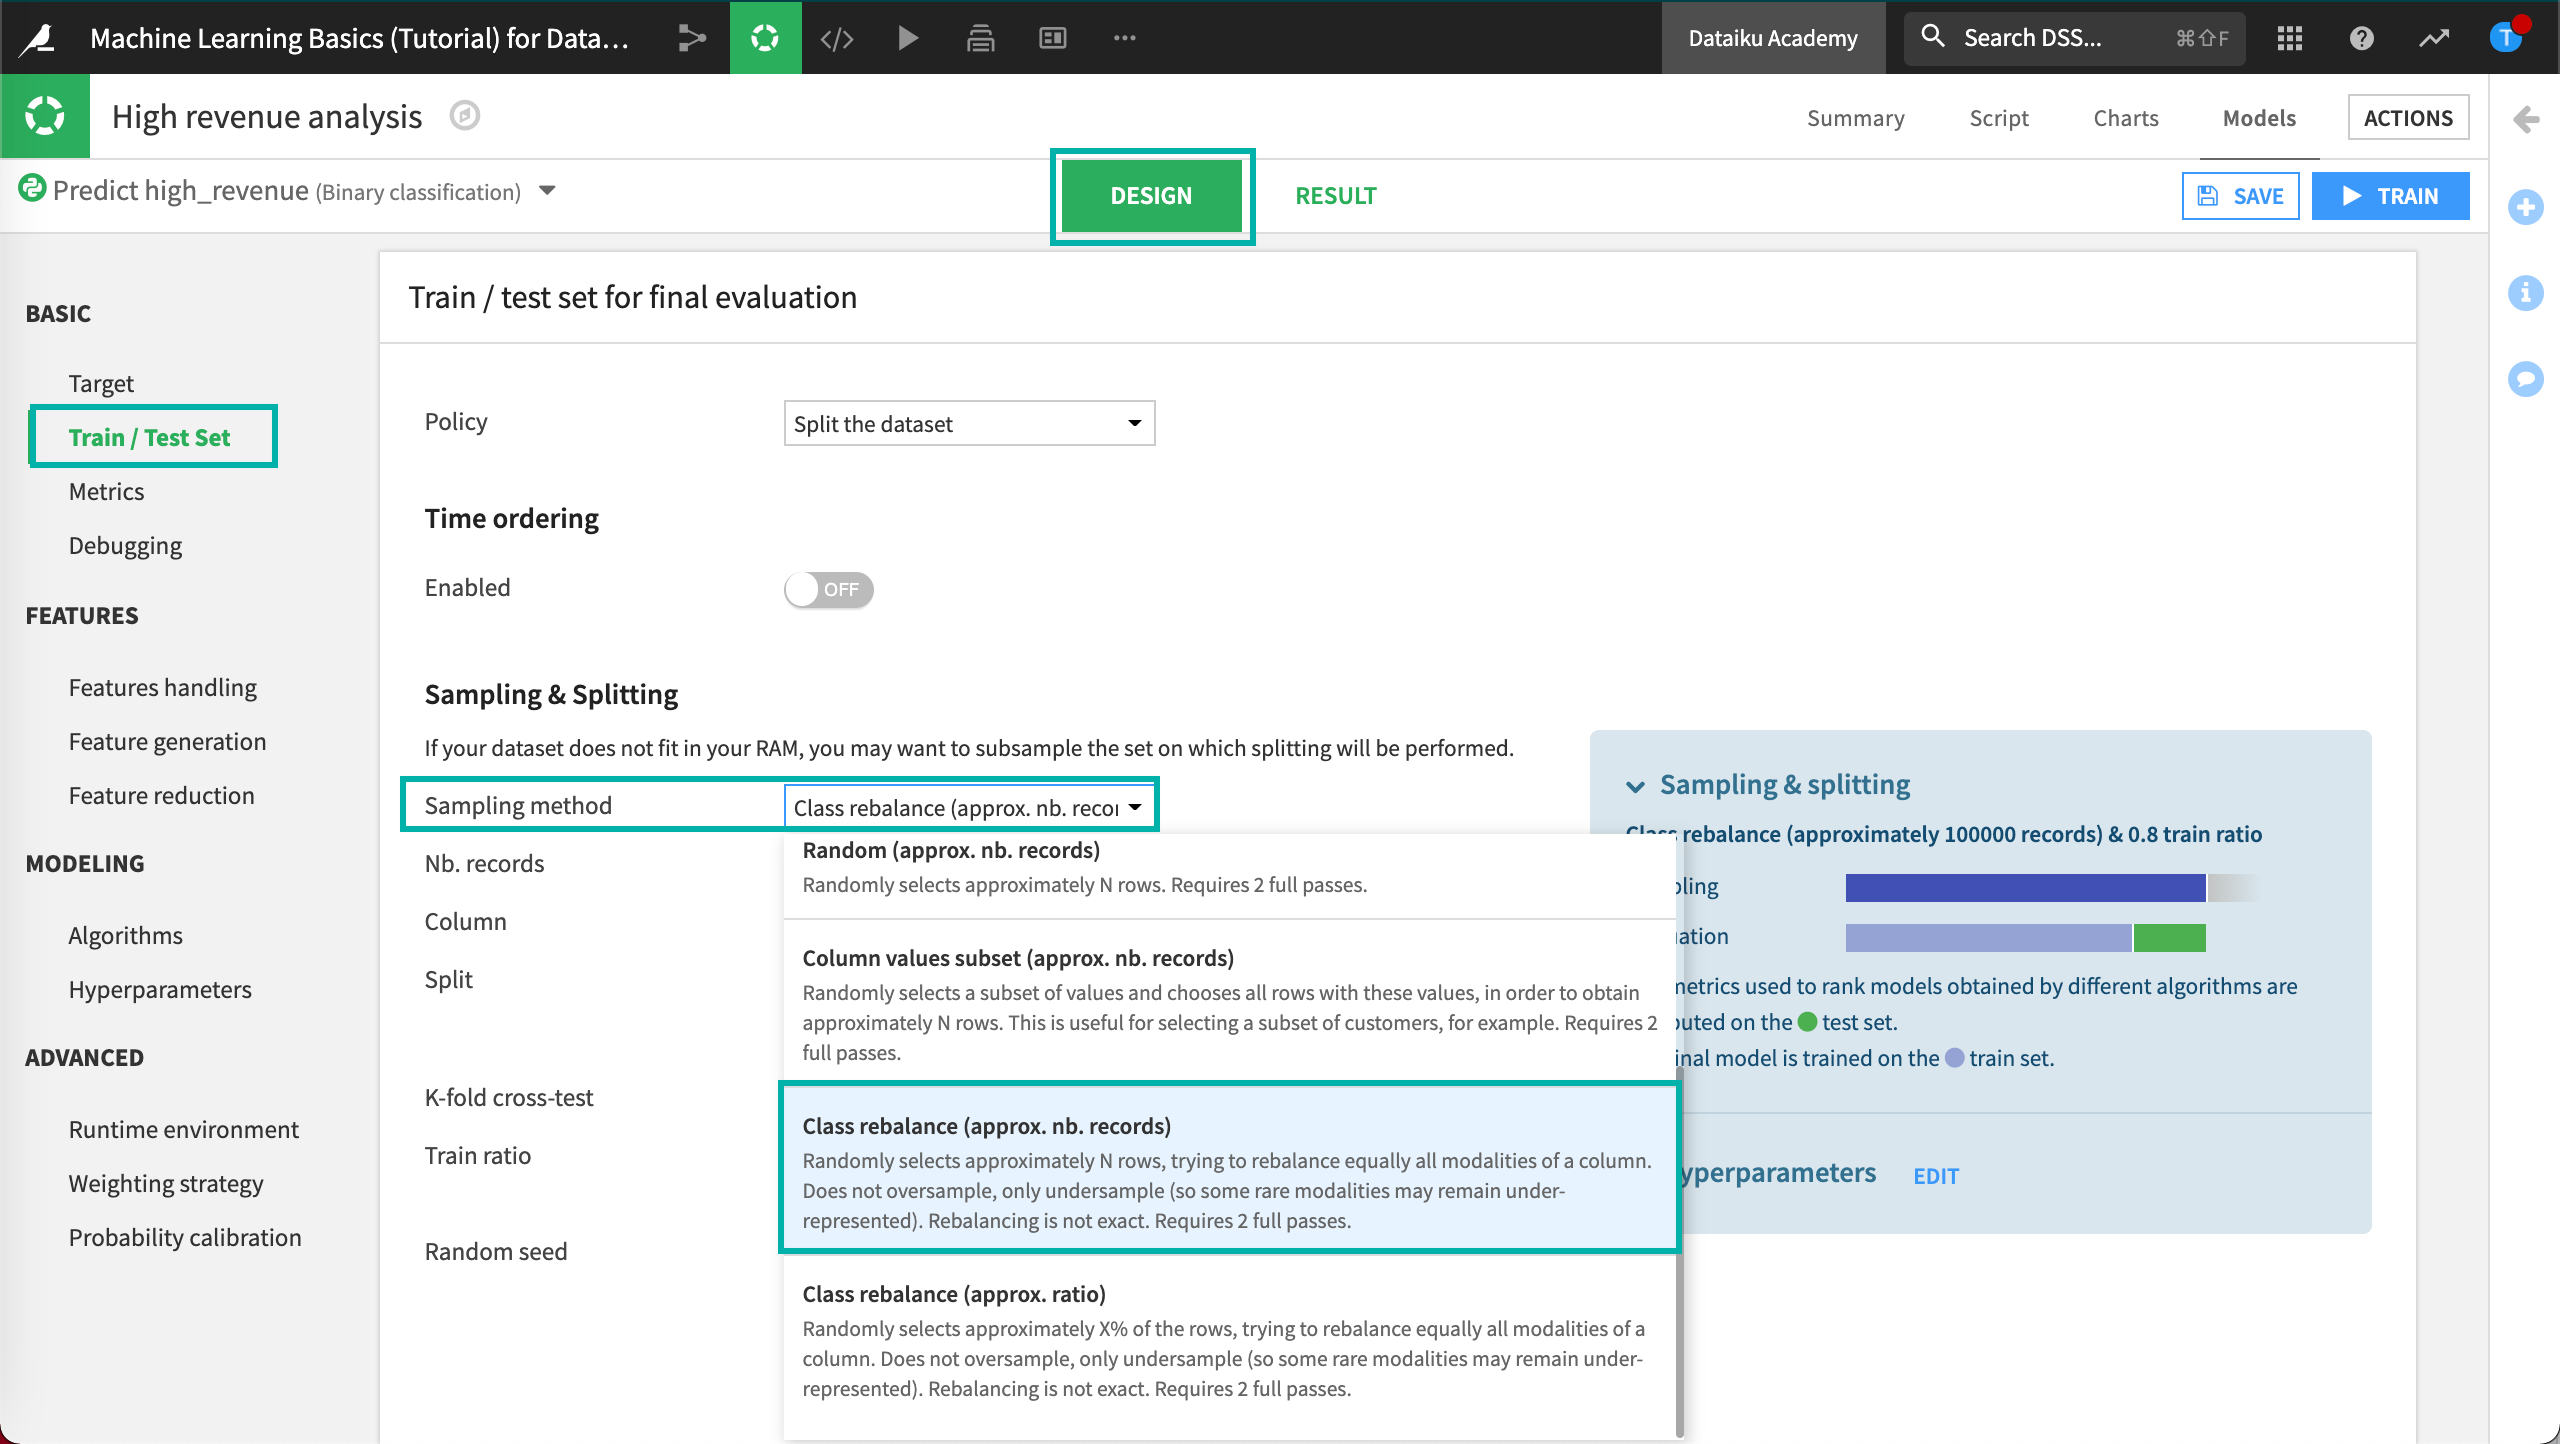
Ensure the Nb. records is set to
100000.Set the Column to use in rebalancing to
high_revenue(our target).Save your changes.
When we train the model, Dataiku DSS will use our selected sampling method to randomly select the specified number of record (approximately) in an effort to try to rebalance equally all modalities of the column, high_revenue.
Tip
If Dataiku DSS displays the error, “Invalid argument”, letting you know the column chosen for class rebalancing does not exist, then check to make sure you spelled the column name correctly.
Configure ML Assertions
One of the ways to streamline and accelerate the model evaluation process is by automatically checking that predictions for specific subpopulations meet certain conditions.
A business analyst has analyzed the relationship between the top two variables from the Variables importance chart, age_first_order and pages_visited_avg, and the target, high_revenue, to assert the following:
When age_first_order is greater than or equal to 40, the customer is likely to be labeled “high revenue = true” at least 10% of the time.
When count of pages_visited_avg is between 6 and 12, the customer is likely to be labeled “high revenue = true” at least 10% of the time.
Rather than having to spot check the predicted results, we can add a conditional statement, known as an ML Assertion, to check that the model is behaving intuitively.
To add assertions:
In the Design tab, locate the Basic section.
Click Debugging, then scroll down or zoom out to view Assertions.
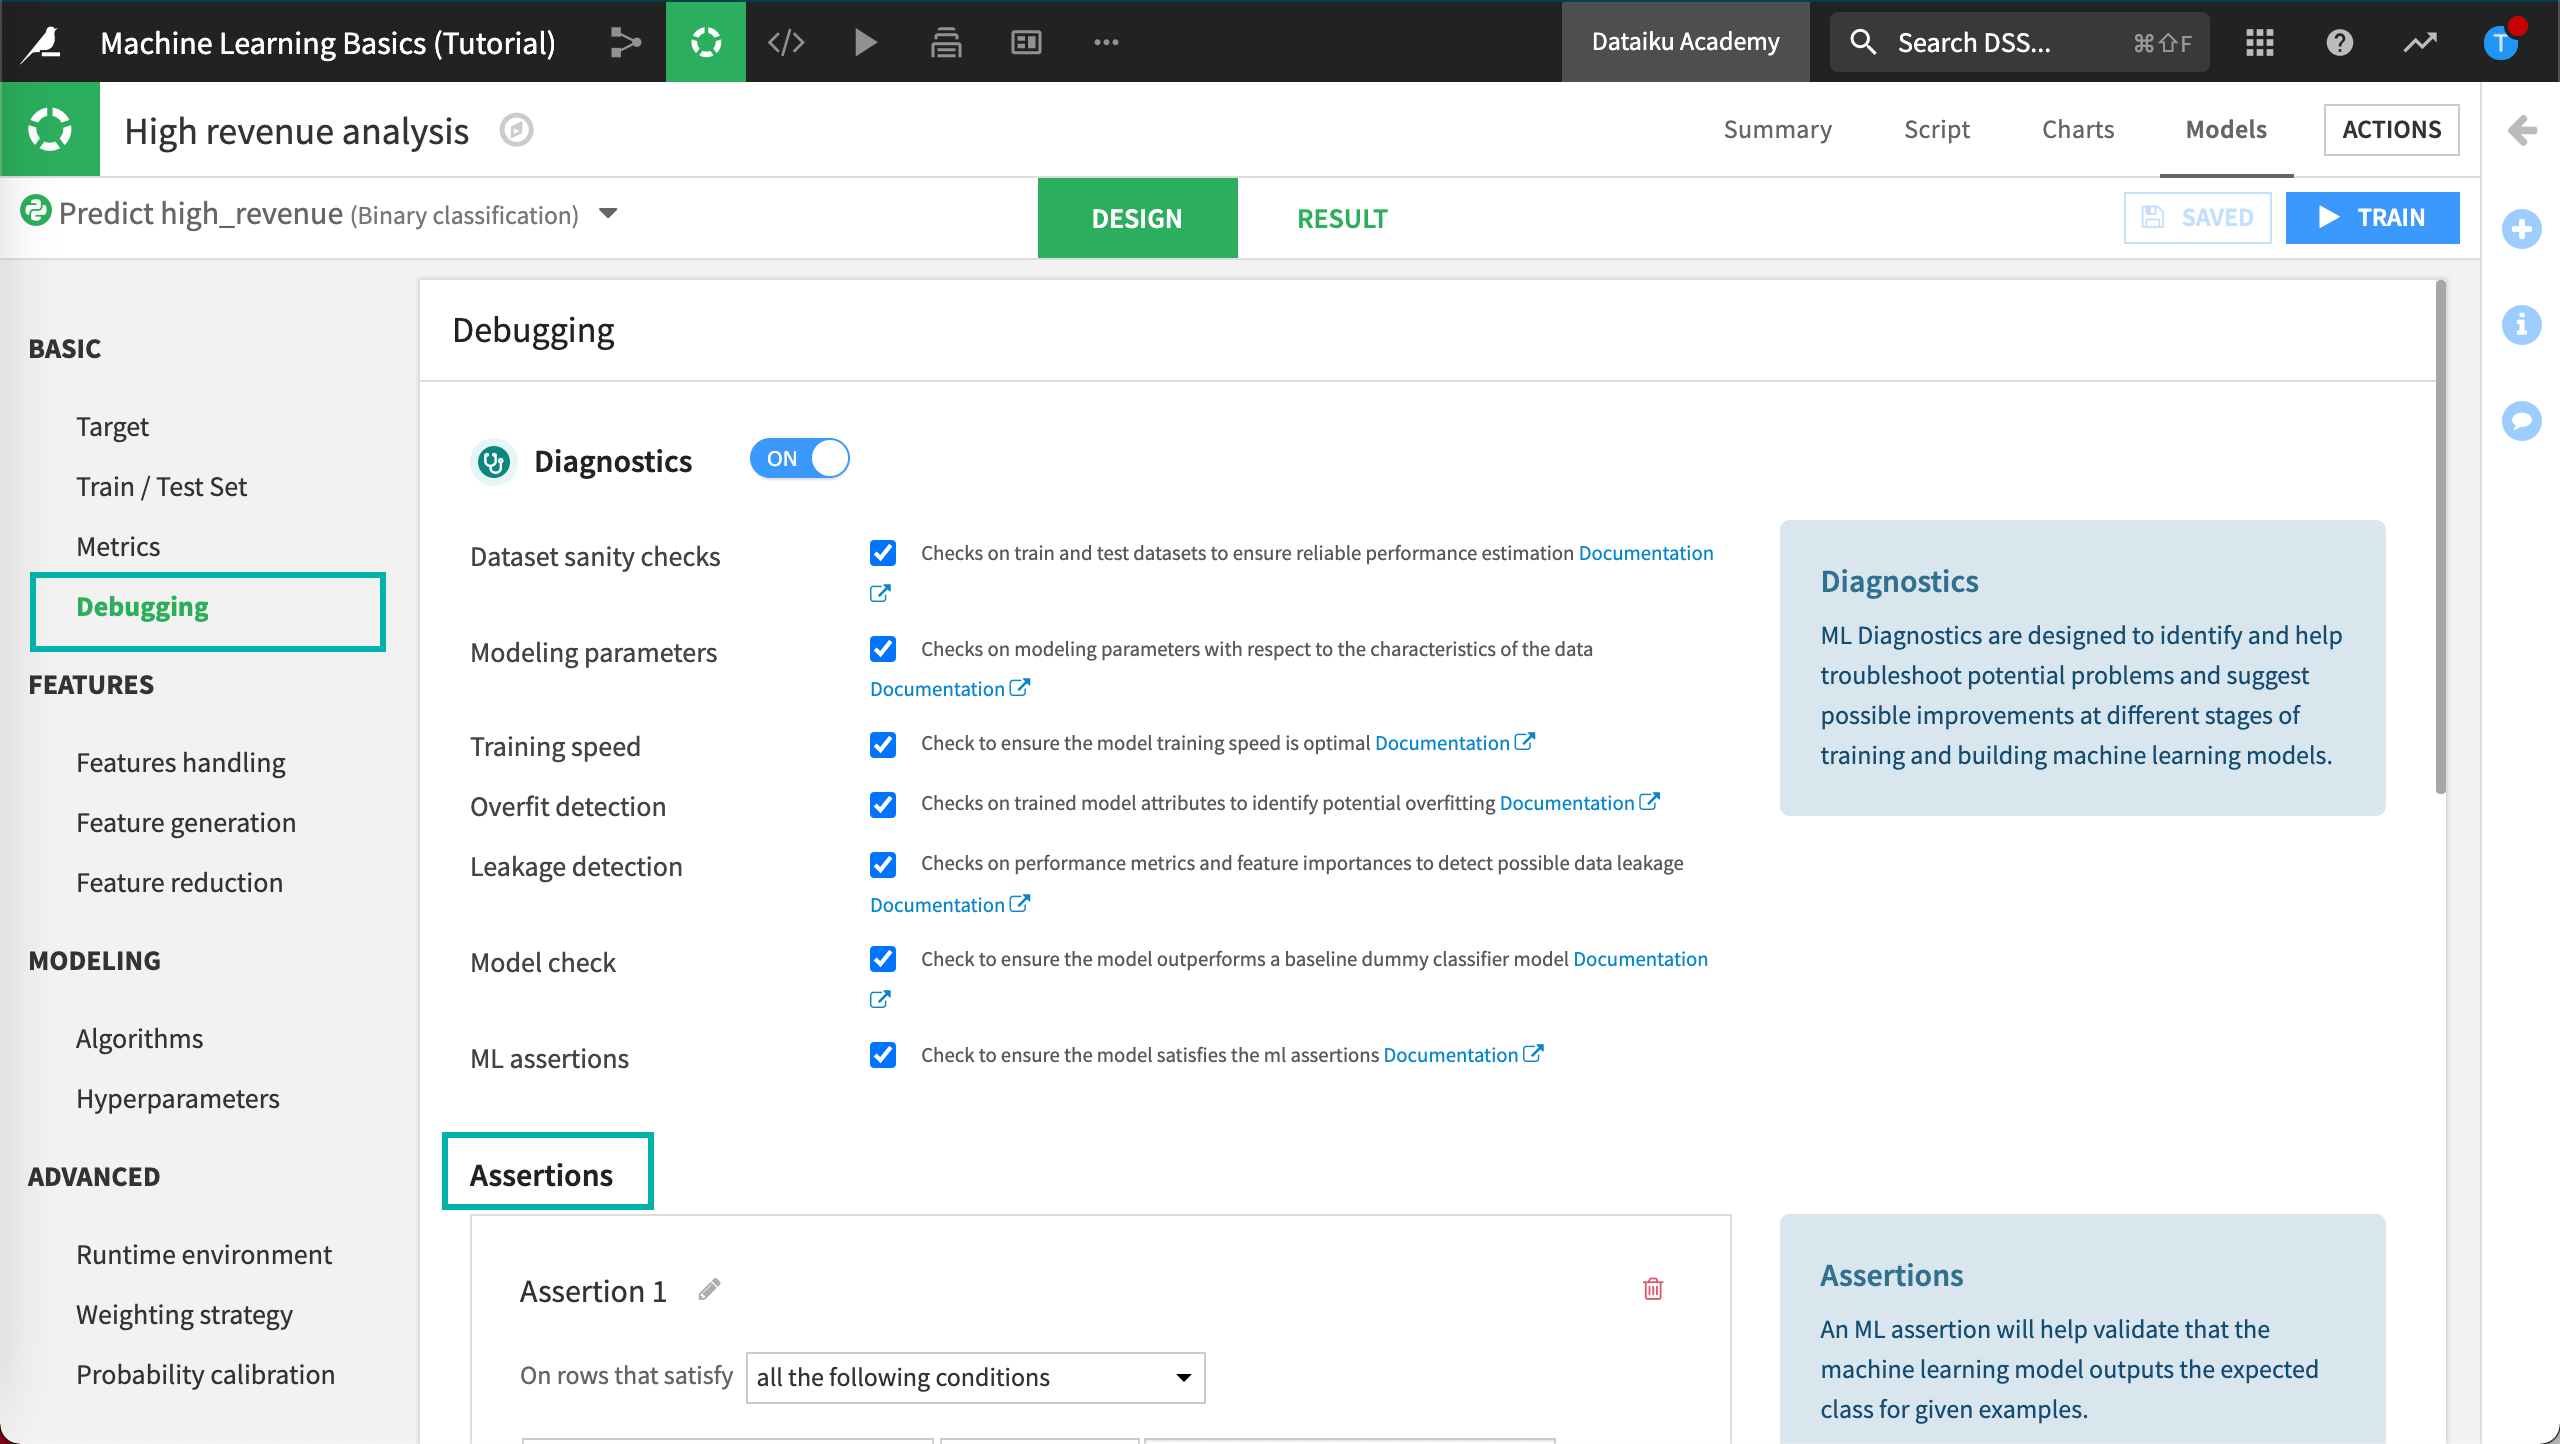
Click Add An Assertion to add the first assertion.
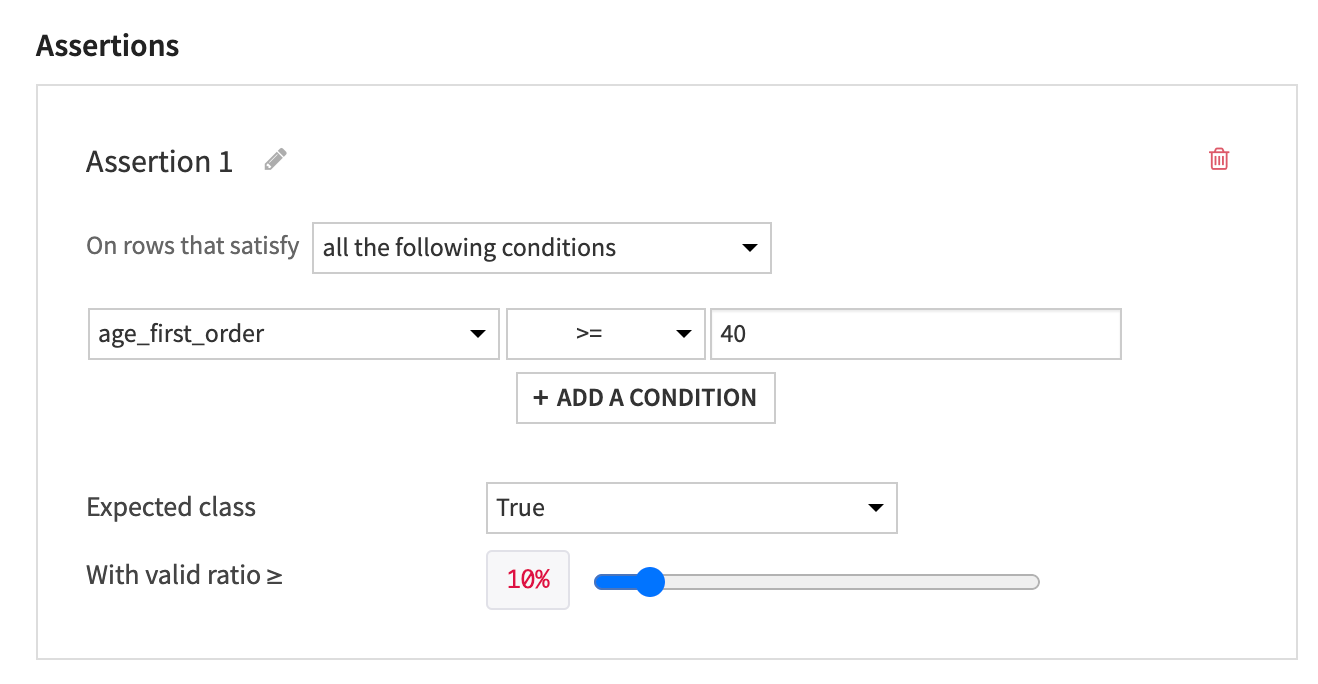
Configure the following conditional statement:
On rows that satisfy all the following conditions
age_first_order >=
40Expected class is “True”
With a valid ratio greater than or equal to 10%.
Click Add Another Assertion.
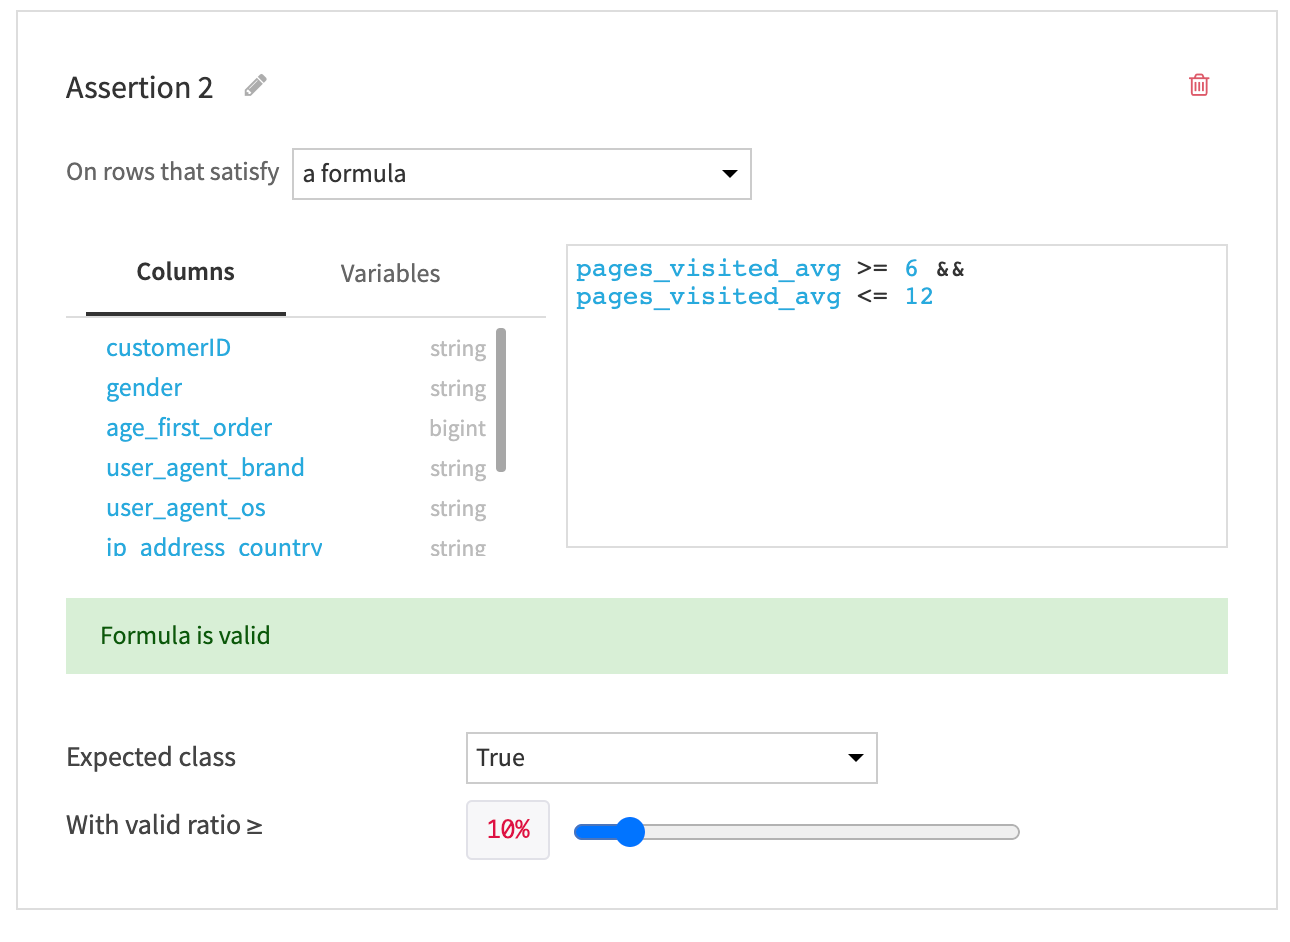
Configure the following conditional statement:
On rows that satisfy a formula
type the formula below and ensure that
Expected class is “True”.
With a valid ratio greater than or equal to 10%.
pages_visited_avg >= 6 && pages_visited_avg <= 12
Save your changes.
Now, whenever we train the model, Dataiku DSS will run ML diagnostics including the assertion check we just configured. Then we’ll be able to find the results of our assertion check by visiting the Metrics and Assertions in the Model Performance section.
Feature Handling
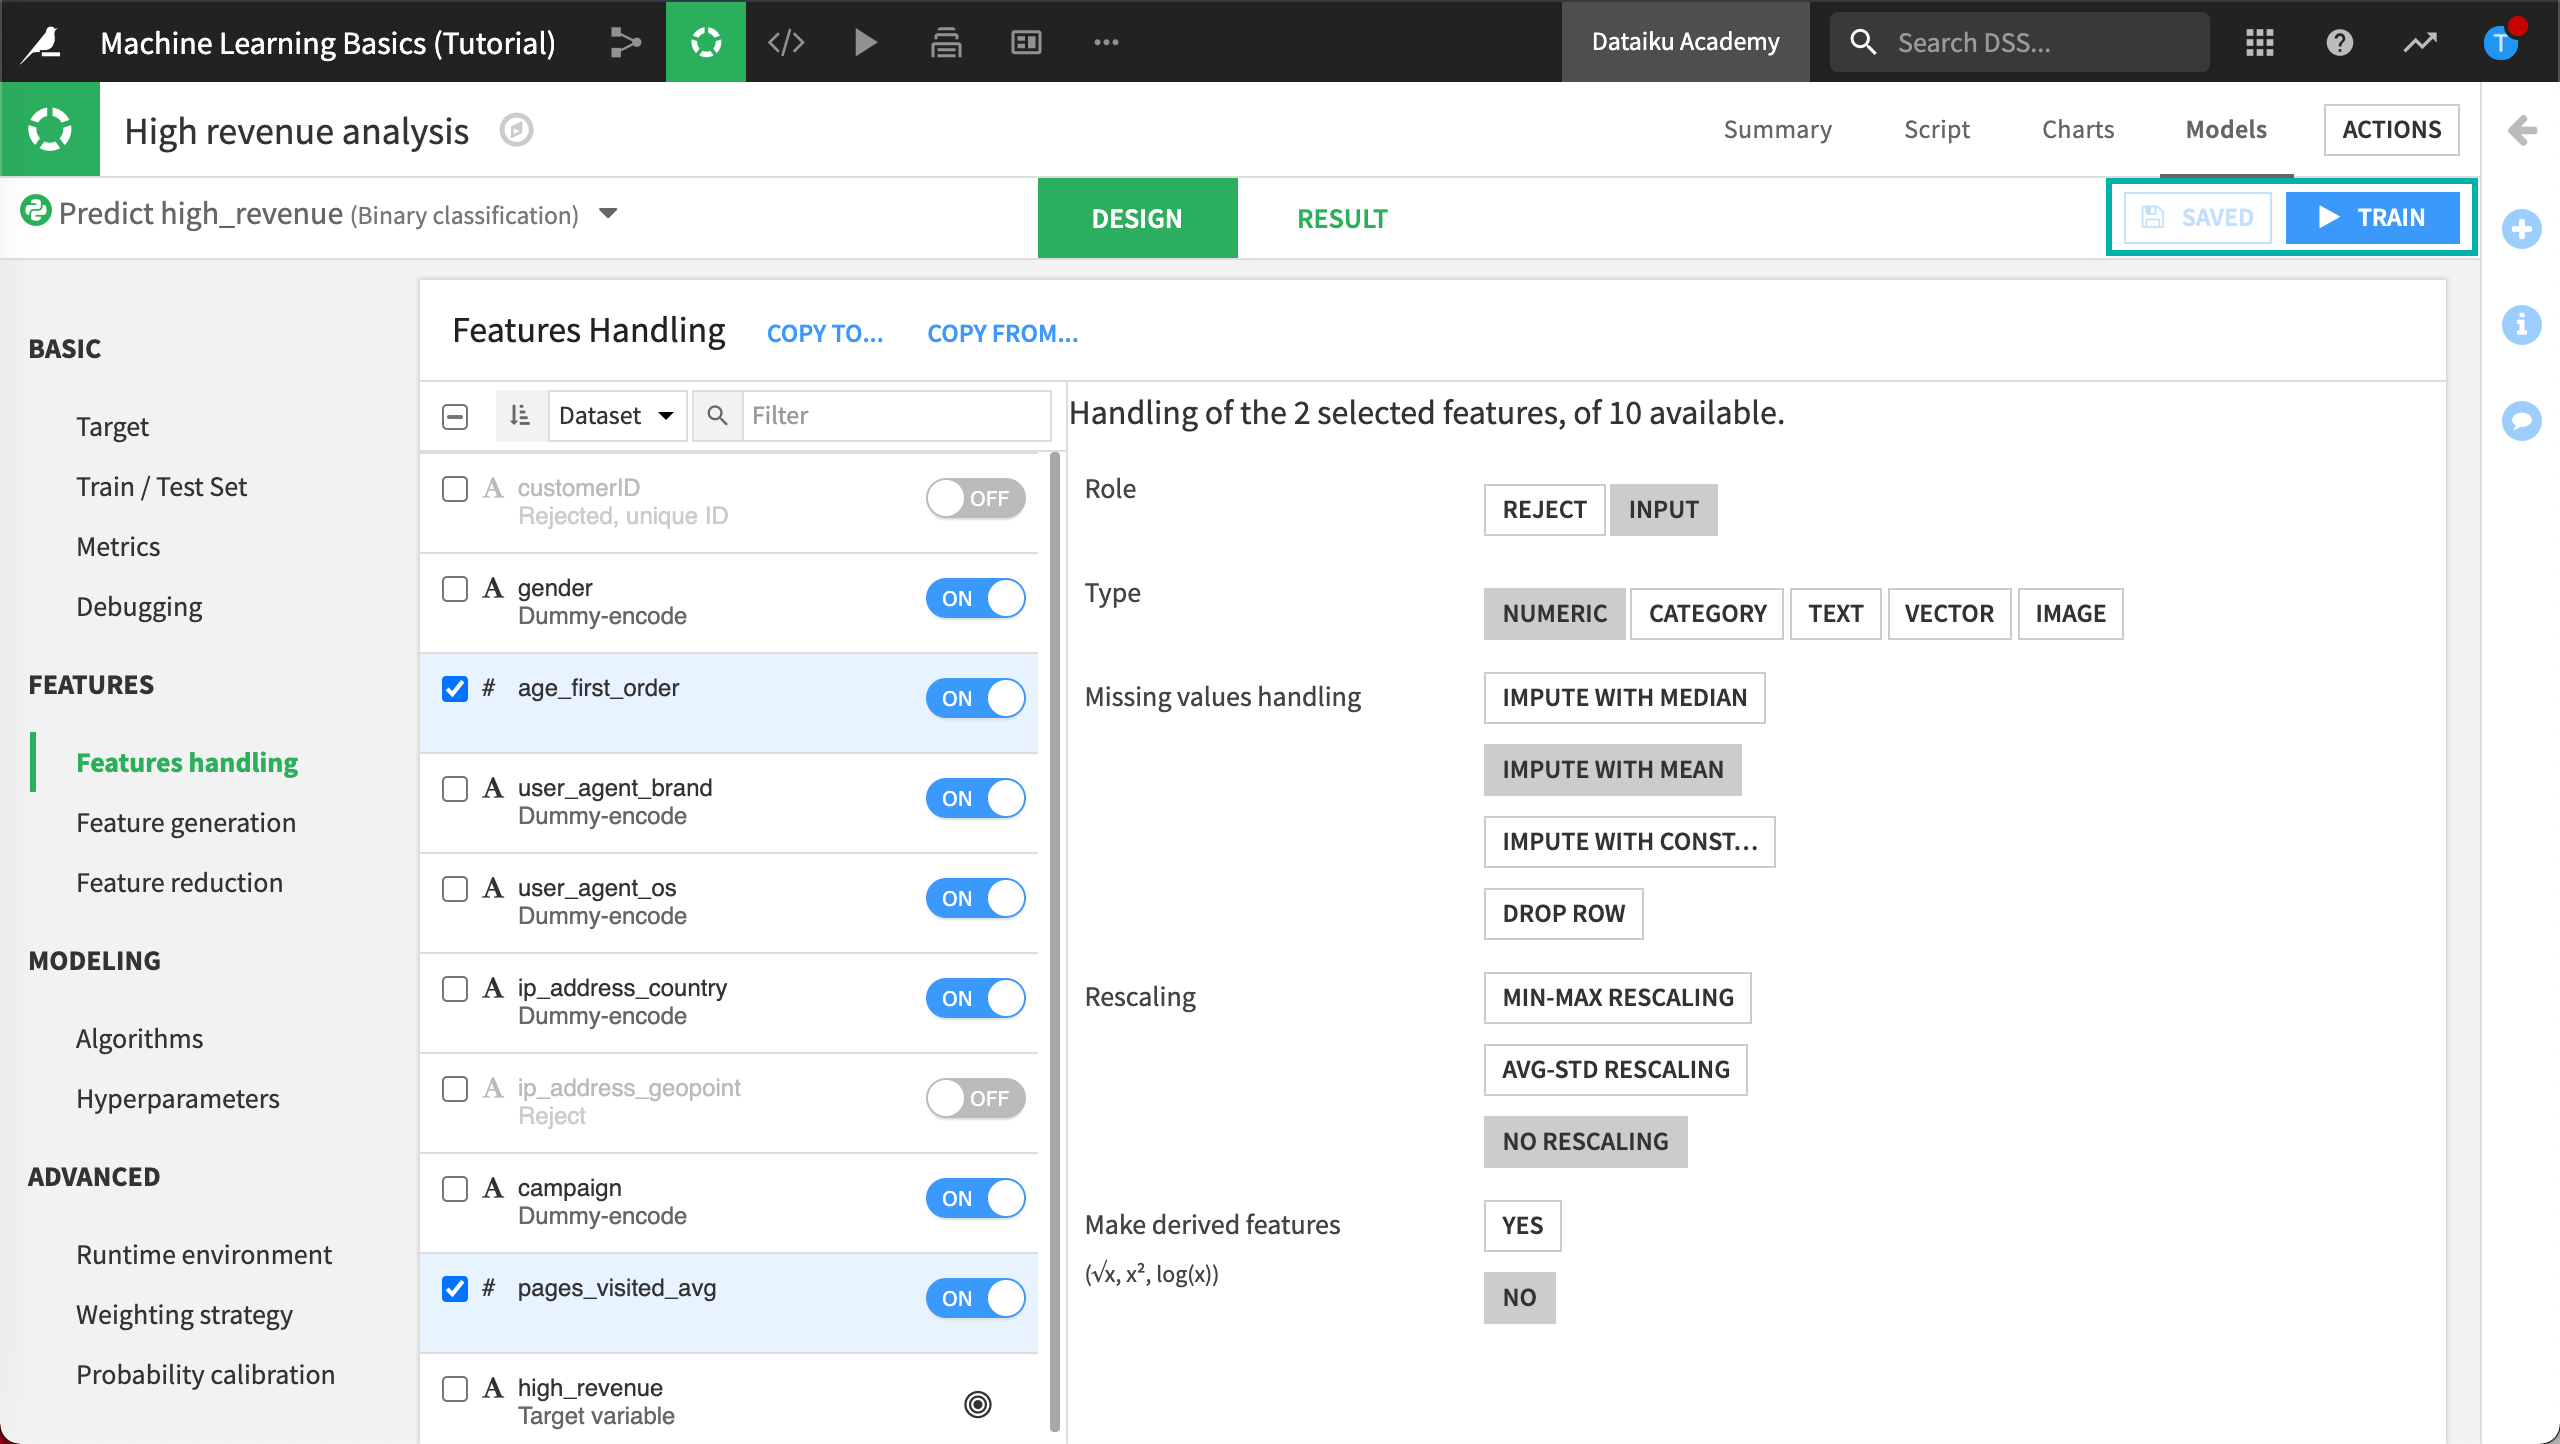
To address the issue about pre-processing of variables before training the model, we’ll use the Features handling tab. Here DSS will let you tune different settings.
Click Features handling in the Features section.
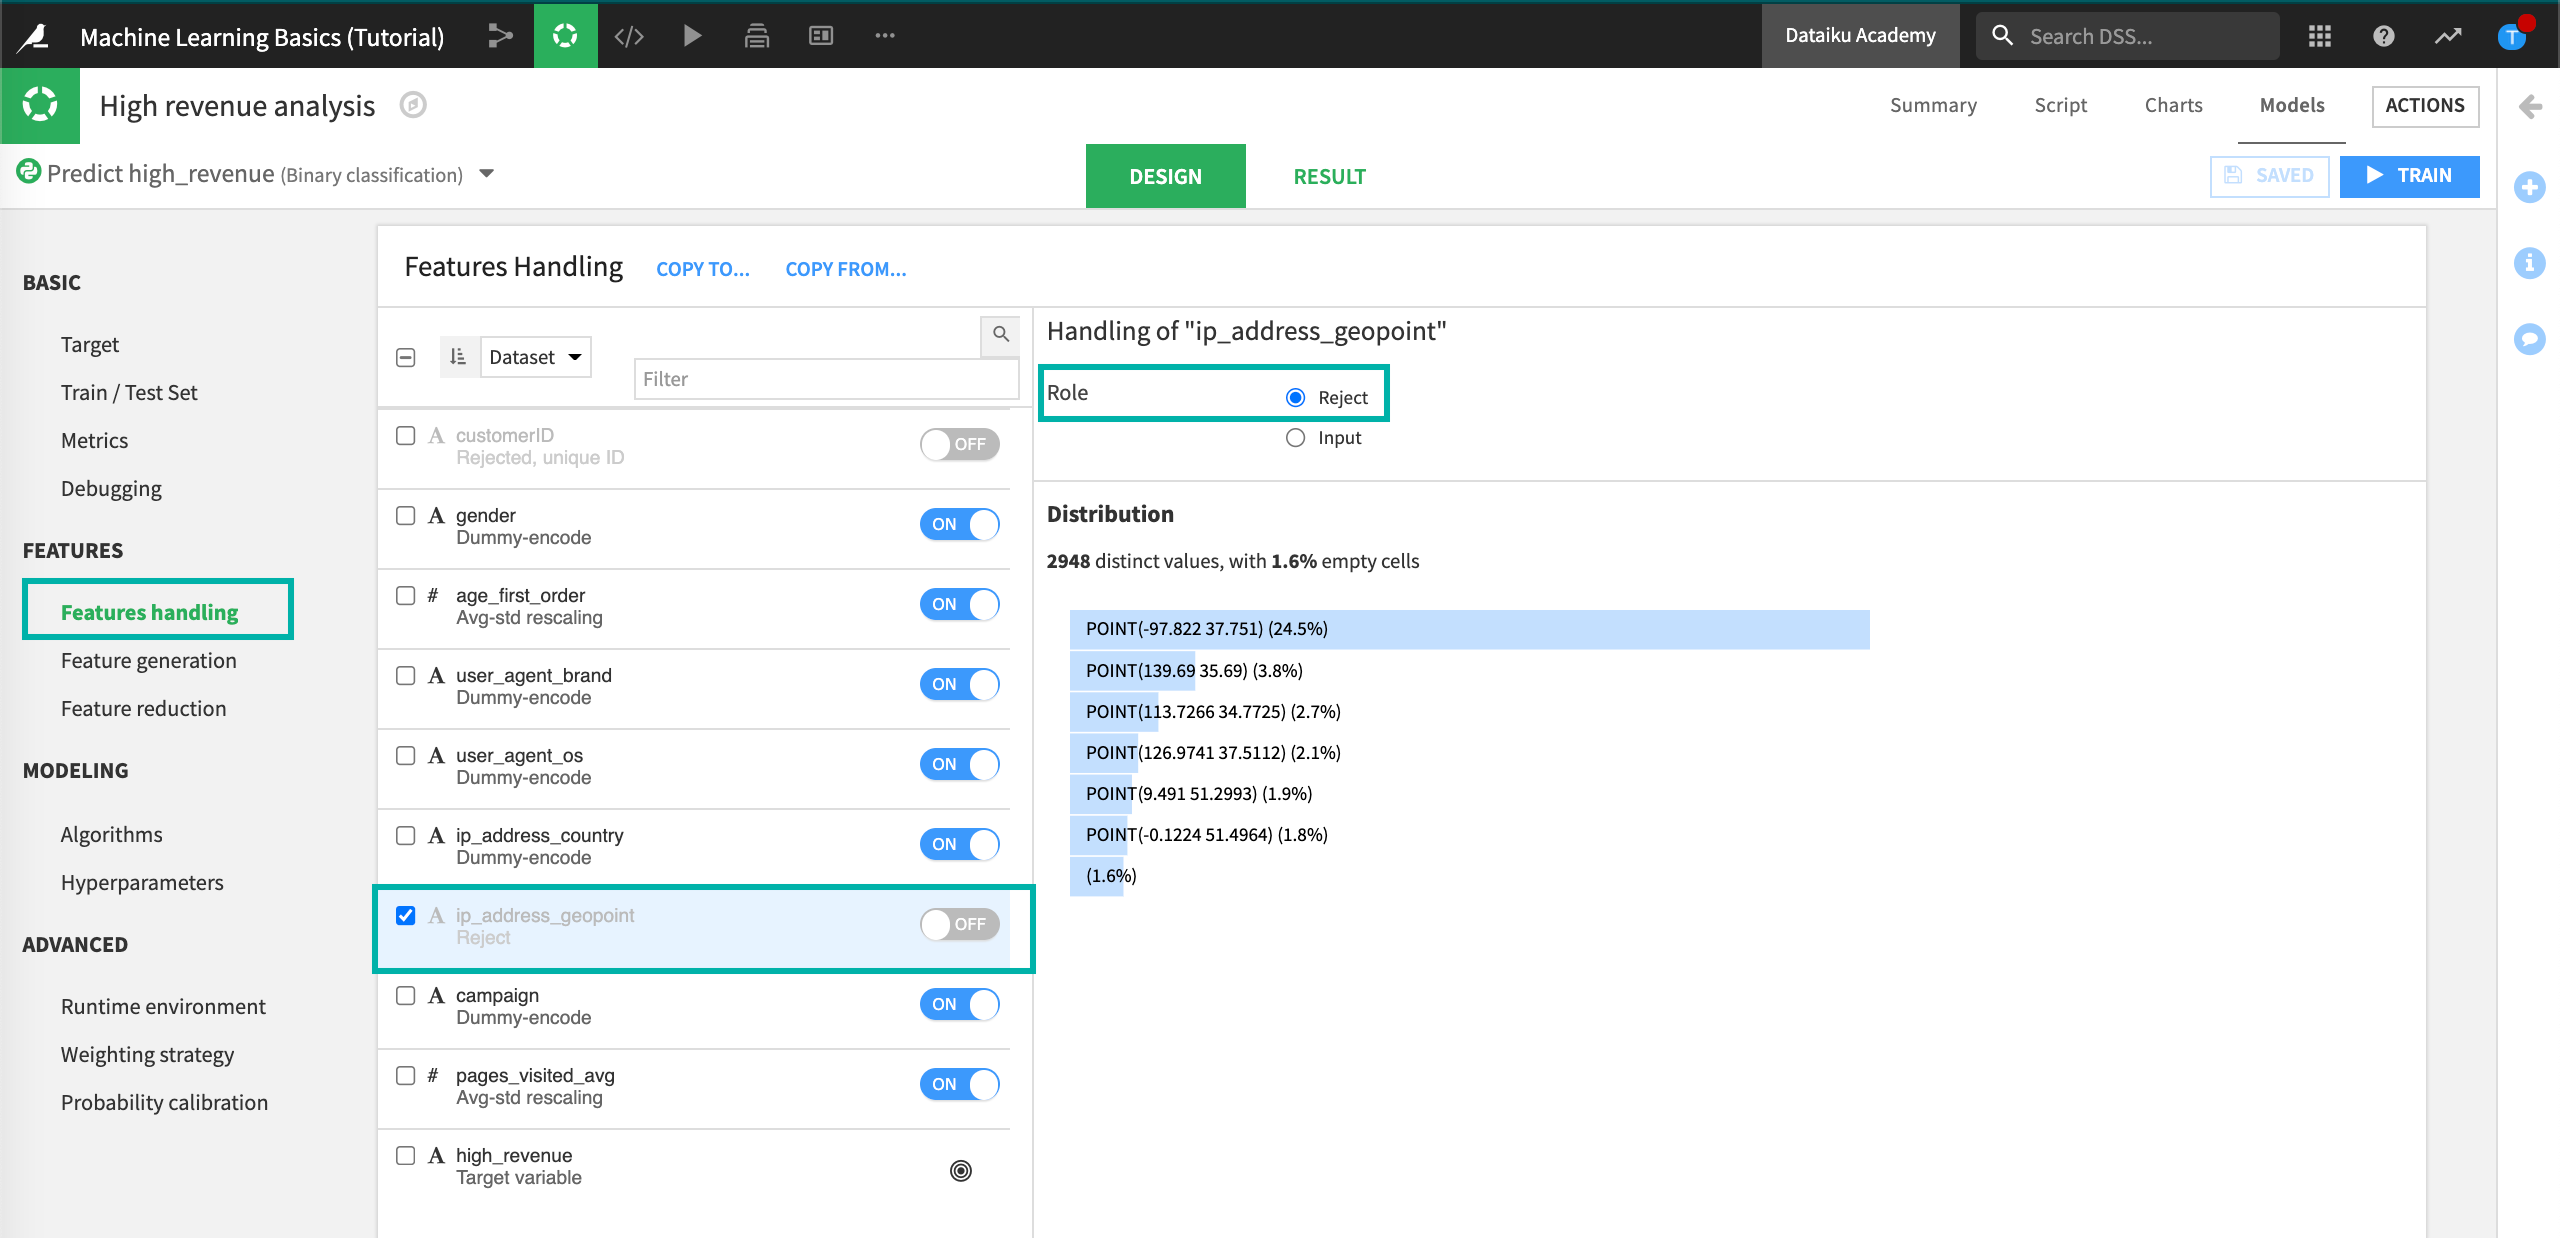
Reject Geopoint Feature
The Role of the variable (or feature) is the fact that a variable can be either used (Input) or not used (Reject) in the model.
Here, we want to remove ip_address_geopoint from the model.
Click on ip_address_geopoint and click the Reject button (alternatively, click the on/off toggle).
Disable Rescaling Behavior
Each variable type can be handled differently.
The Type of the variable is very important to define how it should be preprocessed before it is fed to the machine learning algorithm:
Numerical variables are real-valued ones. They can be integer or numerical with decimals.
Categorical variables are the ones storing nominal values: red/blue/green, a zip code, a gender, etc. Also, there will often be times when a variable that looks like Numerical should actually be Categorical instead. For example, this will be the case when an “id” is used in lieu of the actual value.
Text is meant for raw blocks of textual data, such as a Tweet, or customer review. Dataiku DSS is able to handle raw text features with specific preprocessing.
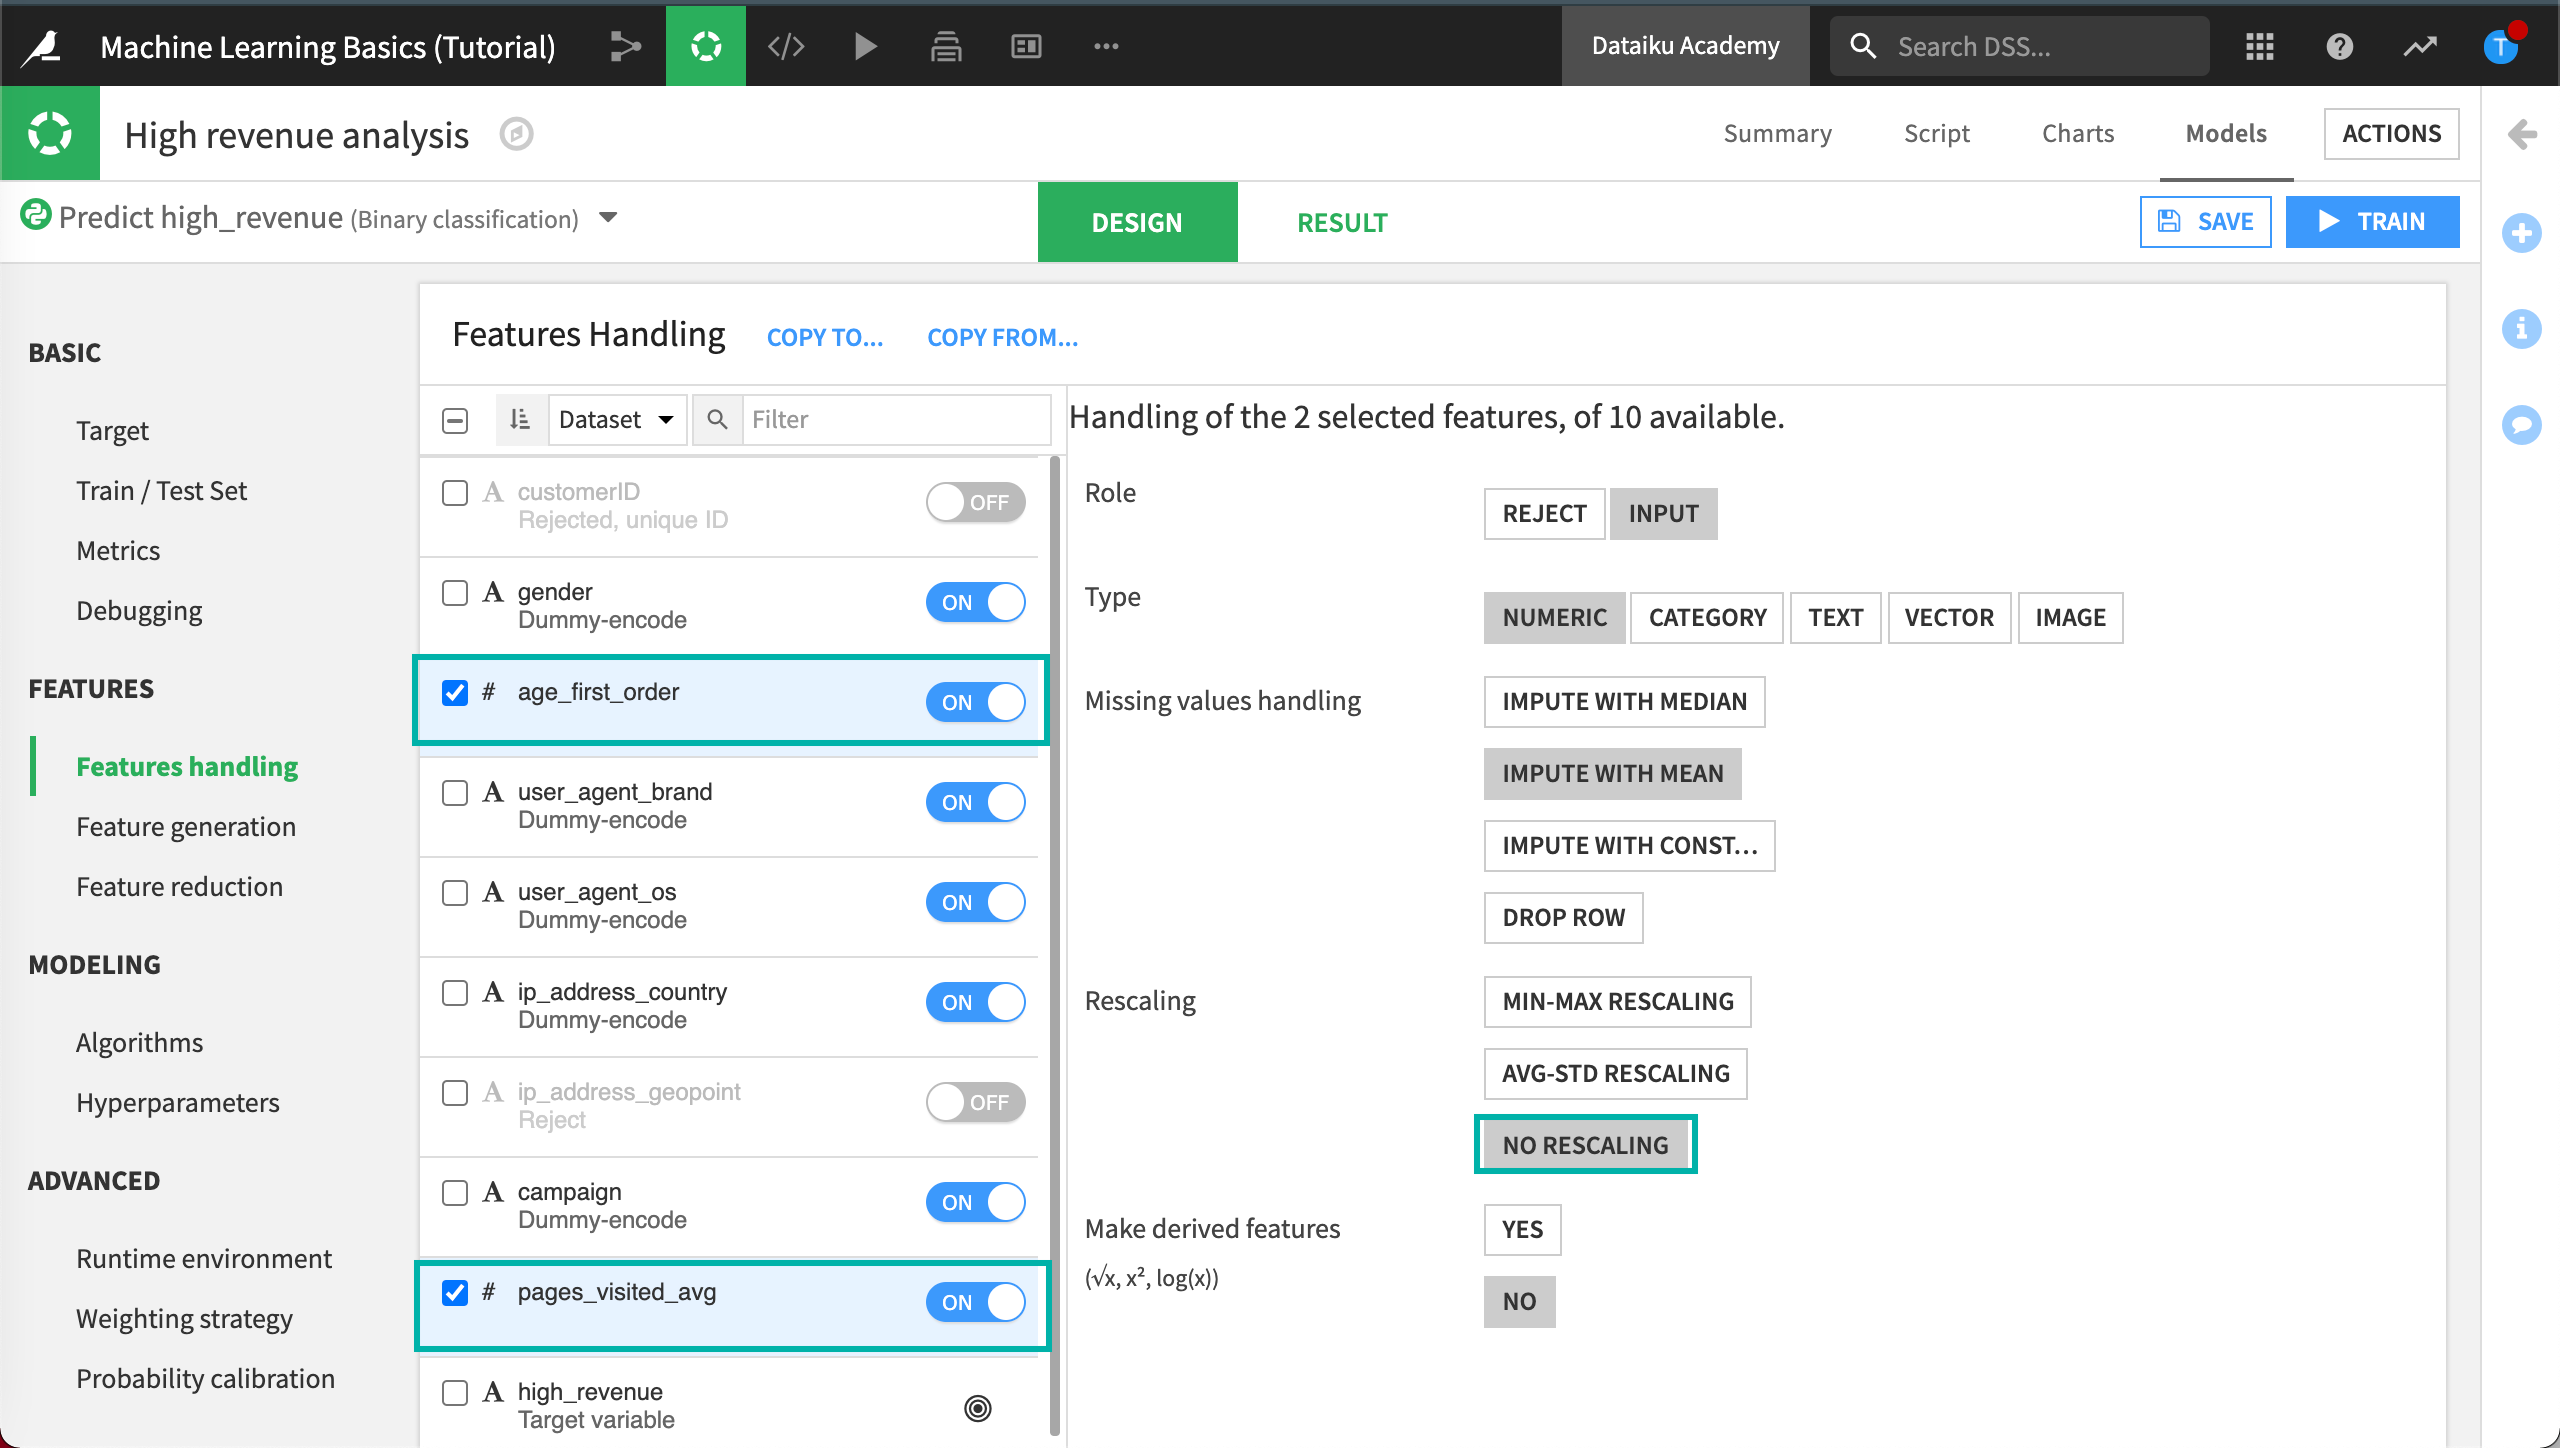
The numerical variables age_first_order and pages_visited_avg have been automatically normalized using a standard rescaling (this means that the values are normalized to have a mean of 0 and a variance of 1).
We’ll want to disable this behavior and use No rescaling instead.
Select the checkboxes for the variables age_first_order and pages_visited_avg.
Dataiku DSS displays a menu where you can select the handling of the selected features.
Click No Rescaling.
Feature Generation
Generating new features can reveal unexpected relationships between the inputs (variables/features) and the target.
We can automatically generate new numeric features using Pairwise linear combinations and Polynomial combinations of existing numeric features.
Note
Here we focus on how to generate automated features such as linear and polynomial combinations, but note that the Script tab of a visual analysis includes all of the processors found in the Prepare recipe. Any features created here can be immediately fed to models. Please review lessons on the Prepare recipe and the Lab if this is unfamiliar to you.
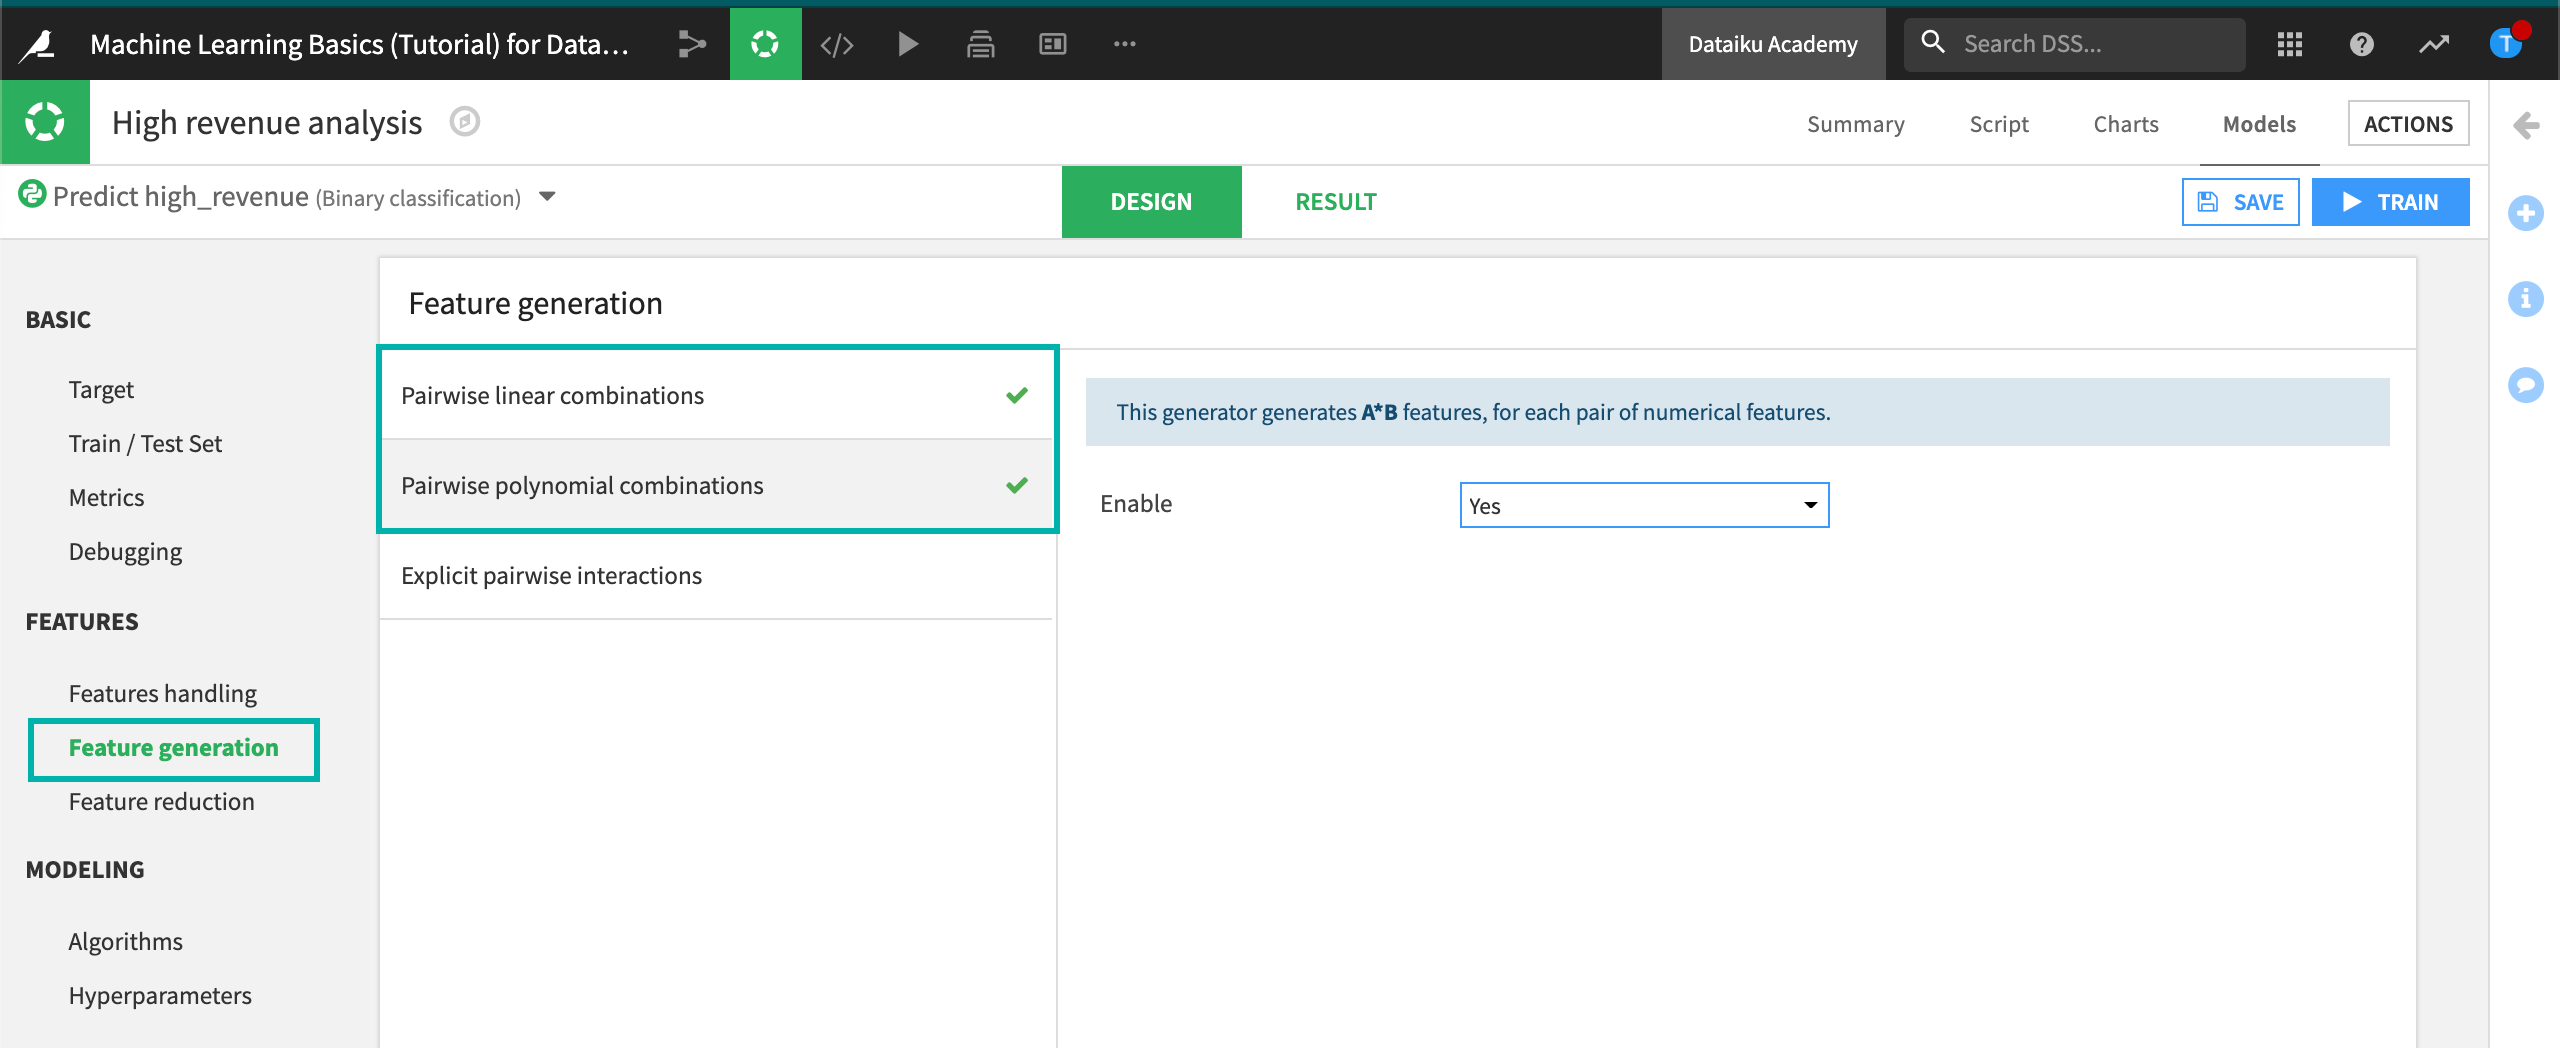
In the Features section, click Feature generation tab.
Click on Pairwise linear combinations, then set Enable to Yes.
Click on Pairwise polynomial combinations, then set Enable to Yes.
Retrain the Model
After altering the model’s settings, you can now train and build some new models.
Click Save and then click Train.
Click Train again to start Session 2.
Once Session 2 has completed, you can see that the performance of the random forest model has now slightly increased.
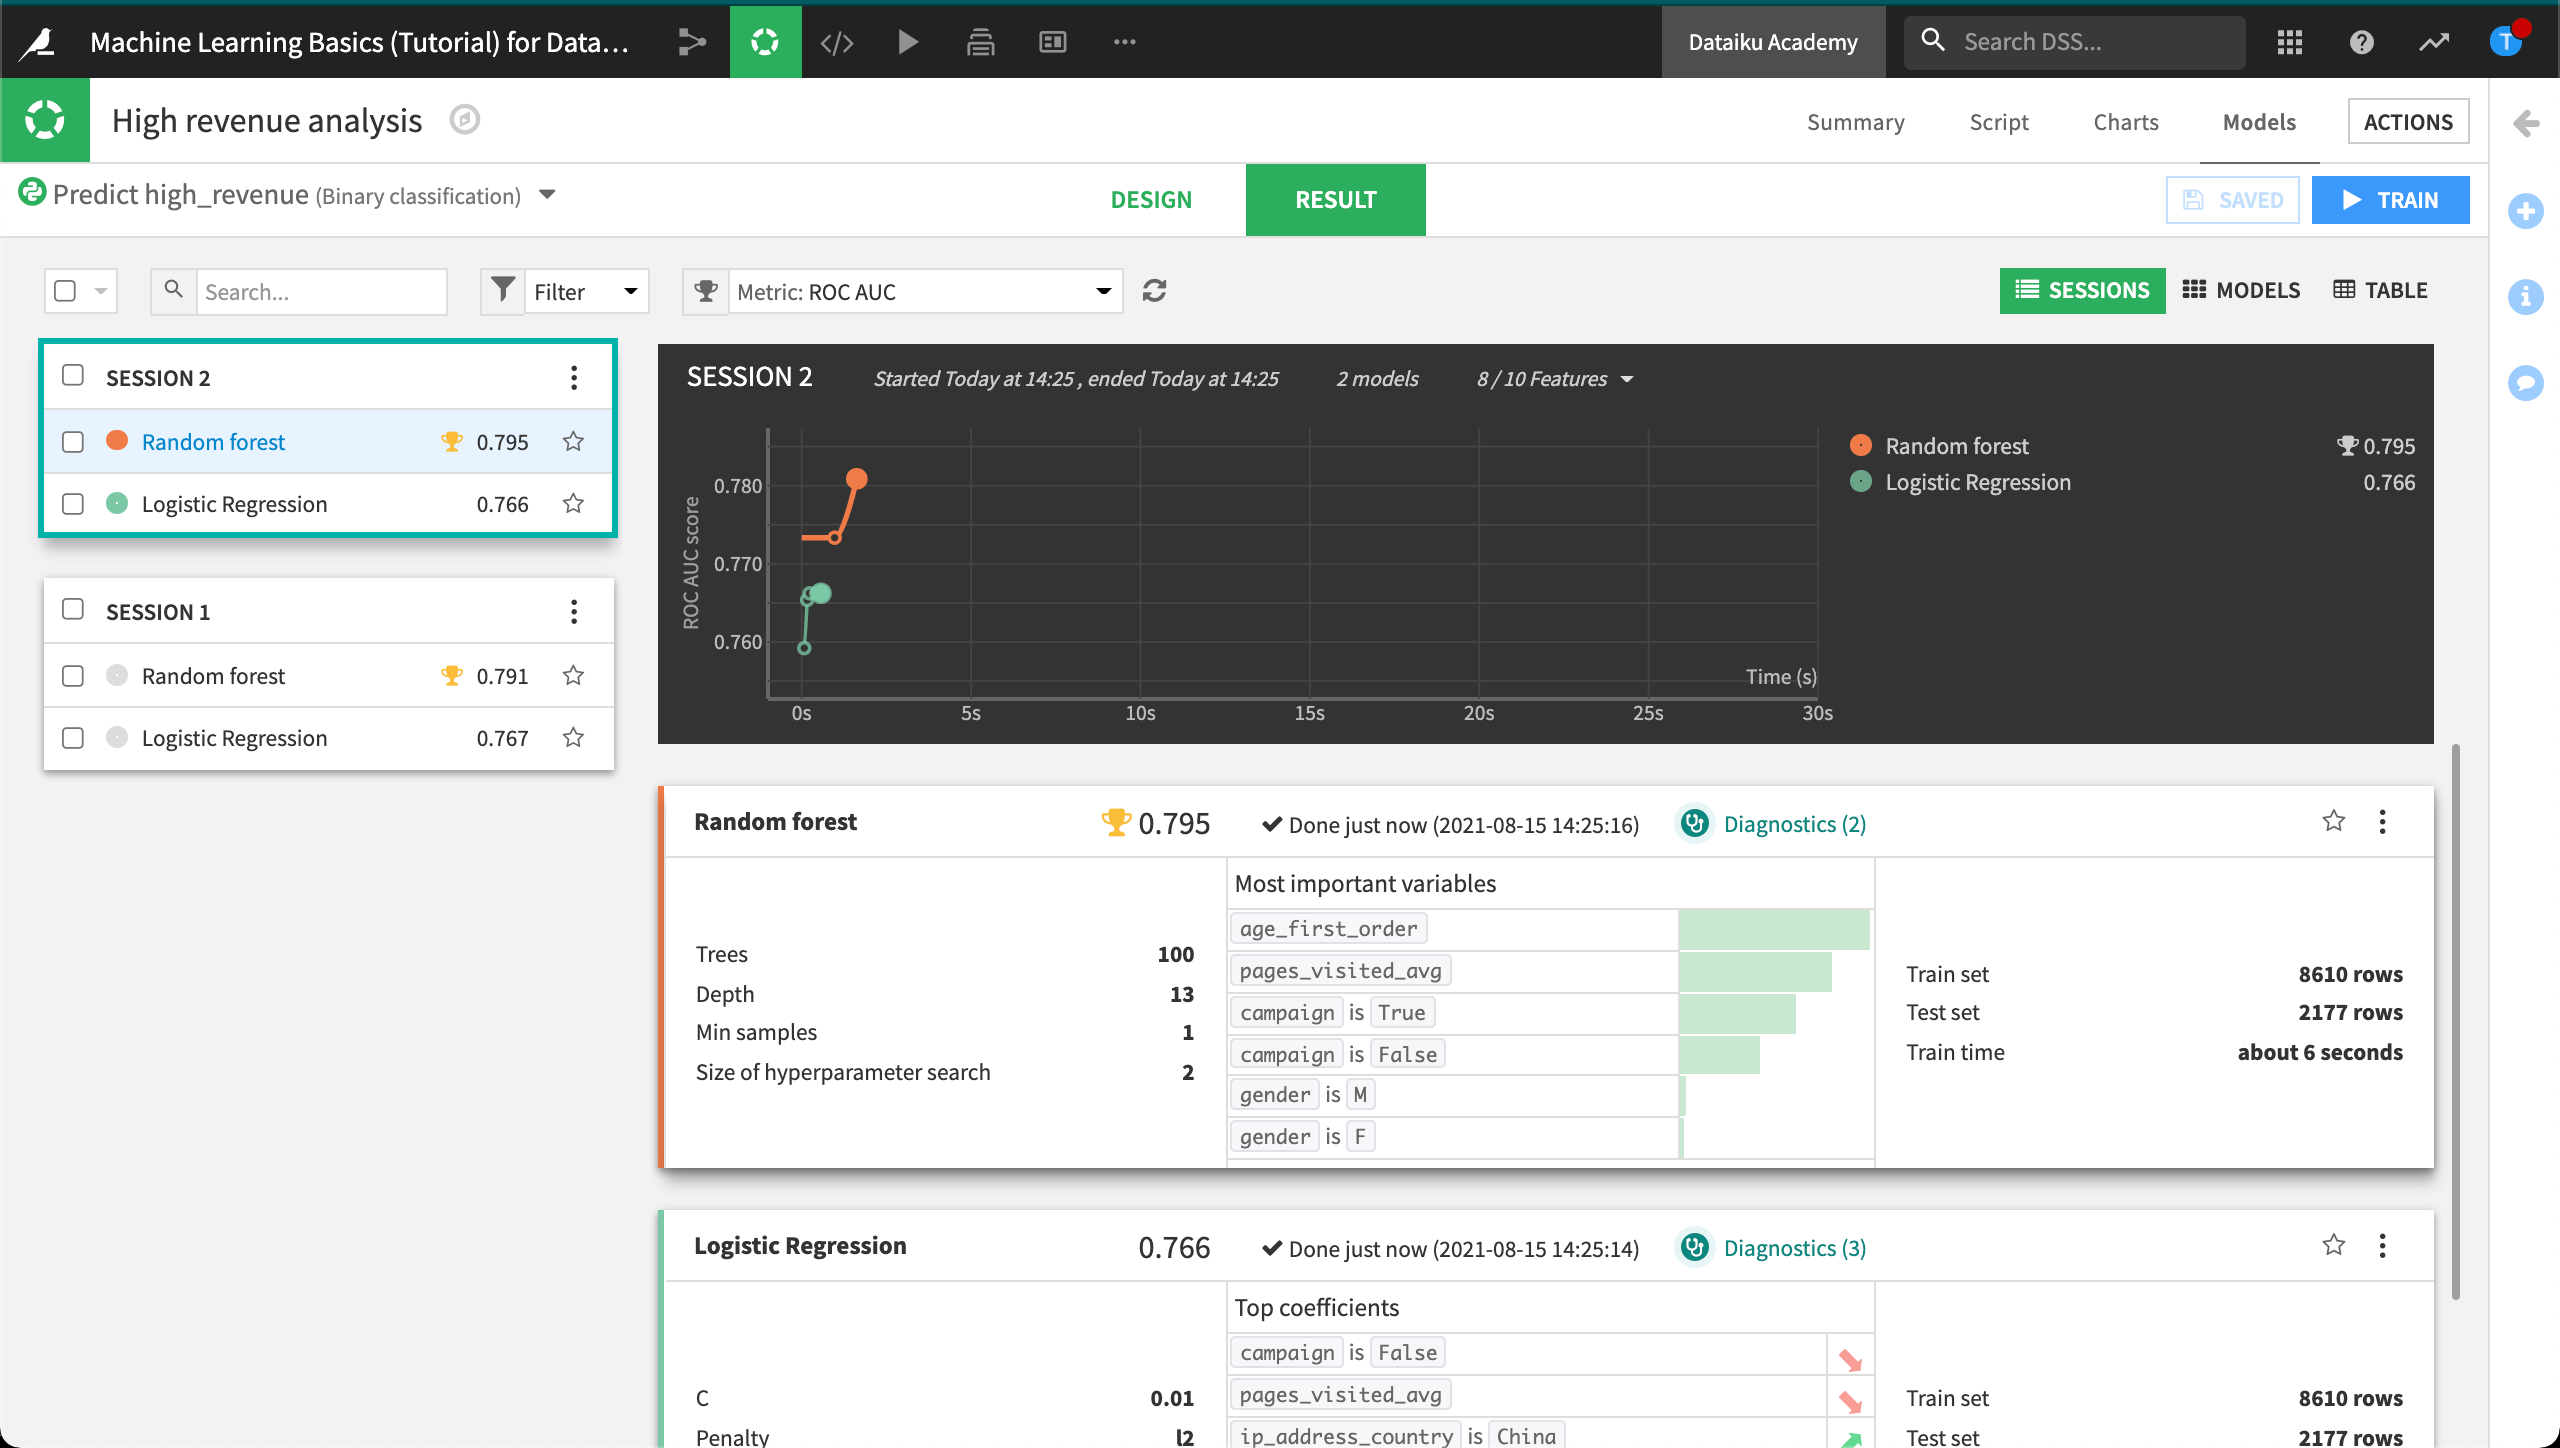
Evaluate the Model from Session 2
Session 2 results in a Random Forest model with an AUC value that is higher than the first model.
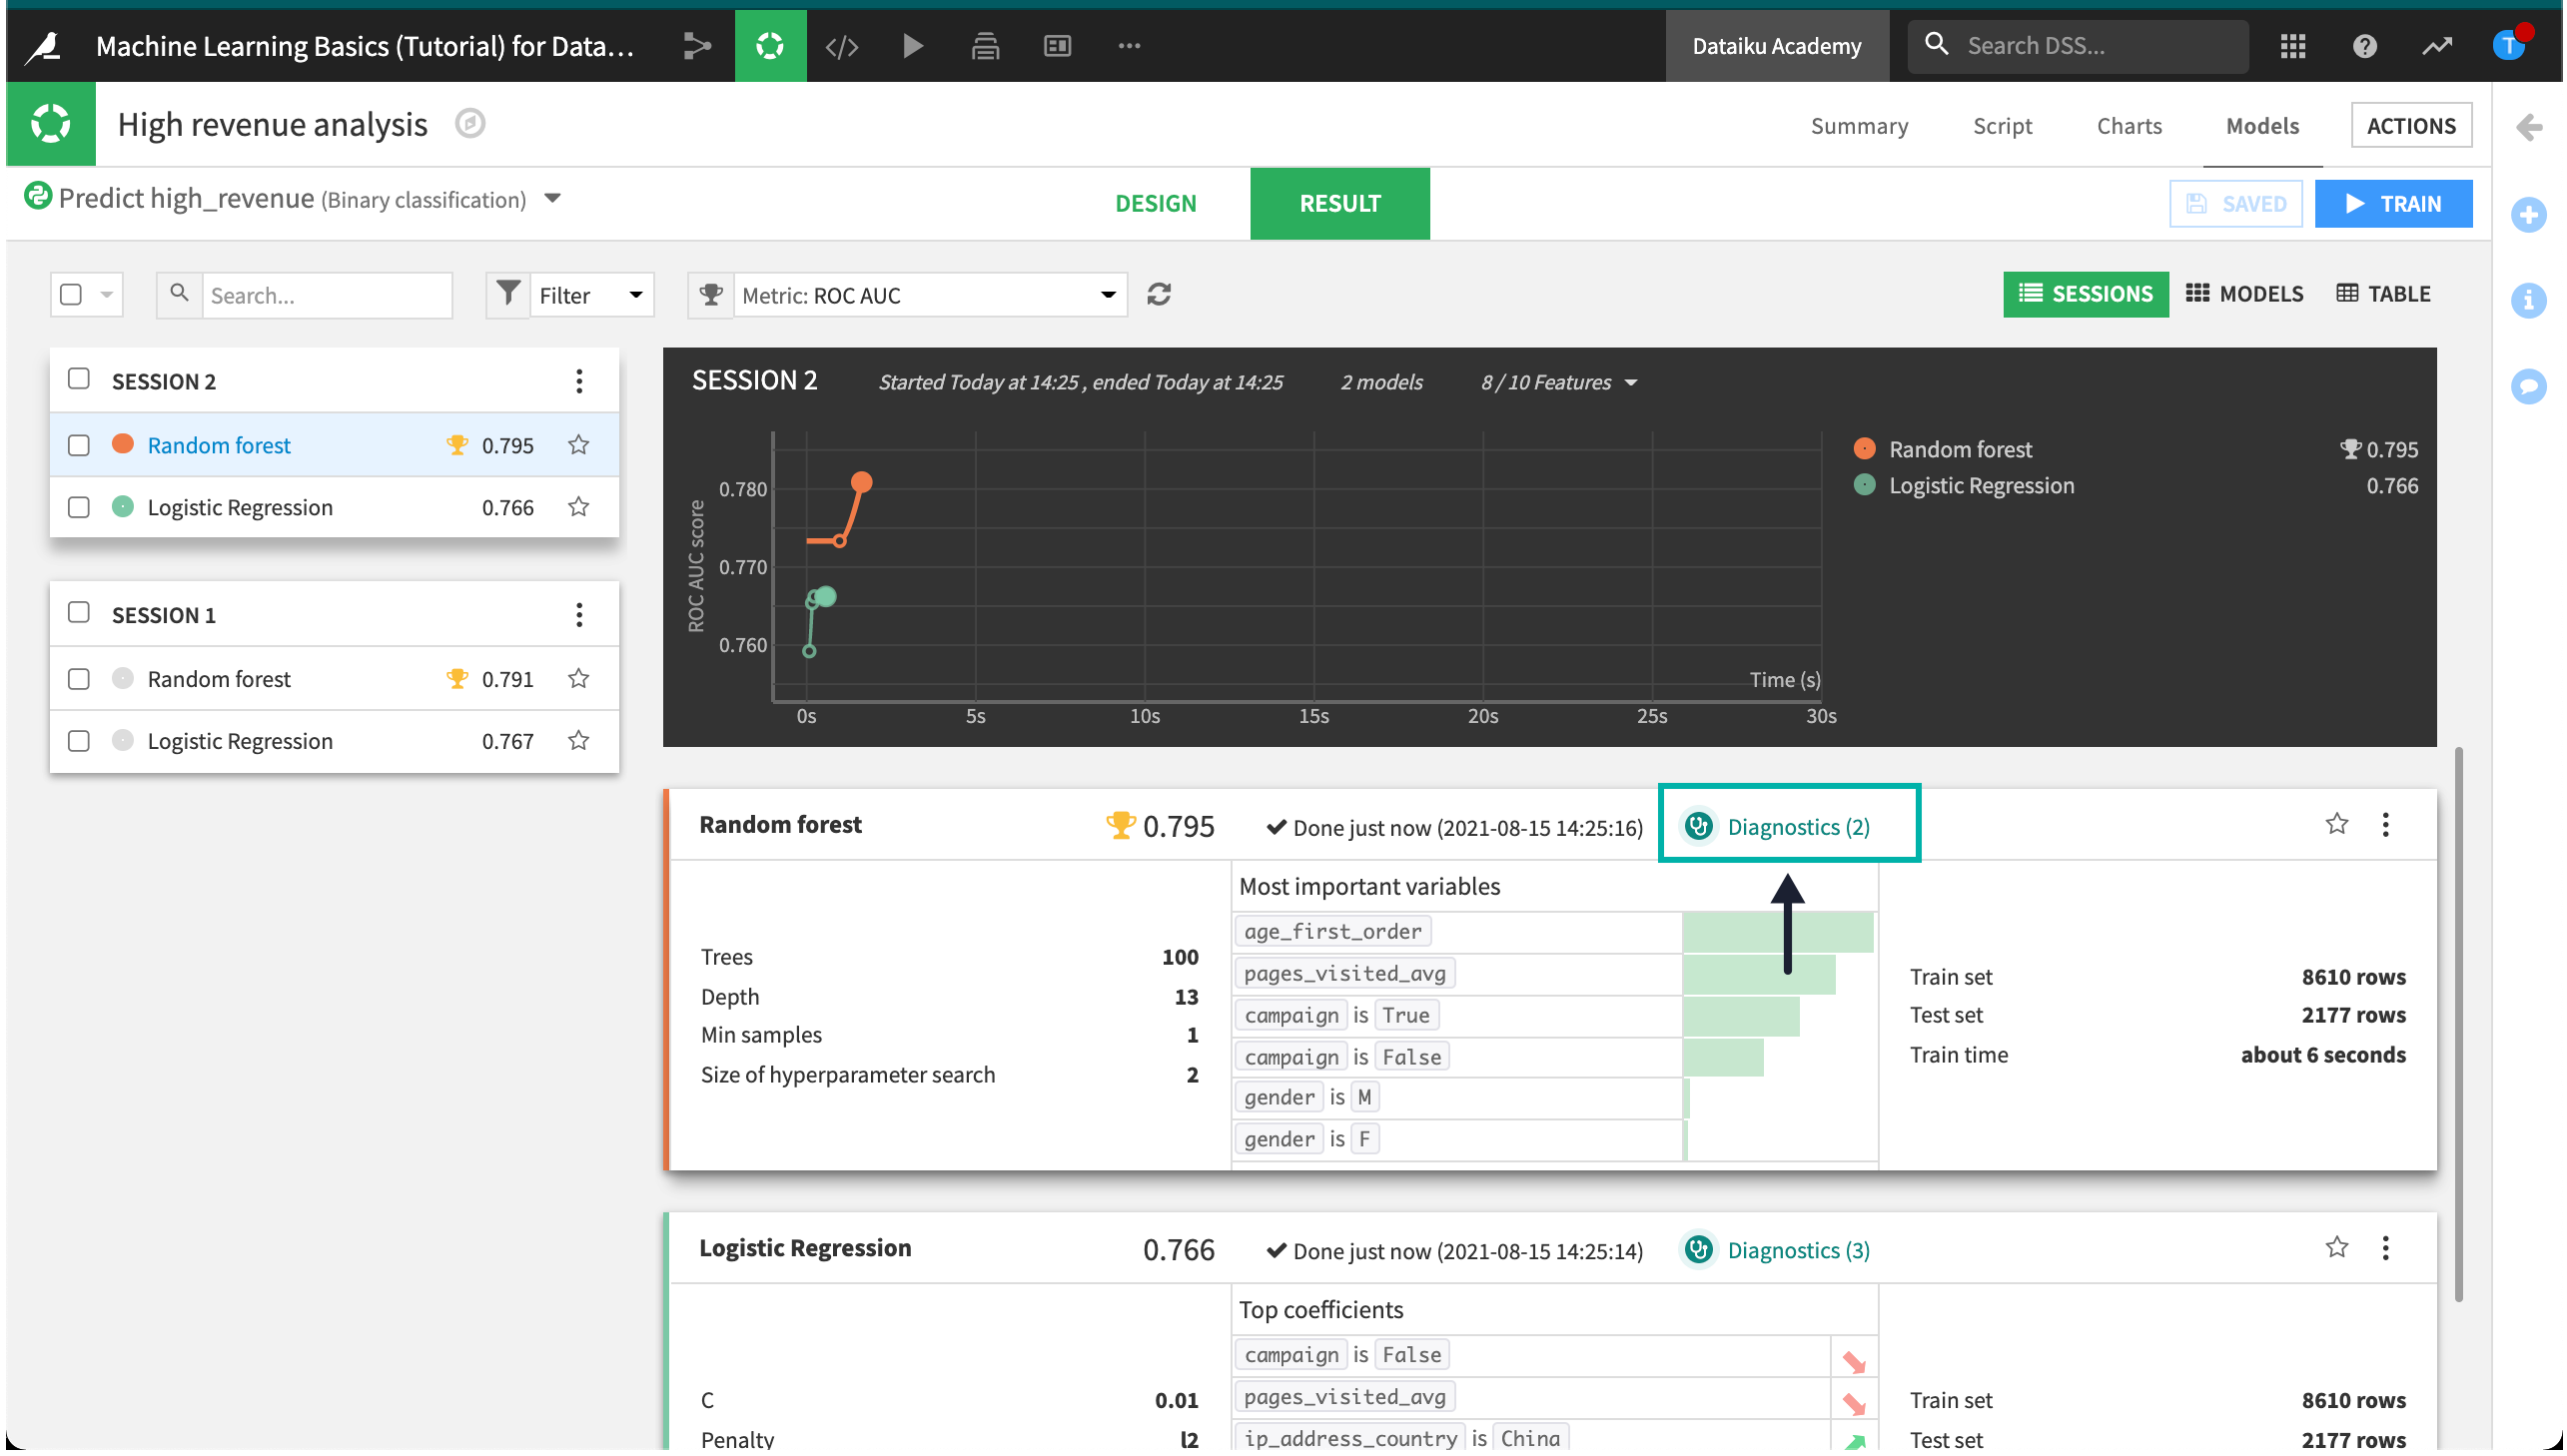
Diagnostics
When training is complete, we can go directly to ML diagnostics.
Click on Diagnostics in the Result tab of the random forest model to view the results of the ML diagnostics checks.
Dataiku DSS displays Model Information > Training information. Here, we can view warnings and get advice to avoid common pitfalls, including if a feature has a suspiciously high importance - which could be due to a data leak or overfitting.
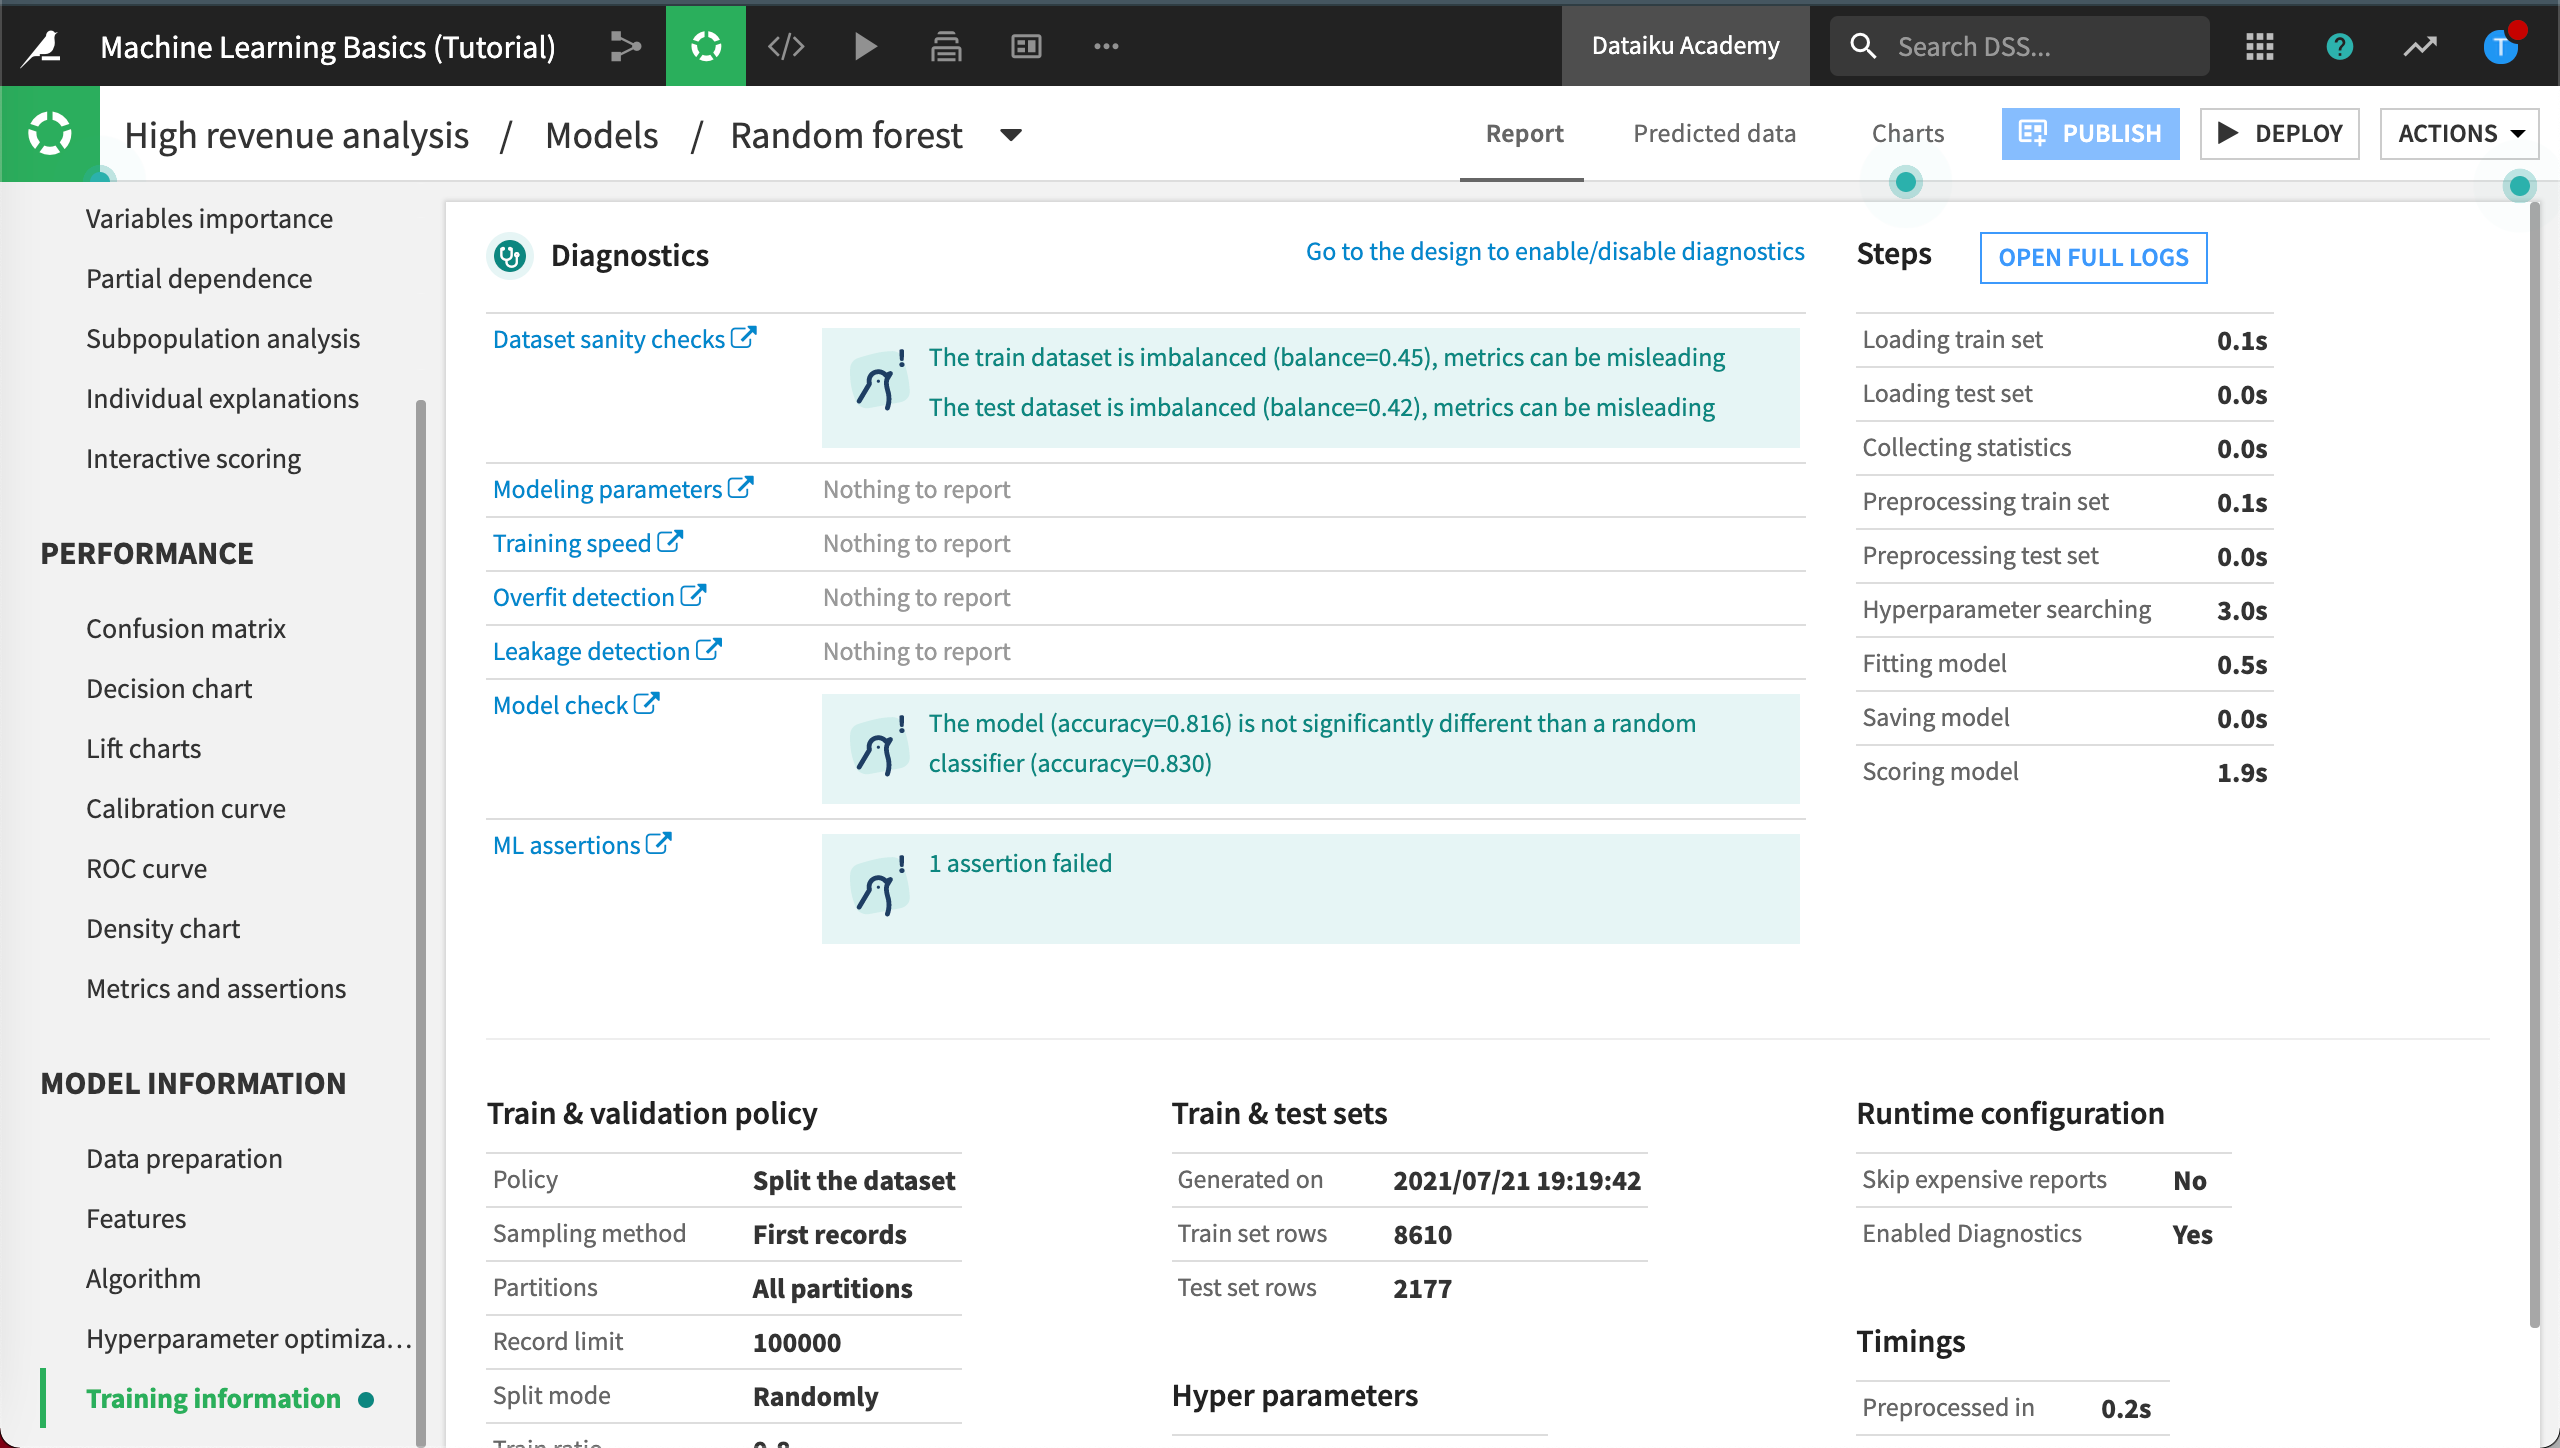
This is like having a second set of eyes that provide warning and advice, so that you can identify and correct these issues when developing the model.
Metrics and Assertions
Now we can find out if our ML assertion check passed or failed.
Click Metrics and assertions in the Performance section.
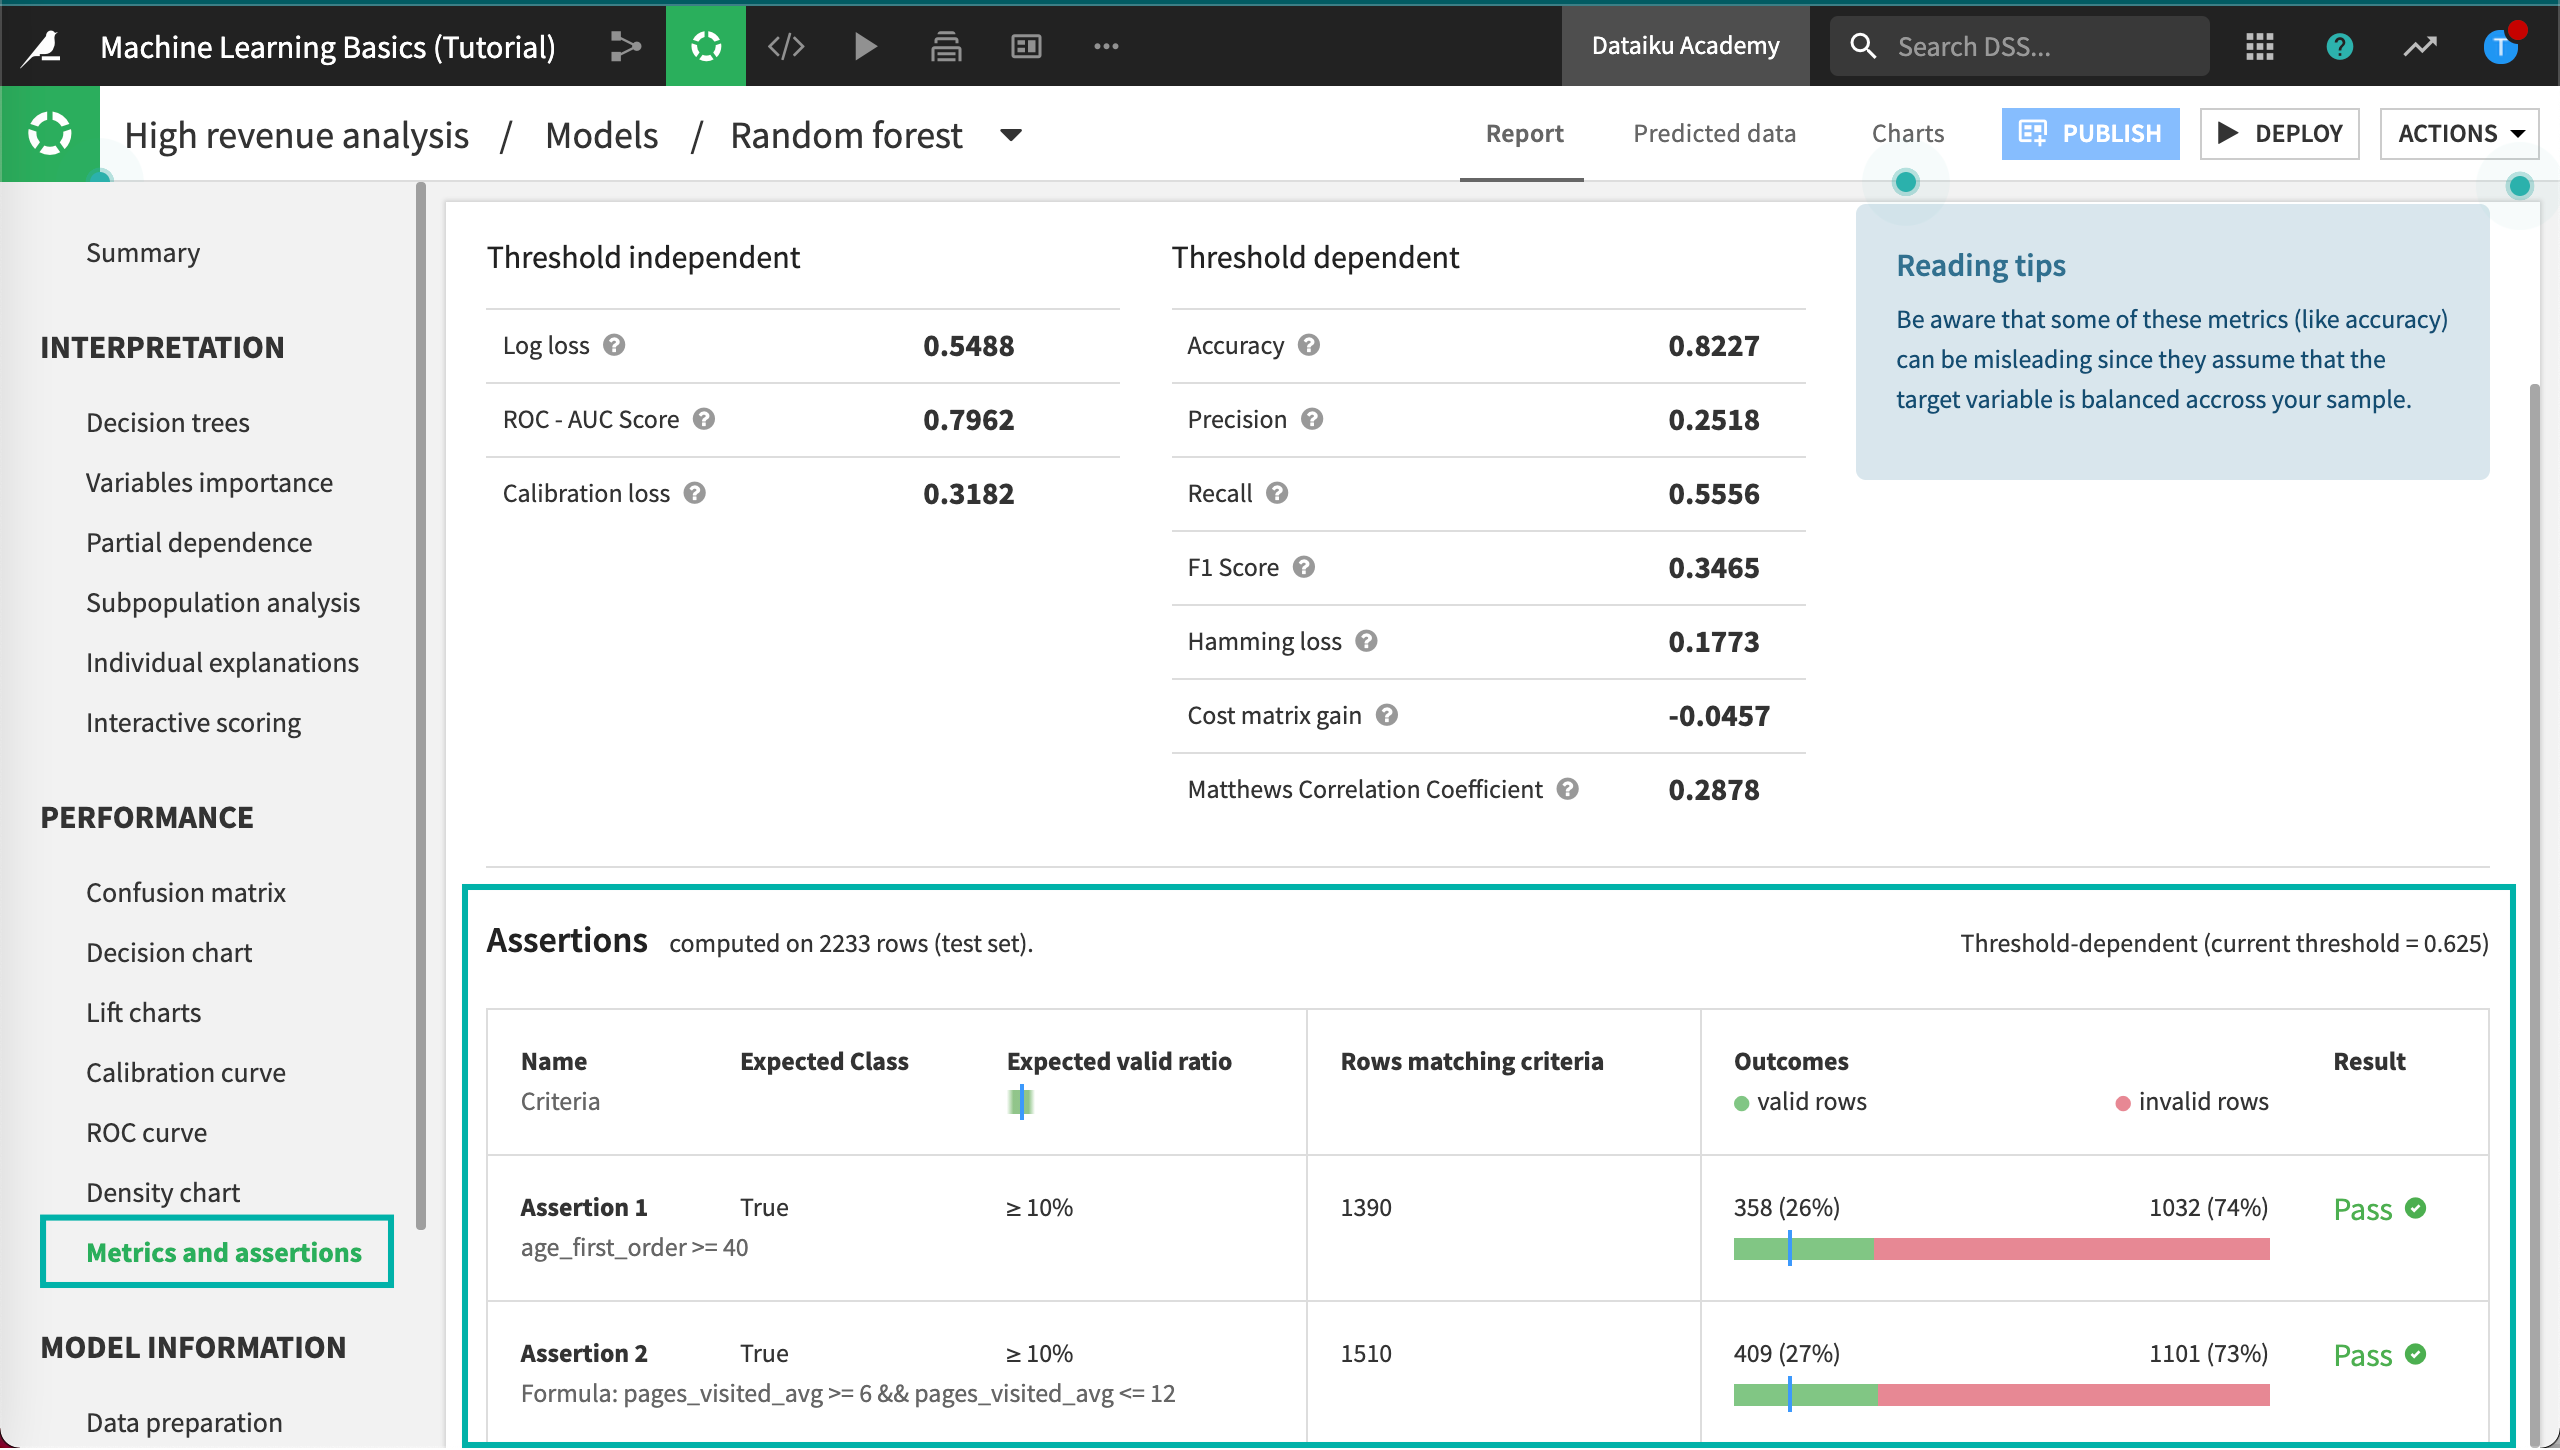
Dataiku DSS displays the results of the assertion check. We can see whether or not our assertion checks passed, the number of rows matching the criteria, along with the percentage of valid rows.
Variables Importance
Finally, let’s look at the Variables importance chart for the latest model.
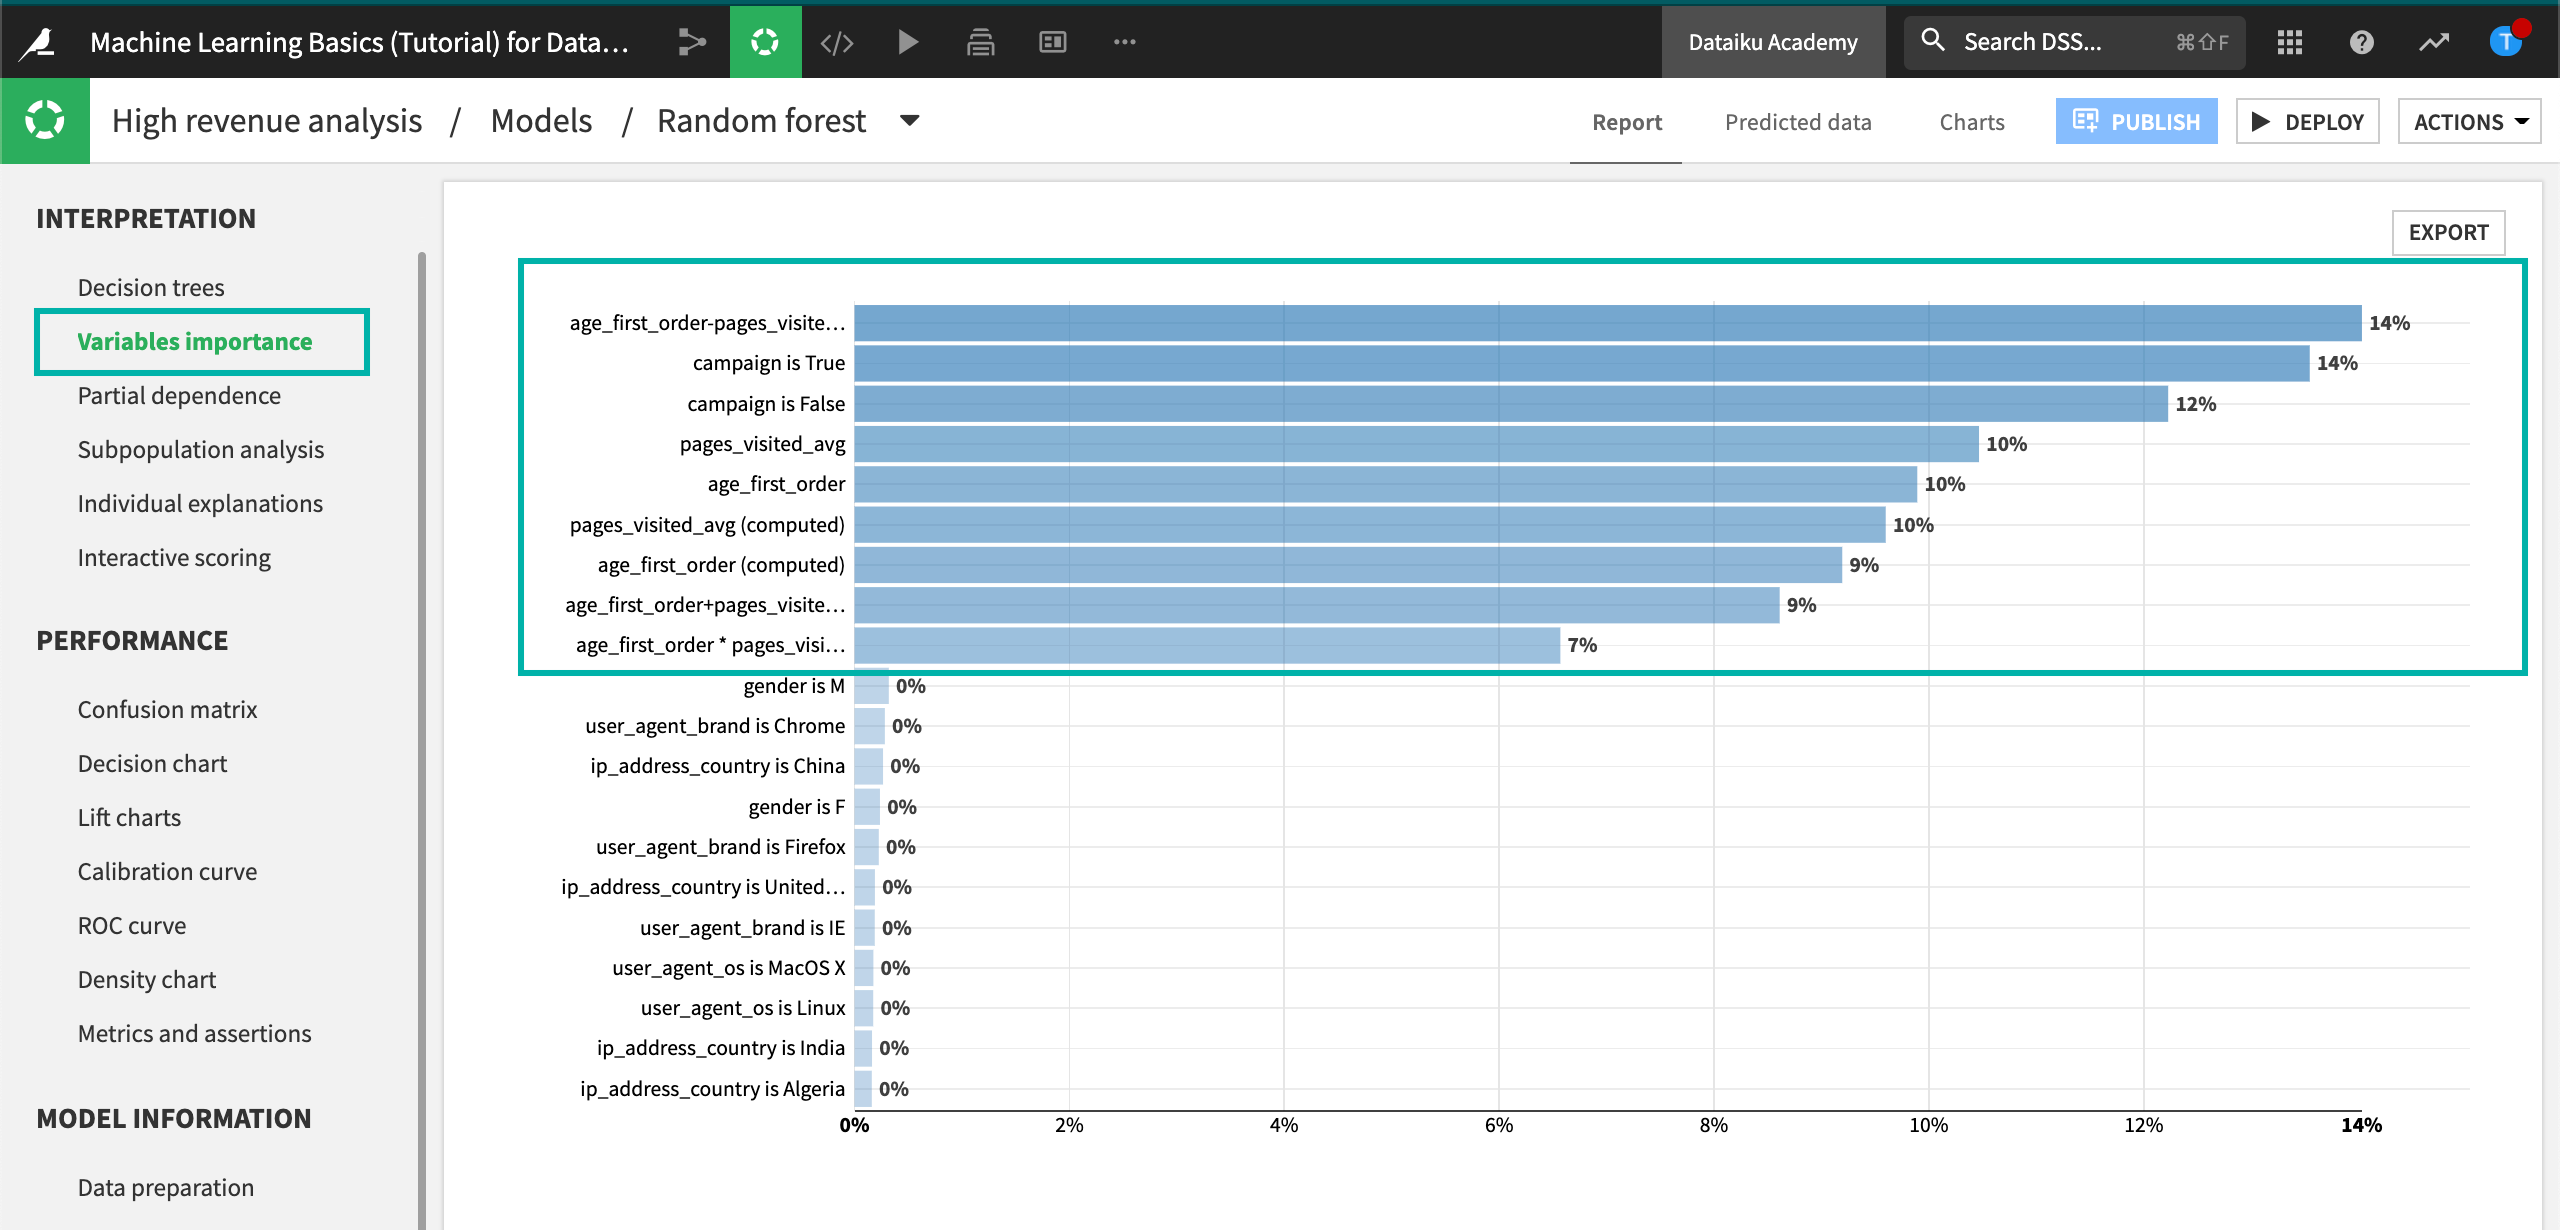
Click Variables importance in the Interpretation section.
We can see that the importance is spread across the campaign variable along with the features automatically generated from age_first_order and pages_visited_avg. The generated features may have uncovered some previously hidden relationships.
Note
You might find that your actual results are different from those shown. This is due to differences in how rows are randomly assigned to training and testing samples.
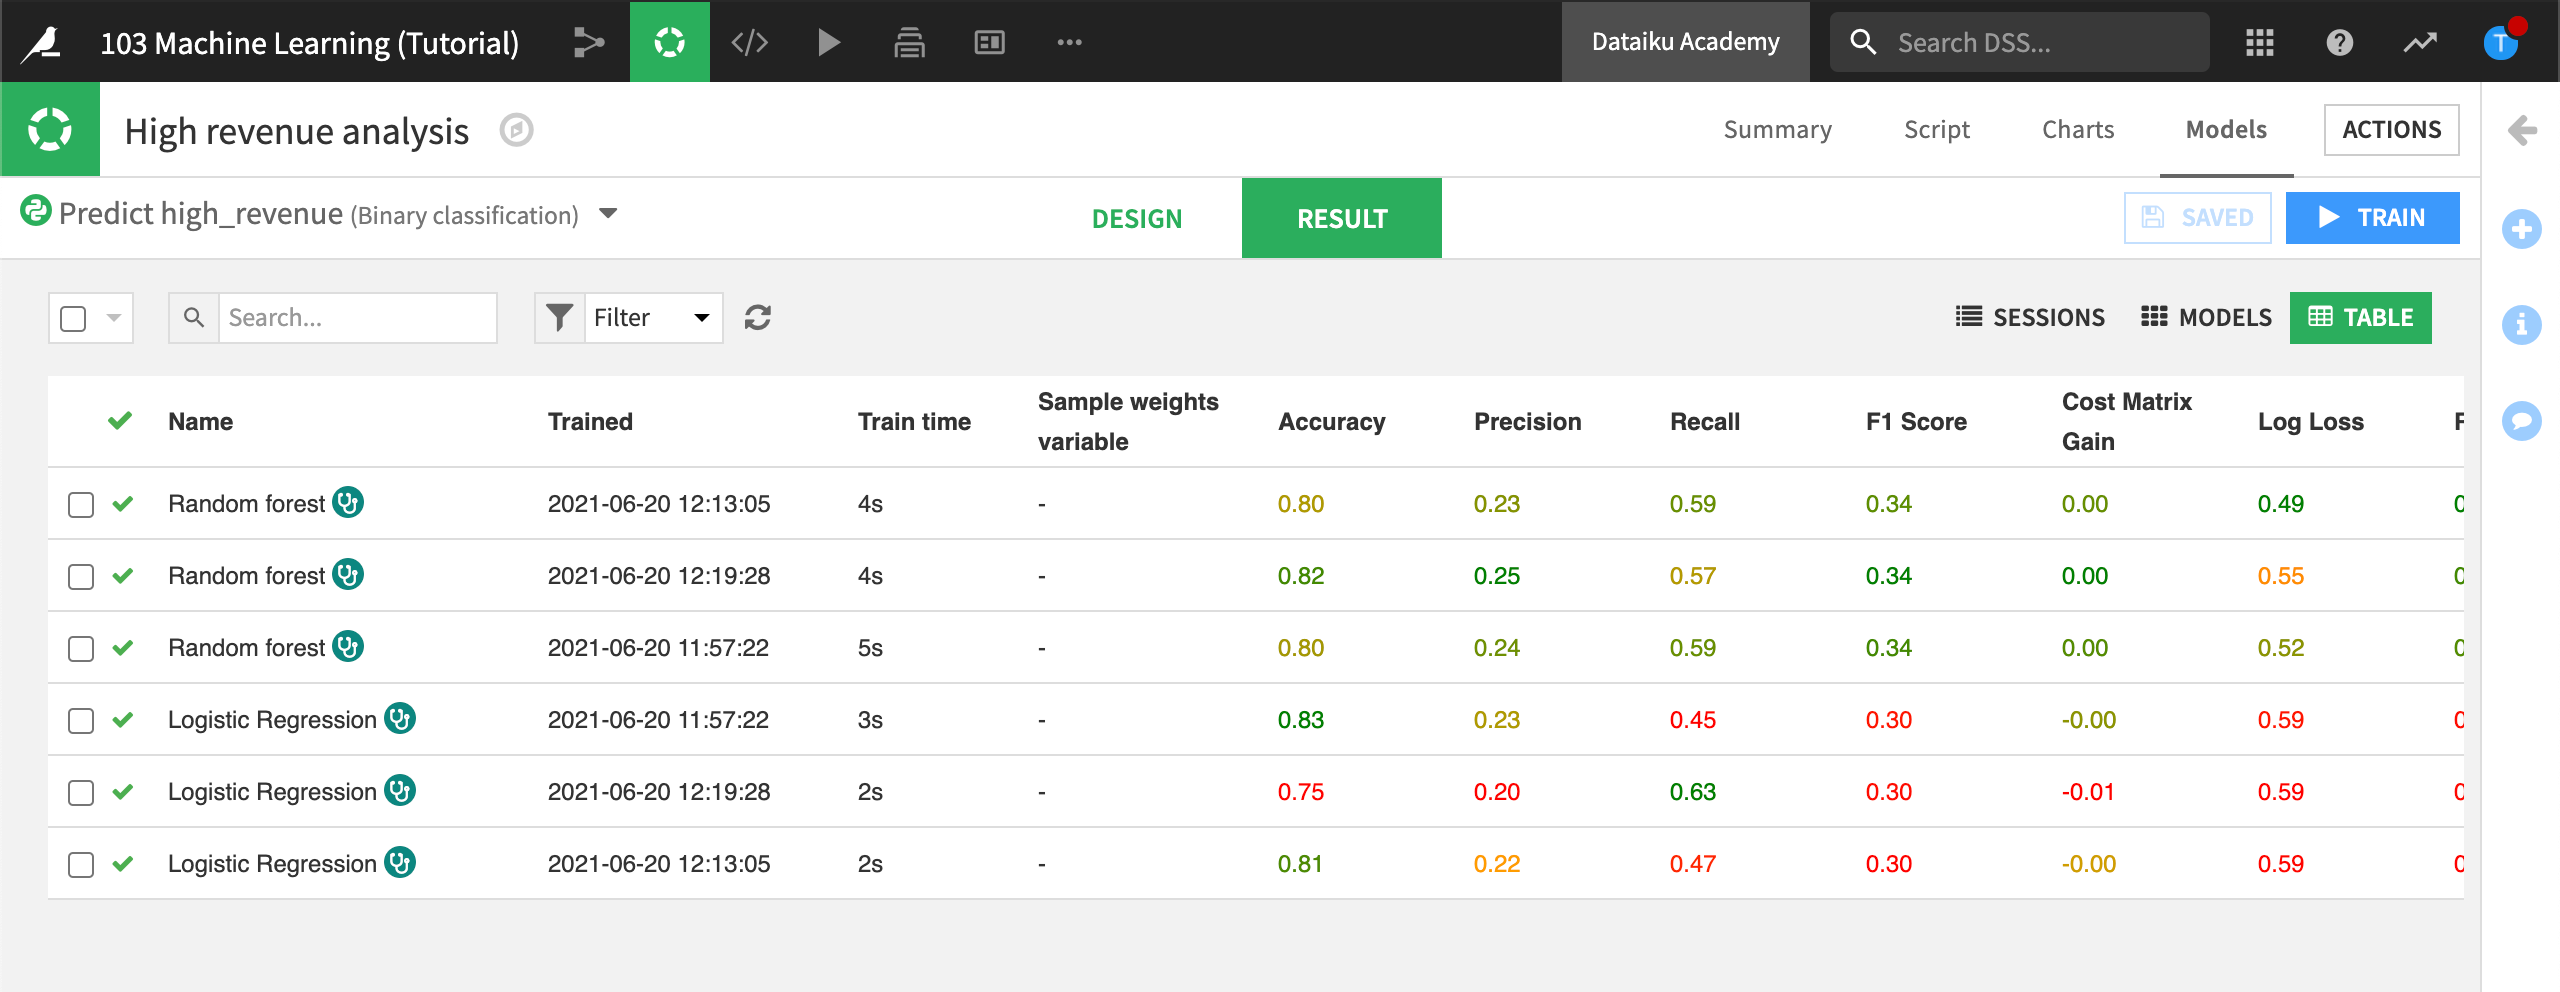
Table View
Now that you have trained several models, all the results may not fit your screen. To see all your models at a glance, you can return to the Result tab, then switch to the Table view. You can sort the Table view on any column, such as ROC AUC.
What’s Next?
Congratulations, you just built, evaluated, and tuned your first predictive model using DSS!
How do we know, however, if this model to predict high revenue customers is biased? Is it performing similarly for male and female customers, for example?
In the next section on Explainable AI, we’ll spend more time trying to understand and interpret the model’s predictions.