FX P&L Impact Modeling
Overview
Business Case
Multinational corporations need to consolidate revenue generated in multiple currencies into a single reported currency. The converted revenue is the basis of many other processes from setting future budgets to defining revenue targets and ultimately taking strategic decisions for the company. Therefore, understanding how reported revenue was calculated and how sensitive it is to foreign exchange (FX) rate assumptions is essential.
FX rate differences can have major impacts on reported revenue. Different lines of businesses inside the same company may use distinct sources to run the conversions, depending on the choice of granularity and type of aggregation. Knowing the impact of these choices is crucial to making informed decisions, for example by covering some of the risk through FX derivatives, or by adjusting internally used (‘budget’) FX rates to more appropriately reflect business performance. This template Solution shows how Dataiku can efficently managed and productionize this important analysis.
Technical Requirements
To leverage this solution, you must meet the following requirements:
Have access to a DSS 10.0+ instance.
A Python 3.6+ code environment named
solution_fx-impactwith the following required packages:
dash==2.3.1
dash_bootstrap_components==1.0
Note
When creating a new code environment, please be sure to use the name solution_fx-impact or remapping will be required.
Installation
If the technical requirements are met, this solution can be installed in one of two ways:
On your Dataiku instance click + New Project > Industry solutions > Finance Teams > FX P&L Impact Modeling.
Download the .zip project file and upload it directly to your Dataiku instance as a new project.
Data Requirements
Four datasets are required for the solution
input_sales_actual that includes historical sales figures allocated by geography and contains the 4 columns
date: each figure is reported daily
country: the country where the sales were booked
currency: the ISO code for the currency associated with the sales figure
revenue_local: the revenue generated, in local currency
input_sales_forecast which shows future sales estimates and should contain the same columns as input_sales_actual
fx_rate_forecast rates which are perhaps sourced externally or from another team and contains the 4 columns
date
local_currency
reported_currency
fx_rate
budget_fx_rate the specified rates for business planning that should contain the same columns as fx_rate_forecast
Workflow Overview
You can follow along with the solution in the Dataiku gallery.
The project has the following high-level steps:
Configure the project with our own data and adjustments via the Dataiku Application
Clean and prepare our sales data
Import, identify and integrate FX rates
Combine historic and forecasted FX rates to generate the Booking rates.
Compute the FX impact on sales revenue.
Visualize FX rates, Revenues, and Revenue Differences, and conduct What-If Analysis with an Interactive Dashboard
Walkthrough
Note
In addition to reading this document, it is recommended to read the wiki of the project before beginning in order to get a deeper technical understanding of how this solution was created, the different types of data enrichment available, longer explanations of solution-specific vocabulary, and suggested future direction for the solution.
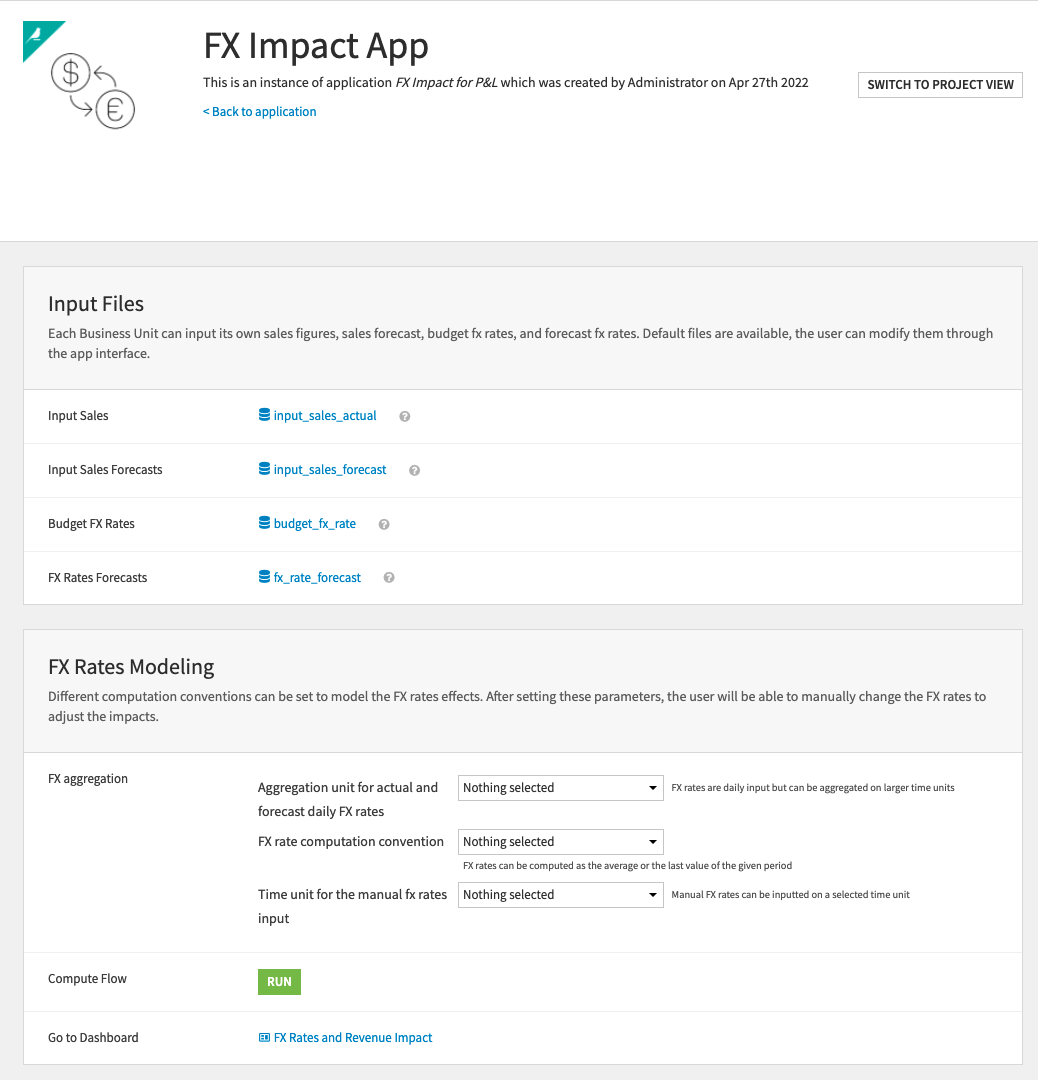
Tailor the Project to Our Own Needs
To begin, you will need to create a new instance of the FX P&L Impact Modeling Application. This can be done by selecting the Dataiku Application from your instance home, and clicking Create App Instance. The project is delivered with sample data that should be replaced with our own sales and FX data. This can be done by clicking on each dataset in the Input Files section of the Dataiku application and uploading our own data. In a more advanced setup, input data could come from wherever our data is stored (e.g. a SQL database) and we could configure our table connections here.
In the FX Rates Modeling section of the Dataiku Application, we can set some parameters which will influence how the flow is built and, therefore, our final outputs. The parameters that can be set here are:
The aggregation unit for actual and forecast rates, chosen from a preset list of possible units (Daily, Weekly, Monthly, Quarterly, or Yearly)
FX Rate computation convention (i.e. whether to compute FX rates as the last value of the period or the average across the period)
Time unit for Manual Input FX Rates to be chosen from a preset list of possible units containing Fixed (i.e., one FX rate for the whole period), Daily, Weekly, Monthly, Quarterly, or Yearly.
This can be different from the time unit for actual and forecast rates.
Once our parameters have been set to our liking, we can click the run button which will build the entire flow with our data and chosen parameters. Once the build has successfully completed, we see the updated visualizations by clicking the Report button. Multiple Application instances can be created - each with its own distinct data and/or parameters. If you’re interested in what is happening “under the hood” of the Dataiku Application you can continue to the next few sections. If not, please feel free to skip to the section detailing the Solution’s Dashboard.
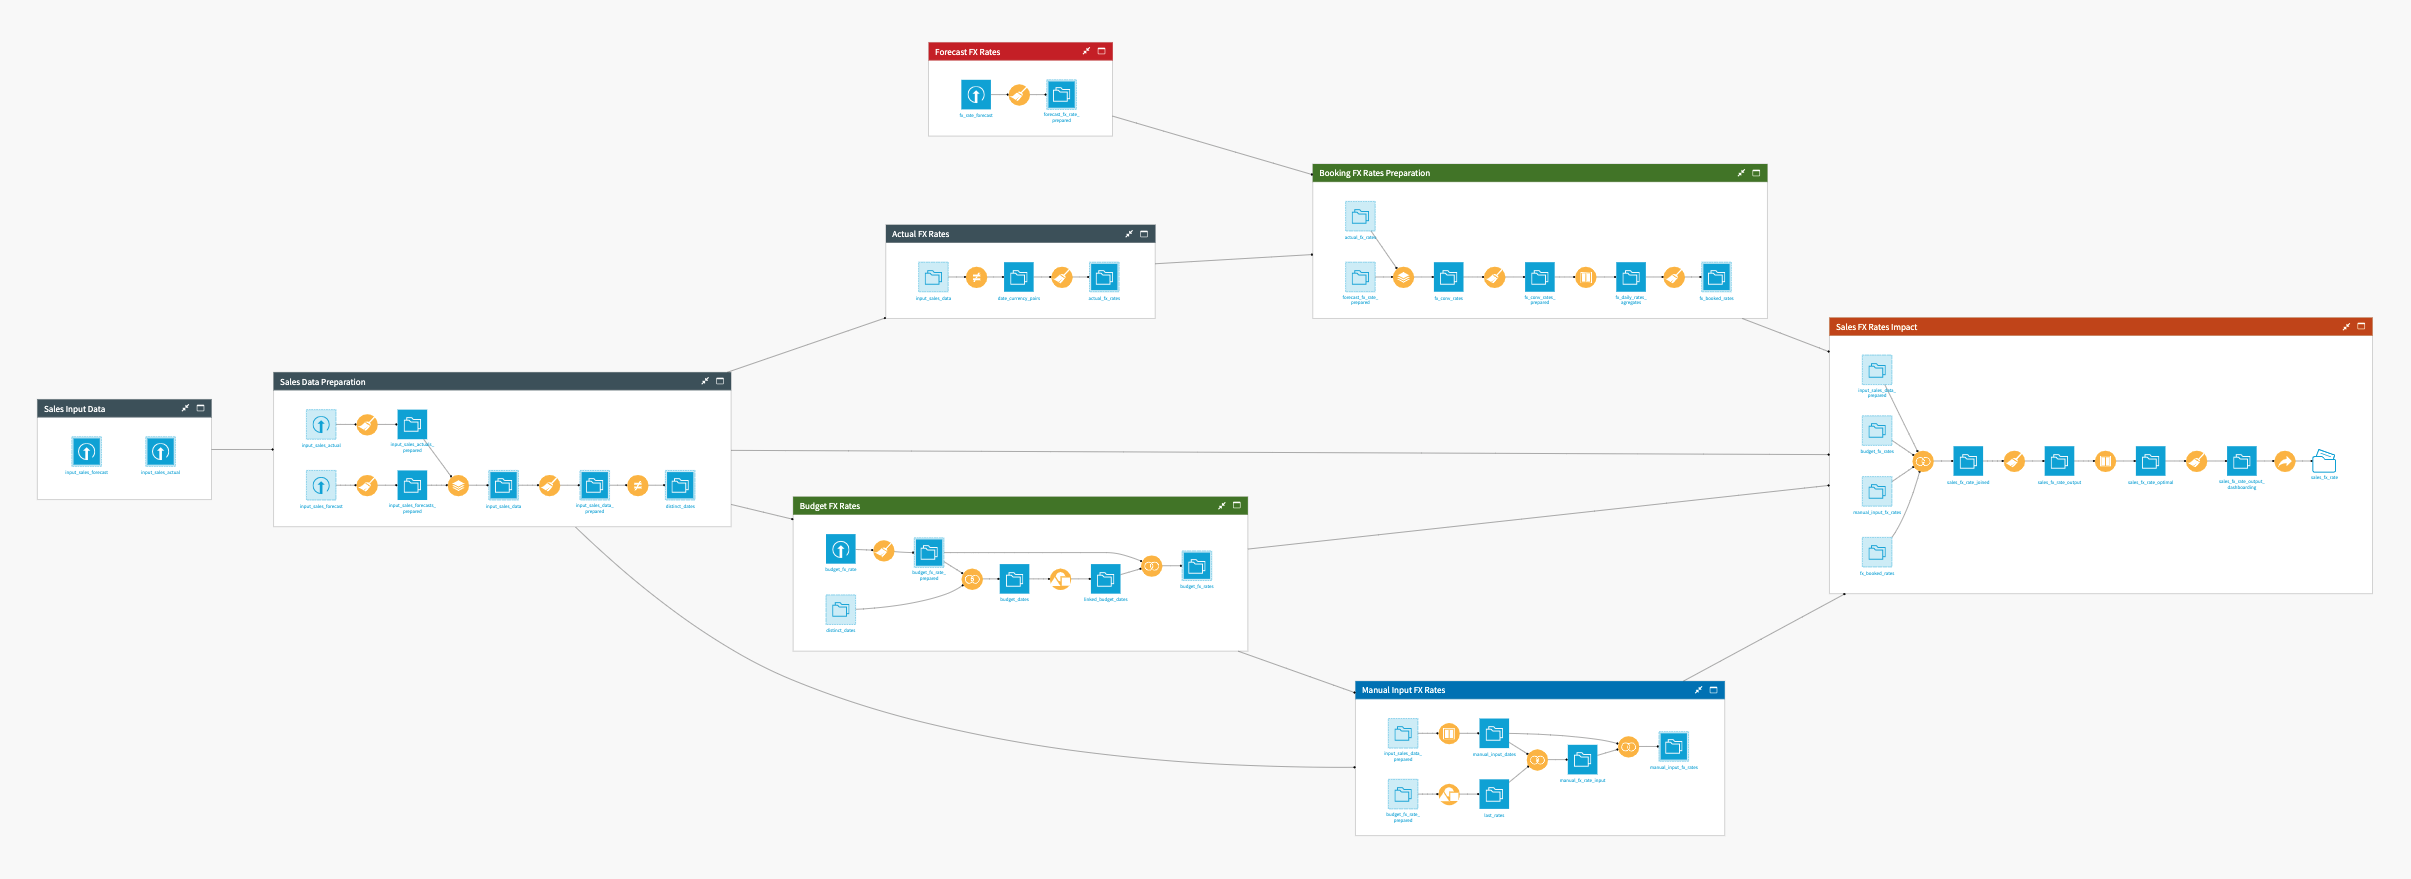
Cleaning and Preparing our Sales Data
Our goal in the Sales Data Preparation zone is to create three output datasets from our actual and forecasted sales (input_sales_actual and input_sales_forecast) which will be used later in our flow. To do this we begin by parsing the dates in both datasets via a prepare recipe. Then we stack the resulting prepared datasets while simultaneously adding a 5th column which indicates whether the row is an actual or forecasted figure. This stack gives us our first dataset to be used downstream, input_sales_data, which will be used in the Actual FX Rates flow zone. Still, in our Preparation zone, we apply a prepare recipe that expands the date column into various levels of granularity (year, month, week), and creates a quarter column. These columns will be necessary to handle the groupings and join on different granularities later. The resulting dataset input_sales_data_prepared is later used in the Manual Input FX Rates flow zone. Lastly, we use a Distinct recipe to output all the distinct dates of the sales dataset to the distinct_dates dataset. We will be finding FX rates for those dates in the Budget FX Rates zone.
Identifying Multiple FX Rates
There are 5 flow zones involved with the identification and preparation of FX rates that are necessary in order to compute the impact of FX rates on our sales data. We’ll begin with the Forecast FX Rates flow zone which starts with the required input dataset fx_rate_forecast being uploaded. These forecasted FX rates are user inputs and allow us to see the impact of our “forecasted” rates versus those rates that have been specified for business planning purposes. We apply a prepare recipe to parse the dates of this dataset after they are uploaded.
Moving along to the Actual FX Rates flow zone, we pull in the input_sales_data dataset that we created previously and apply a distinct recipe in order to generate unique pairs of currency and date. With a prepare recipe, we then incorporate the reported currency (which is USD in this project) into the process. FX rates are also pulled by setting a column with a constant value of one and using the conversion processor to convert the value from the given local currency to the reported currency. The rates used for this conversion are European Central Bank daily settlement rates and include around 40 currencies.
The final datasets from the Actual FX Rates and Forecast FX Rates flow zones are passed along to the Booking FX Rates Preparation Flow Zone where they are stacked together and an additional column is added to indicate the origin of the data for each row (like we did when we stacked actual and forecasted sales). The following recipe extracts date components from the date column and creates quarters. The window recipe uses the project variable variable_fx_rate_time_aggregation to determine at what granularity we compute the end of period and average FX rates for each currency. The final recipe of the flow zone applies the aggregation method we defined in the Dataiku Application which is stored as the variable_fx_rate_computation_convention project variable.
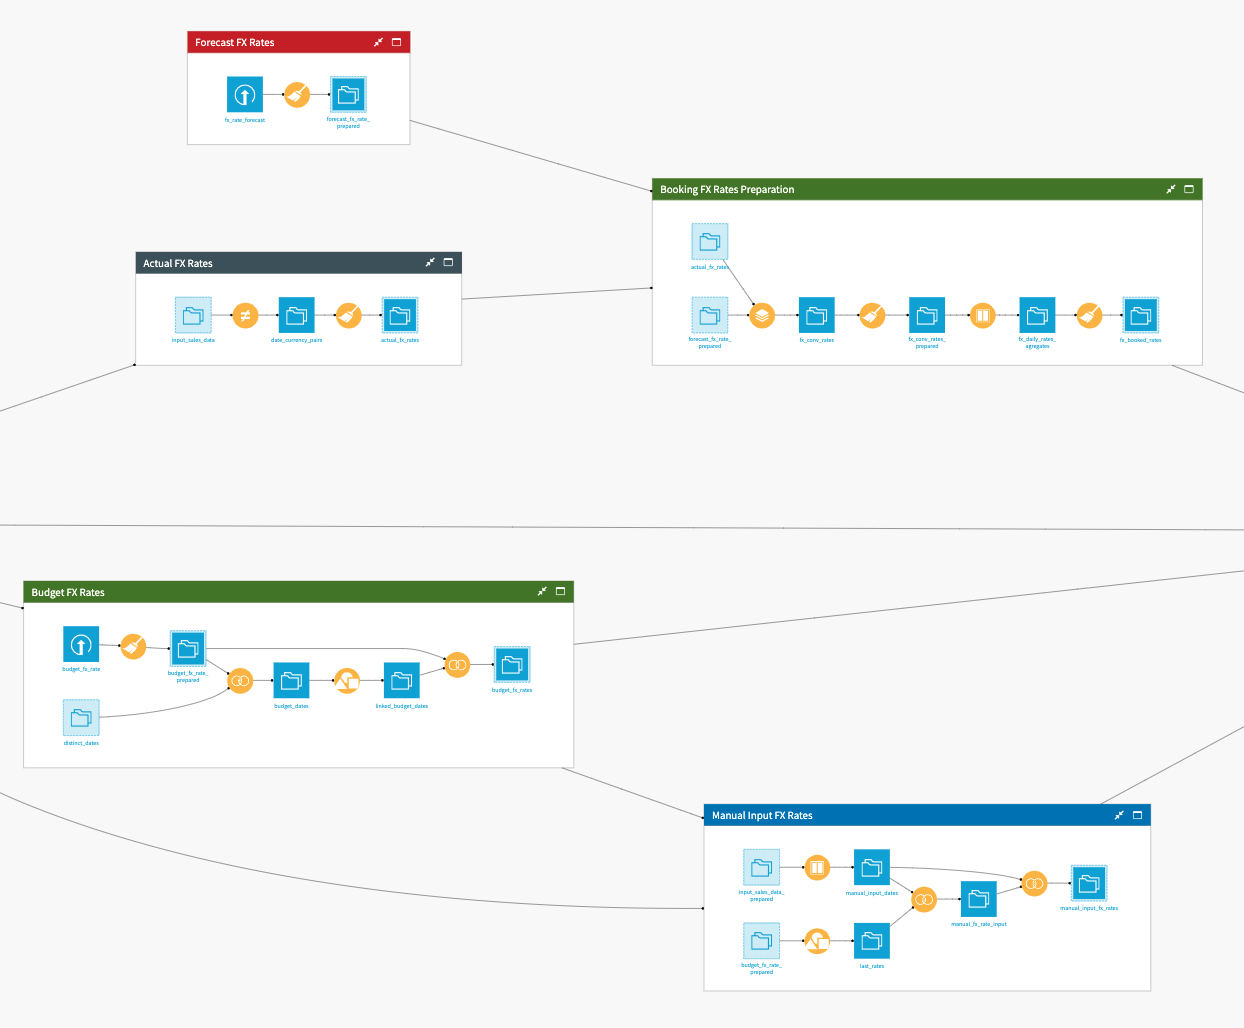
Moving to the lower branch of FX rate flow zones, the Budget FX Rates depends on two initial datasets: the distinct_dates dataset that we generated previously, and an uploaded budget_fx_rate dataset. We use a prepare recipe to parse dates in the budget_fx_rate dataset and join it to the distinct_dates dataset via a left join. We use the distinct dates and budget dates to join the two datasets but we also match all the rows where date >= budget_date. Therefore, for each distinct date, we will get all the budget dates that occur before it. In the following group recipe, we take the maximum budget date for each date which allows us to determine the applicable budget date corresponding to each distinct date from our sales. The final join is a simple matter of joining back the currencies and rates to the date and budget date pairs.
Lastly, the Manual Input FX Rates flow zone takes in two datasets as it’s input: budget_fx_rate_prepared (created in the Budget FX Rates flow zone) and input_sales_data_prepared (created in the Sales Data Preparation zone). A window recipe is applied to input_sales_data_prepared in order to compute the start date of each applicable rate period. The used granularity is defined in the Dataiku application. In parallel, we use a group recipe on budget_fx_rate_prepared to compute the last FX rate for each currency to act as the default value for the manual input FX rates. We then join these two resulting datasets by first filtering the date/currency dataset to only keep dates where we will need to input an FX rate. Then we join the default FX rate to give us the manual_fx_rate_input dataset. This dataset can be edited through the webapp embedded in the dashboard. Editing this dataset in the dashboard will cause all related visualizations to also change. Finally, we join this dataset back with our dataset of dates to relate our manually input FX rates to each date.
With all of our different FX rates properly identified, cleaned, and related to dates, we can compute the FX impact on sales revenue.
Compute the Impact of FX Rates on Revenue and Expense
The first step of the Sales FX Rates Impact flow zone is to join input_sales_data_prepared, budget_fx_rates, manual_input_fx_rates, and fx_booked_rates. In our previous flow zones, we intentionally created these datasets in such a way that they all have the same size to make joining possible and easy. Using a prepare recipe on the joined dataset, revenues are converted with each of the RX rates by multiplying the revenue in local currency by the FX rate. A subsequent window recipe computes the sum of revenue using the booking FX rate and the sum of local revenue for the specified manual input FX rate granularity. We do this so that we can then compute the ‘optimal’ manual FX rate which is the set of values for the manual input FX rates that leads to zero difference between the booking FX rate revenue and manual FX rate. We should use this optimal rate as a guide to finding potentially interesting values that is not required or necessary. Finally, we modify column names to be more human-readable for the dashboard and export the final dataset to an Excel format for easy access outside of Dataiku.
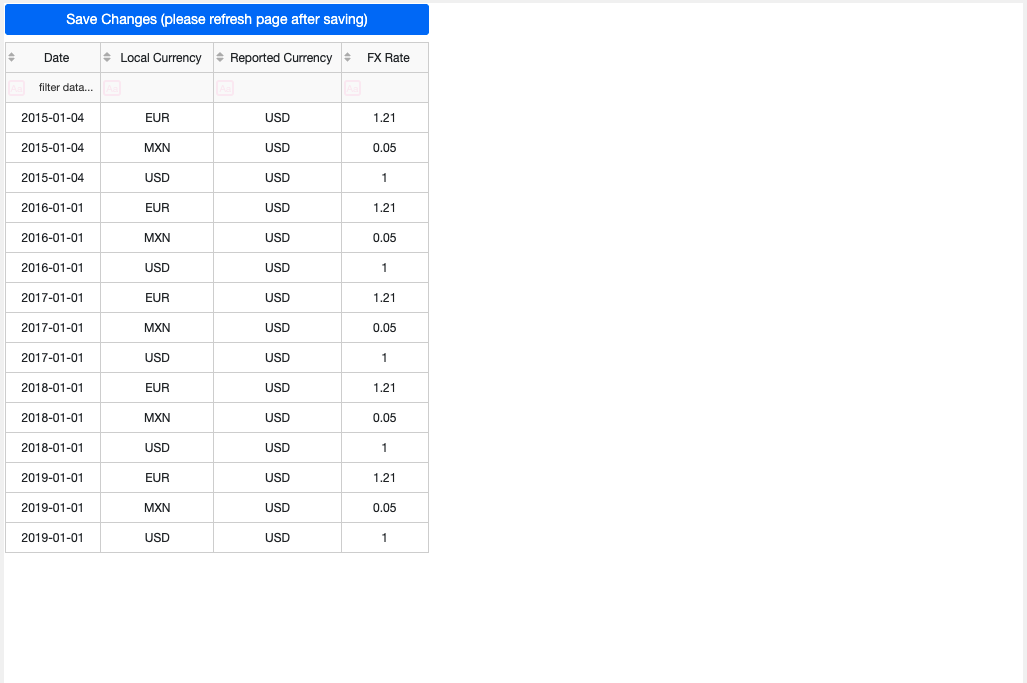
Visualize the Impact of FX Rates with an Interactive Dashboard
Our FX Rates and Revenue Impact Dashboard contains 3 tabs that can be used to Visualize FX rates, Revenues, and Revenue Differences. Dashboards can be exported in a PDF format for easy sharing outside of Dataiku.
Starting with the FX Rates tab, we have a global filter that will allow us to focus our visualizations on a specific period of time. All of the charts display 4 FX rates:
The reported/booked FX rates, which correspond to the actual FX rates
The manual input FX rates
The optimal FX rates, which flattens the difference between reported FX rates revenue and manual input FX rates revenue
The budget FX rates
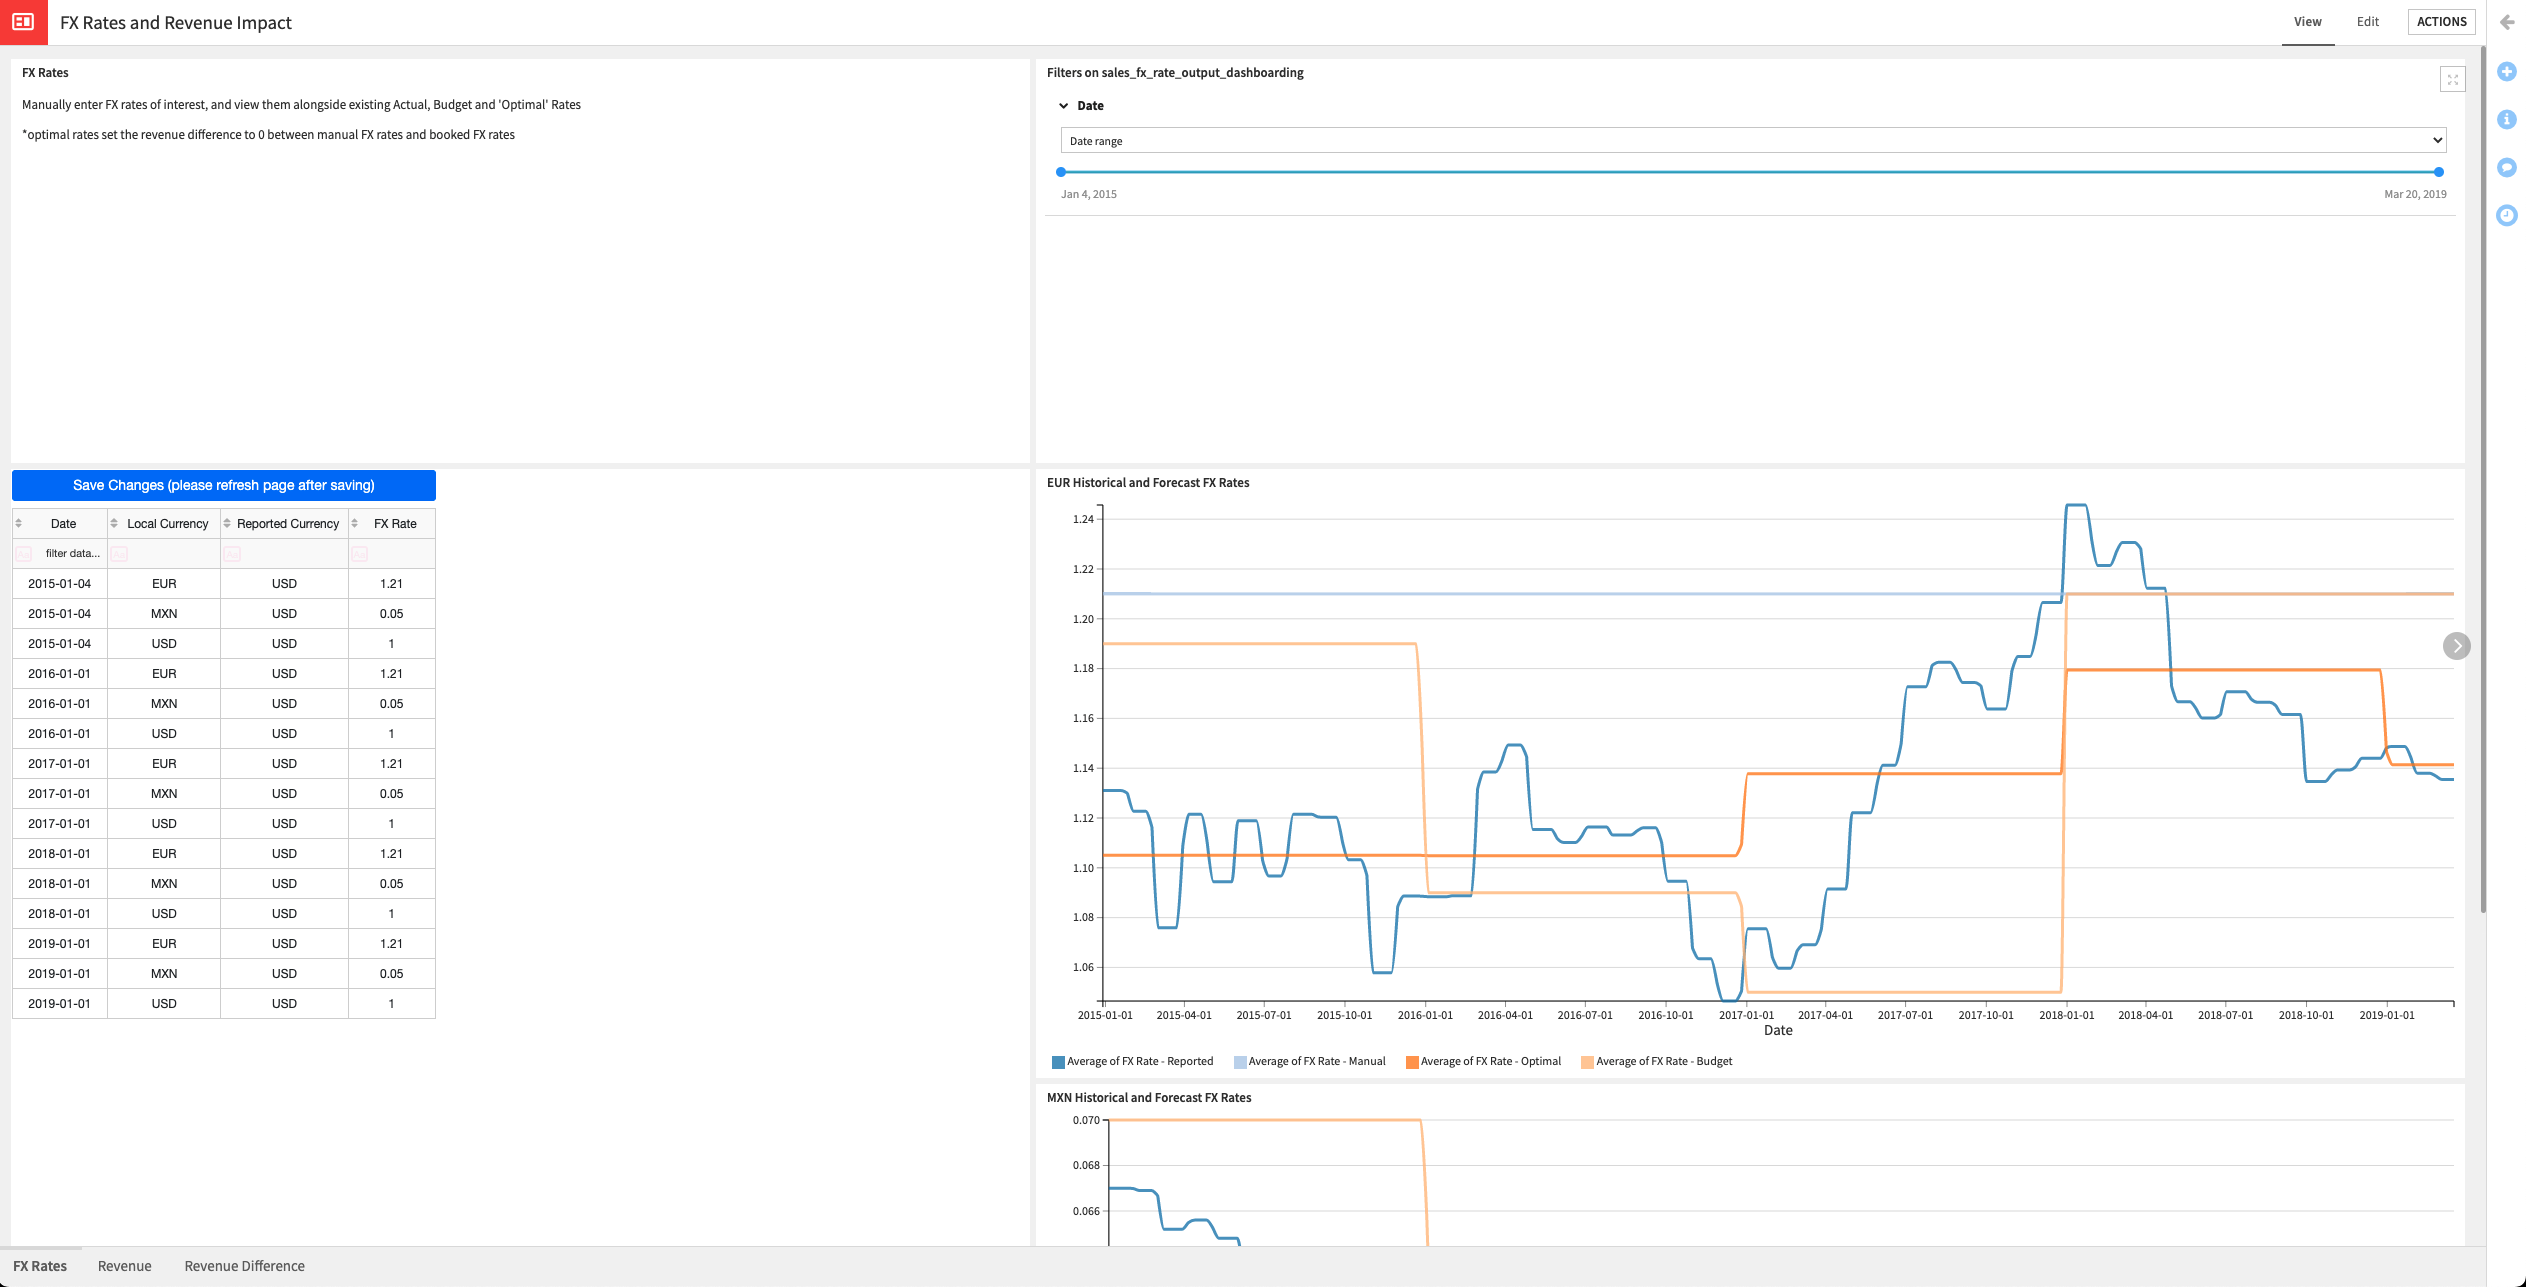
We can use the table on the left to edit the manual input FX rates to perform a What-If analysis. Columns can be sorted or filtered and any modification tests should be done by pressing the Save Changes button, and refreshing the page after the save finishes. Saving will also update graphs throughout our Dashboard as well as our Excel output.
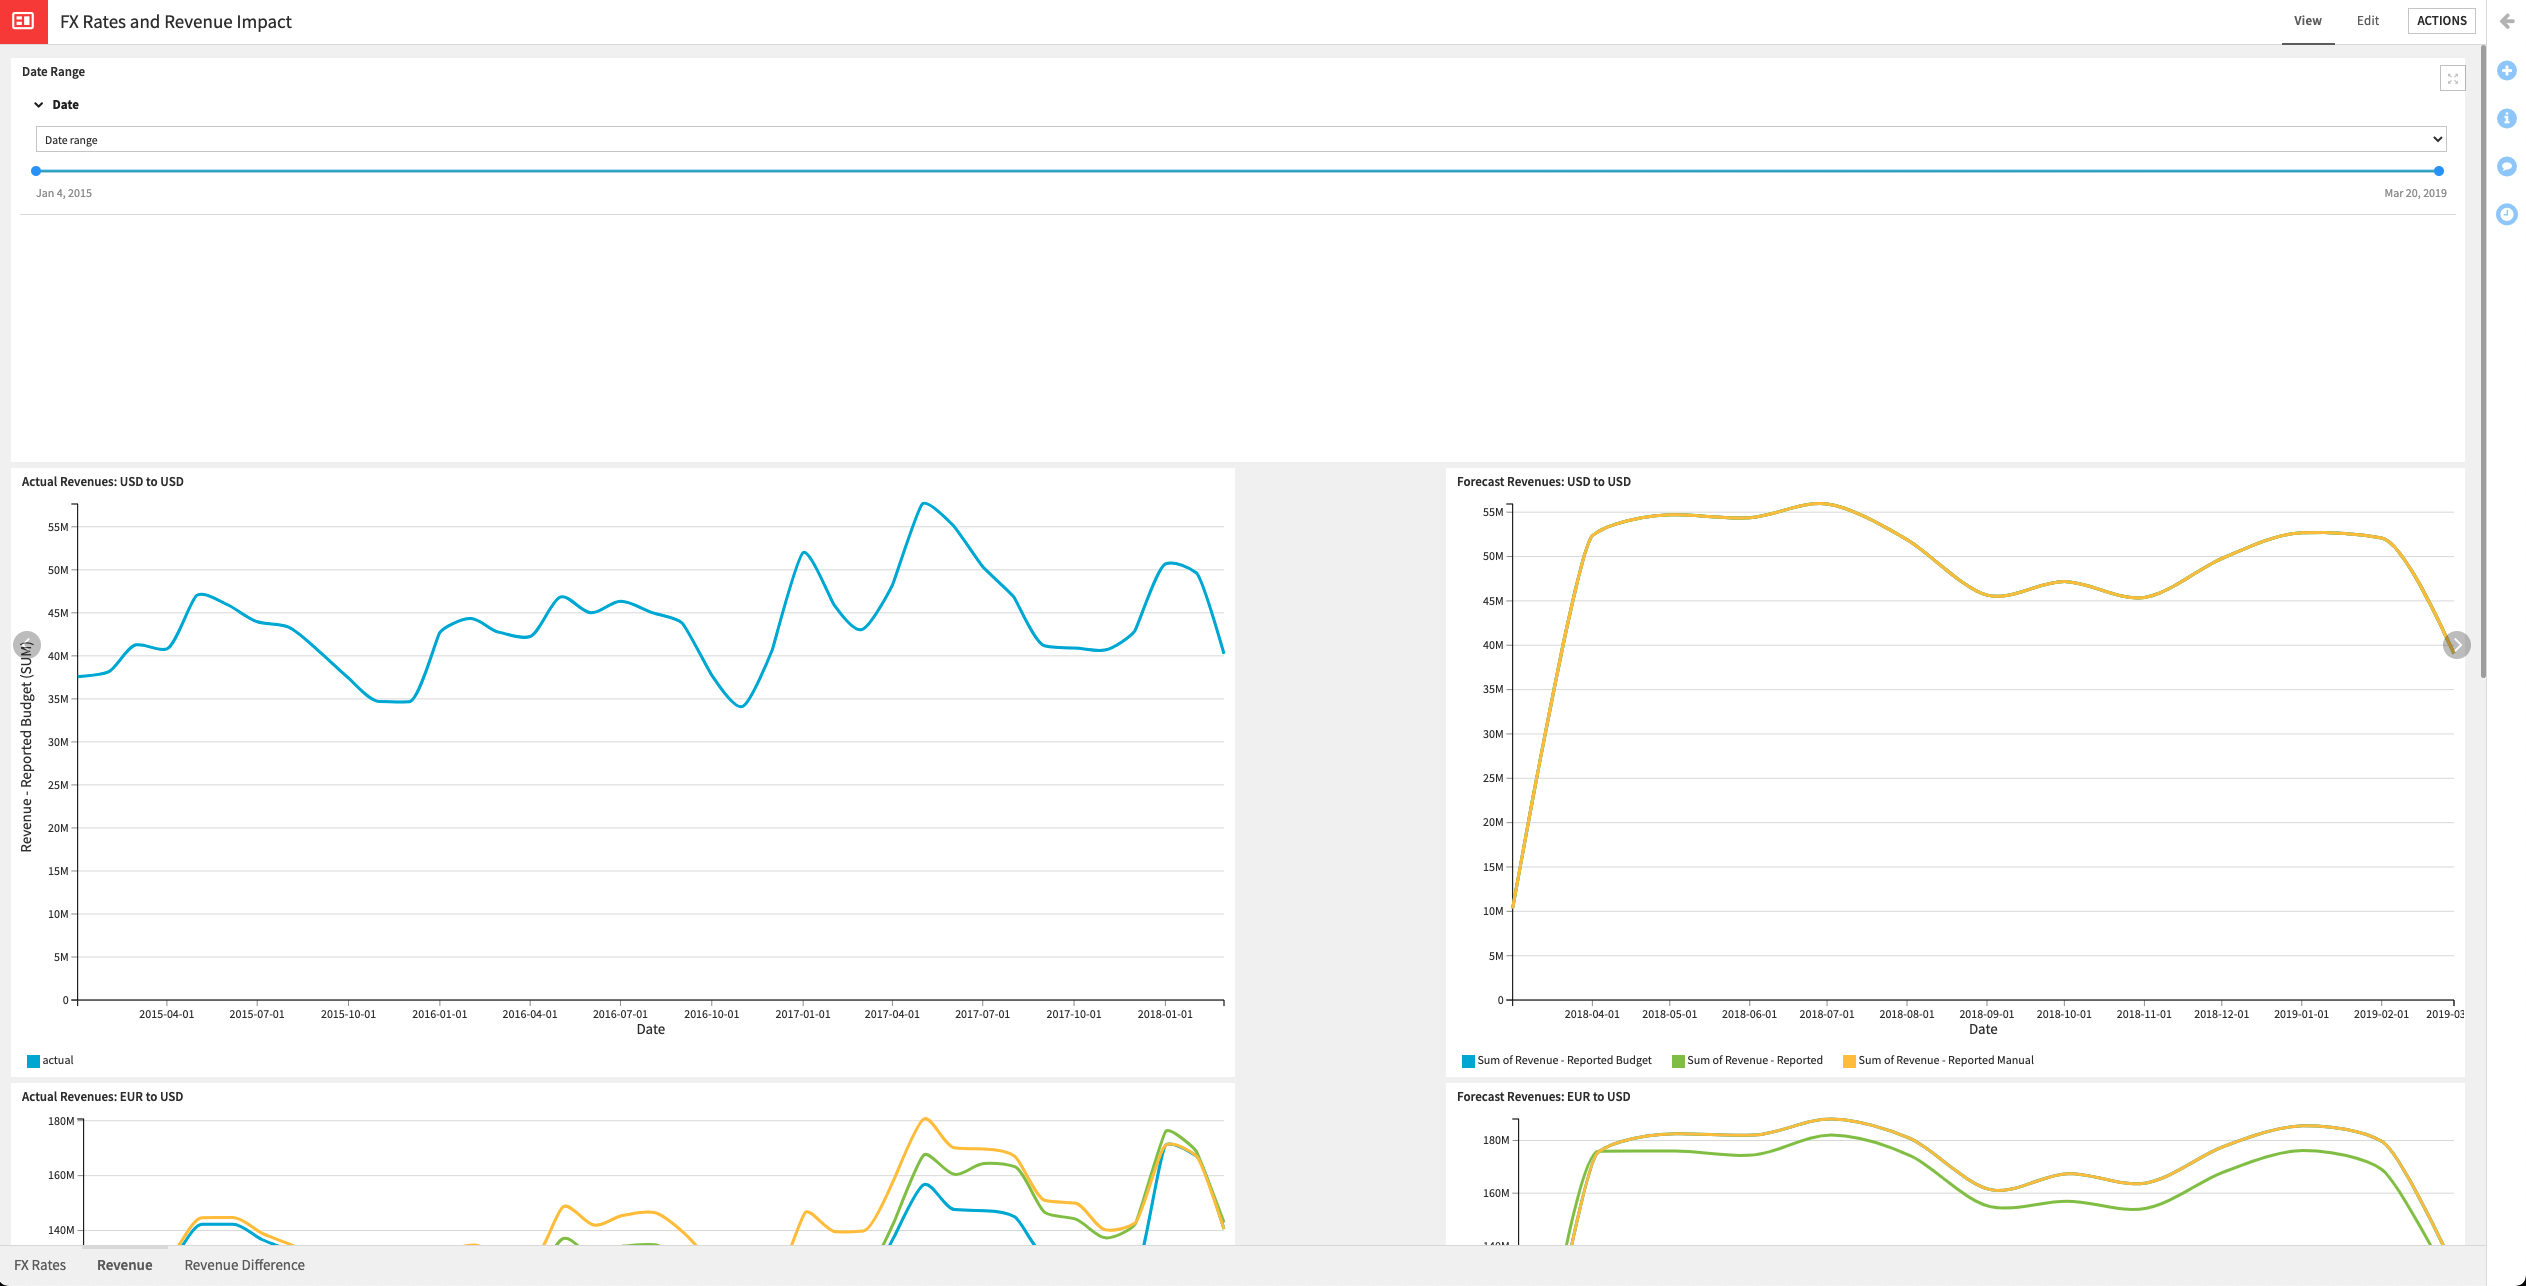
We also have a separate global date filter to impact all graphs of the Revenue tab. Three sets of graphs are available on this tab: One for each currency in the project (USD, EUR, MXN). Each currency has one chart showing its actual revenues, and one showing its forecast revenues.
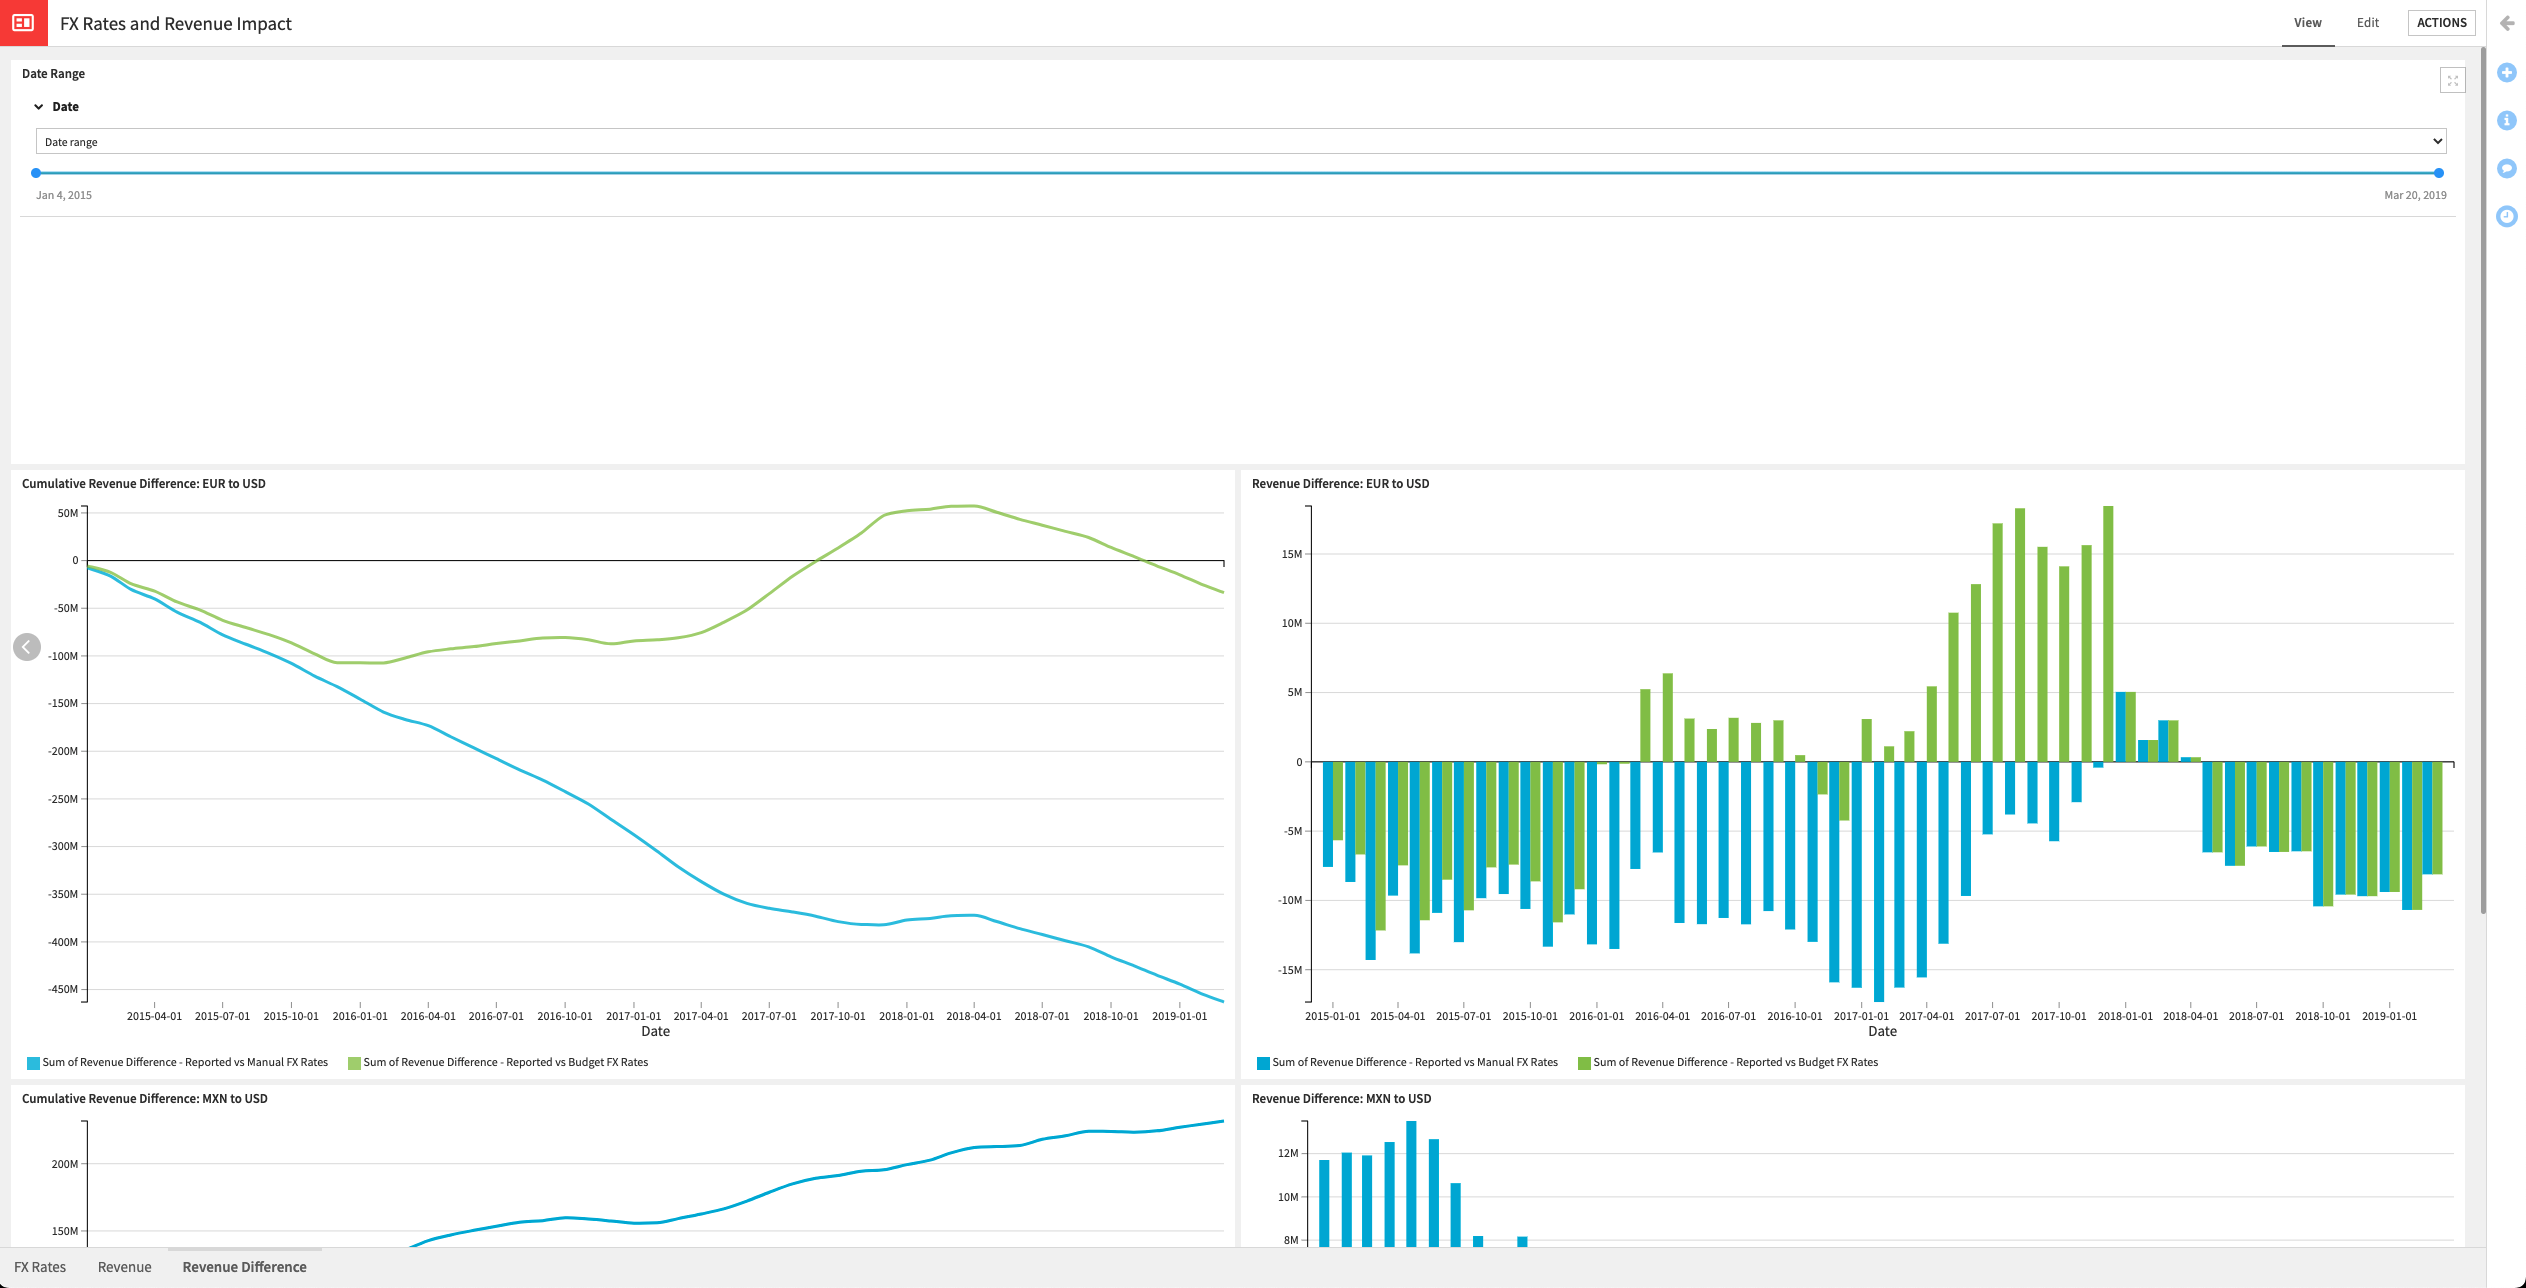
Lastly, the Revenue Difference tab shows the cumulative revenue difference and the total difference for each month. Only currencies that need conversion are displayed in these charts. We can iteratively return to the FX Rates tab, edit the table on the left-hand side, save changes, and refresh the dashboard until we achieve an analysis that we’re satisfied with.
A Note on Automation
This solution comes with 3 preset automations in the form of Scenarios that can be viewed in the Scenarios menu of the project. The provided scenarios allow for a full rebuild of the flow, rebuild of the parts of the flow that are impacted by modification of the manual FX rates, and refresh of the Dashboard and export of the Dashboard to PDF. Triggers for these scenarios can be created and modified as needed.
Reproducing these Processes With Minimal Effort For Your Own Data
The intent of this project is to enable finance teams to understand how Dataiku can be used to efficiently manage and productionize the analysis of FX Impact. By creating a singular solution that can benefit and influence the decisions of a variety of teams in a single organization, smarter and more holistic strategies can be designed in order to build rulesets for processing ledger data, and leverage sources of truth within your business, and evaluate alternative hypotheses.
We’ve provided several suggestions on how to use sales and FX rate data but ultimately the “best” approach will depend on your specific needs and your data. If you’re interested in adapting this project to the specific goals and needs of your organization, roll-out and customization services can be offered on demand.