Demand Forecast
Overview
Business Case
Predicting how your business will behave in the future, whether being short, medium or long term is hard. Yet, it is critical for all companies to have the ability to forecast future trends in a reliable manner to answer a broad range of strategic questions. In order to answer those questions, companies should be able to plan for future trends: how? By leveraging Demand Forecast.
In this plug and play solution, transactions dataset, product metadata, seasonal events, and point of sale information is used to train a model to forecast demand. Users can quickly model different forecasting scenarios, enrich their model with demand drivers, leverage seasonality effects, and pave the road to optimization use cases.
Technical Requirements
Warning
It is strongly recommended to read the project wiki before using this solution as it further explains many of the parameters, requirements, and deliverables throughout the solution.
To leverage this solution, you must meet the following requirements:
Have access to a Dataiku 10.0+ instance
To benefit natively from the solution’s Dataiku Application, a PostgreSQL or Snowflake connection storing your data (see Data Requirements) is needed. However, the Solution comes with demo data available on the filesystem managed connection.
No code environment is needed for using this solution if running an instance with Python3 as the built-in environment. If your instance has a Python2 built-in environment you should create a basic Python3 code env and update the project settings.
Installation
Installing on your Dataiku Instance
If the technical requirements are met, this solution can be installed in one of two ways:
On your Dataiku instance click + New Project > Industry solutions > Retail > Demand Forecast.
Download the .zip project file and upload it directly to your Dataiku instance as a new project.
Installing on a Dataiku Online Instance
Dataiku Online customers can add this Solution to their managed instance from the Launchpad: Features > Add A Feature > Extensions > Demand Forecast
Data Requirements
The Dataiku flow was initially built using publicly available data. However, this project is meant to be used with your own data which can be uploaded using the Dataiku Application. Below are the input datasets that the solution has been built with:
Mandatory Datasets
transactions
products
seasons
Optional Datasets
products_pricing_information
forecast_granularity
Calendar Events
bank_holidays
events_calendar
school_holidays
Workflow Overview
You can follow along with the sample project in the Dataiku gallery.
The project has the following high-level steps:
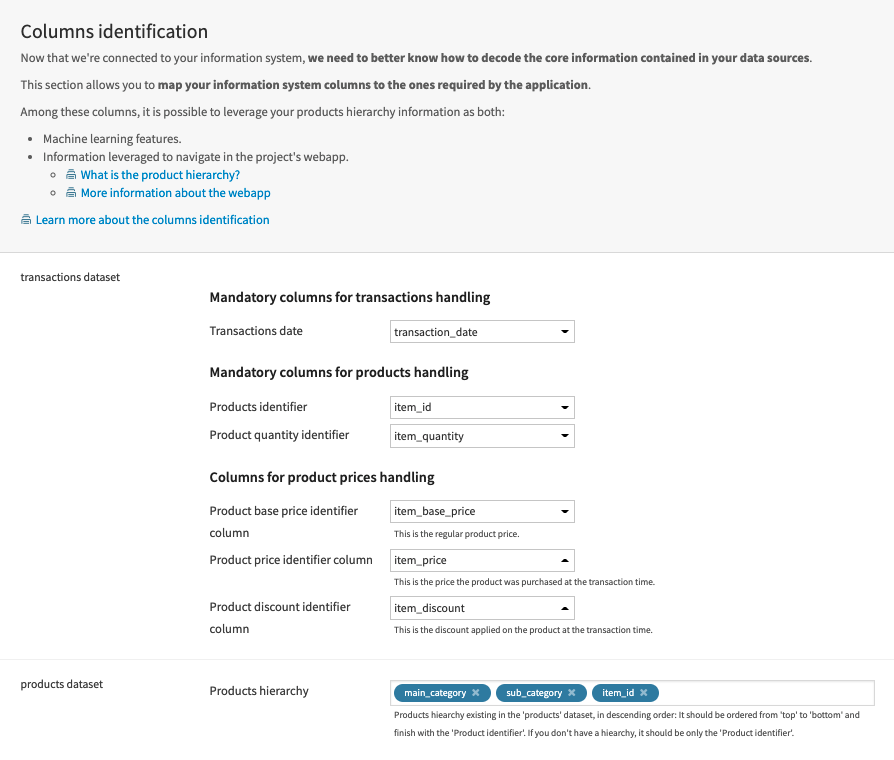
Connect your data as an input and select your analysis parameters via the Dataiku Application.
Ingest and pre-process the data to be available for demand forecasting
Identify seasonality and gather forecast features
Train a demand forecasting model and score data
Interactively explore the forecast model and the predicted forecast of products with a pre-built Dashboard
Walkthrough
Note
In addition to reading this document, it is recommended to read the wiki of the project before beginning in order to get a deeper technical understanding of how this solution was created, the different types of data enrichment available, longer explanations of solution specific vocabulary, and suggested future direction for the solution.
Plug and play with your own data and parameter choices
To begin, you will need to create a new instance of the Demand Forecast Dataiku Application. This can be done by selecting the Dataiku Application from your instance home, and clicking Create App Instance.
Once the new instance has been created you can walk through the steps of the Application to add your data and select the analysis parameters to be run. Users of any skill level can experiment with multiple approaches to quickly find the parameters that best fit an organization’s needs. You could also instantiate multiple Demand Forecast projects to compare more easily your feature engineering and modeling approaches.
Once we’ve built all elements of our Dataiku Application you can either continue to the Project View to explore the generated datasets or go straight to the Dashboards and WebApp to visualize the data. If you’re mainly interested in the visual components of this pre-packaged solution, feel free to skip over the next few sections
Under the Hood: How do we extract the necessary data to train a forecast model?
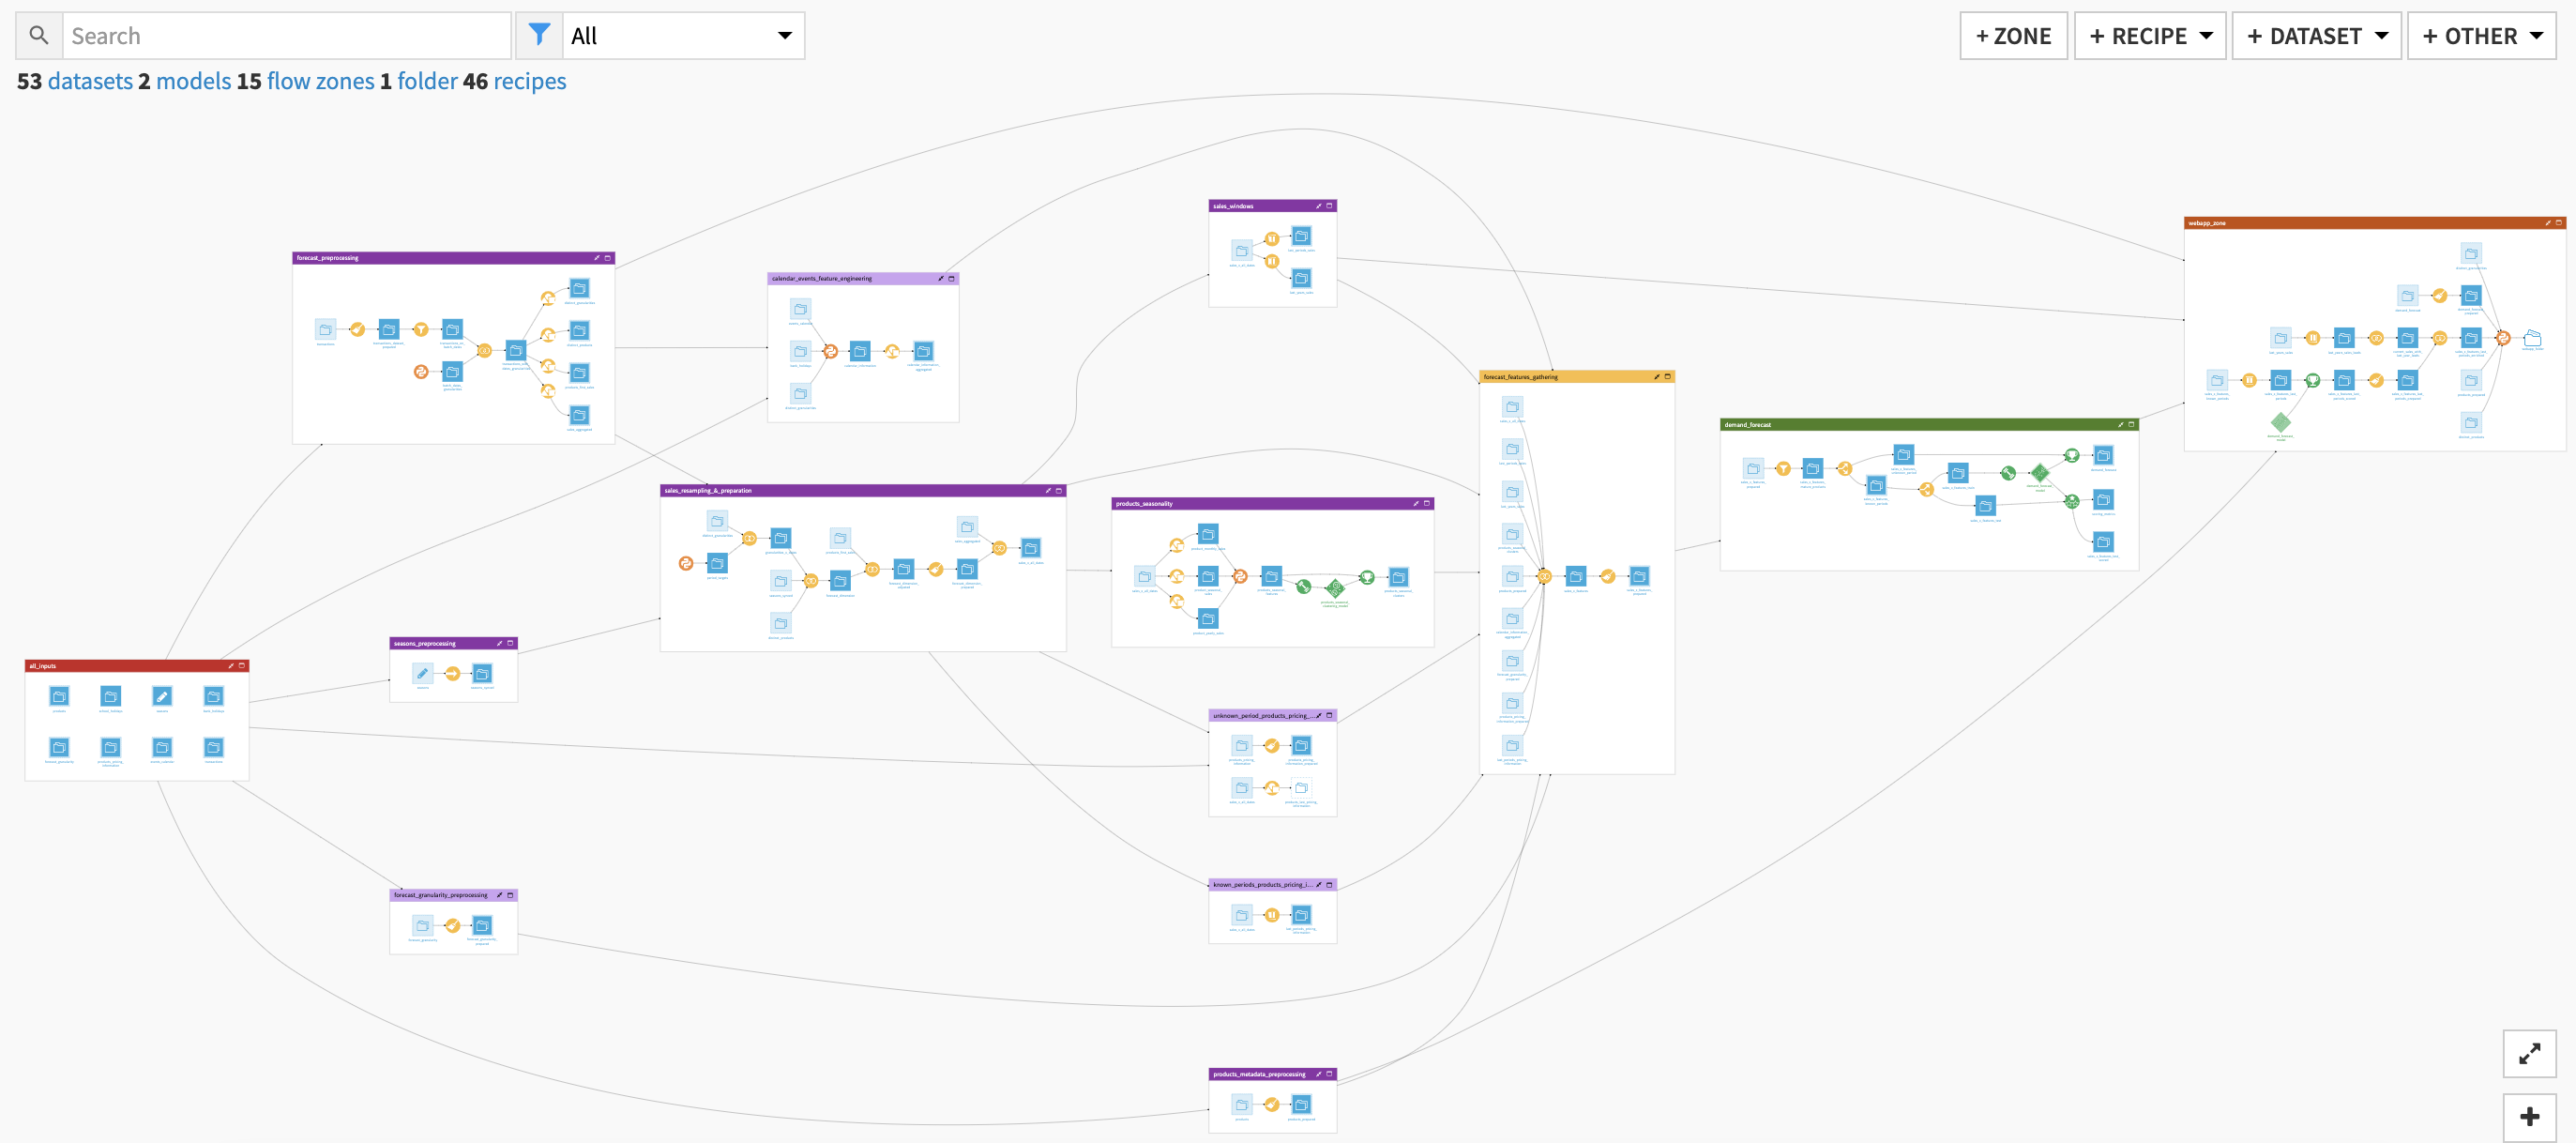
The Dataiku Application is built on top of a Dataiku Flow that has been optimized to accept input datasets and respond to your select parameters. Let’s quickly walk through the different flow zones to get an idea of how this was done.
The all_inputs zone centralizes the ingestion of all datasources involved in the use case (mandatory and optional). An editable dataset is also contained in this section where users can modify the season labels.
The products_metadata_preprocessing flow zone employs a prepare recipe to process the products/SKUs metadata information to be used by the Webapp and as input features for the forecast model.
forecast_preprocessing takes the data from our input transactions history dataset and generates multiple datasets which will allow us to resample and frame the data in a way that is relevant to the demand forecast model.
seasons_preprocessing pushes information contained in the editable seasons dataset to a dataset in your preferred connection (e.g. filesystem managed, snowflake).
The sales_resampling_&_preparation flow zone resamples and prepares our sales data so that they are in the correct format for time feature engineering and enrichment further down the flow.
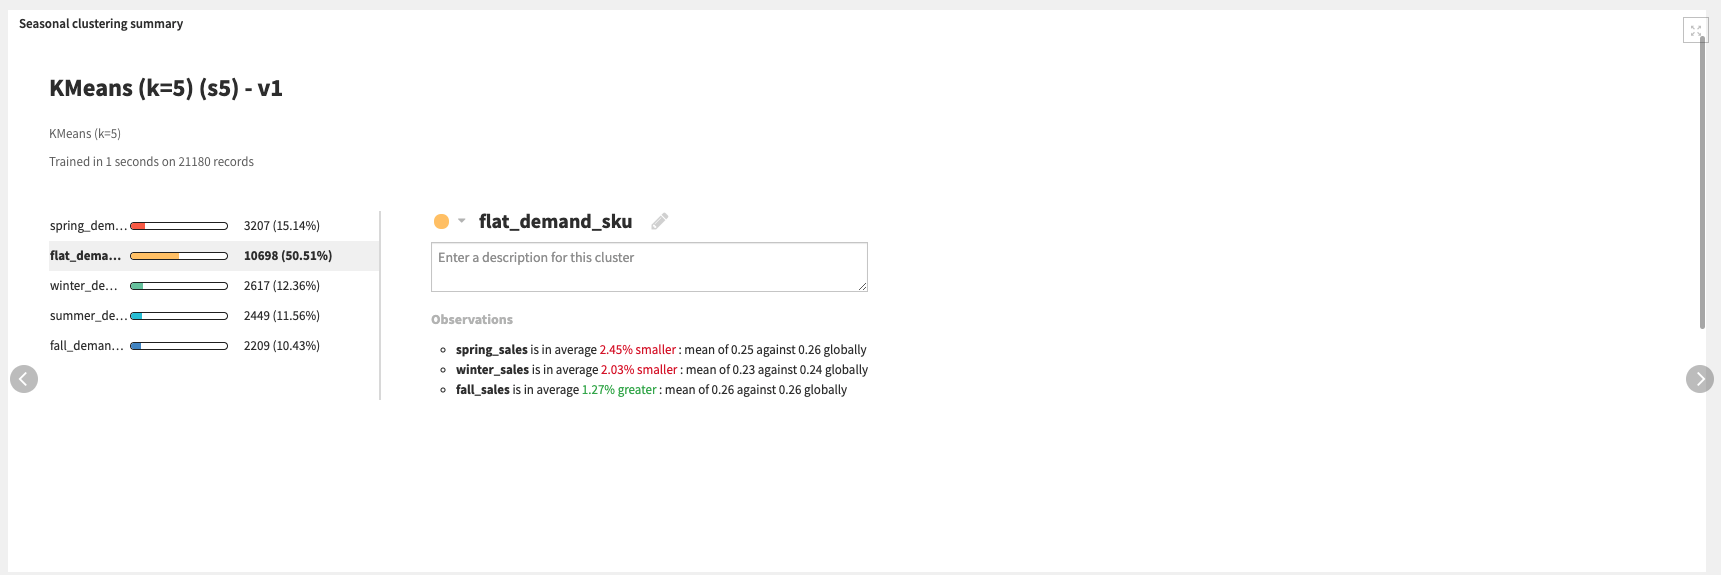
The products_seasonality flow zone assesses each product/SKU’s individual seasonality by aggregating the fraction of our monthly or seasonal sales compared to our yearly sales. Then a KMeans clustering model is trained over these sales fractions to identify season product/SKU clusters.
The sales_windows flow zone computes time windows over our sales information so that, for each period of time, we can assess the min, max, average, standard deviation, count, and lag of sales in preceding time periods and identify sales of previous years.
The following flow zones are “optional” and will not be used if the related optional datasets and/or parameters in the Dataiku Application are not included
calendar_events_feature_engineering transforms your calendar event data into time features exploitable by the forecast model. These features will transcribe the closeness of each *Demand Forecast* period to all the events that surround it.
forecast_granularity_preprocessing preprocesses the offline locations data and maps it to the forecast granularity defined in the Dataiku App. With this, we can enrich the sales historical data with our locations information, as geospatial features to be included in the model training.
known_periods_products_pricing_imputation aggregates the products/SKUs pricing information over the past 5 periods to be later used to fill missing data.
unknown_period_products_pricing_imputation contains two branches that are relevant if price is a key component of our demand forecast. If we have known sales prices we can impute the forecast period pricing information with our known data. If we only have our last known pricing information we can use that to impute but it is the less robust option.
Once your data has been appropriately ingested, pre-processed, and engineered via the aforementioned flow zones, we can begin to extract what features will be used to train our model.
Under the Hood: Turning past data into future demand
Two flow zones are used to take the prepared data and train a demand forecast model.
We begin with the forecast_features_gathering flow zone which gathers all the features that have been previously computed in the flow and resample the product/SKU’s sales dataset. We then apply a prepare recipe to clean up our data in the format needed to pass it along to the next flow zone.
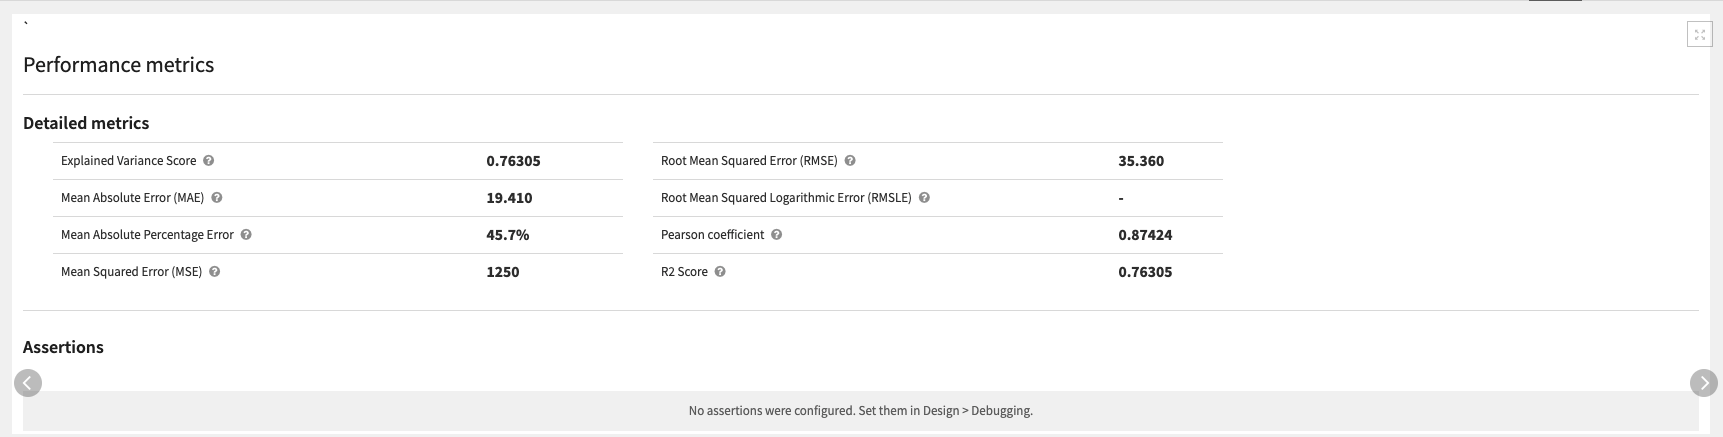
The demand_forecast flow zone first filters the data on the products/SKUs based on those with sufficient historical sales before splitting the resulting data into train and test sets. The demand forecast model is then trained on that test dataset to predict the demand of each product/SKU in a target period of time (set in the Dataiku App). The solution uses an XGBoost model since that is what performed the best on our data but it is recommended to train other algorithms on your own data to find the one with the best performance.
The webapp_zone is not involved in the training of the forecast model but does map all past sales information with the recently scored forecast demands so that we can visualize the results of our flow in the Solution’s Webapp.
Further explore your association rules with shareable visualizations
The Demand Forecast solution comes with a prebuilt dashboard containing:
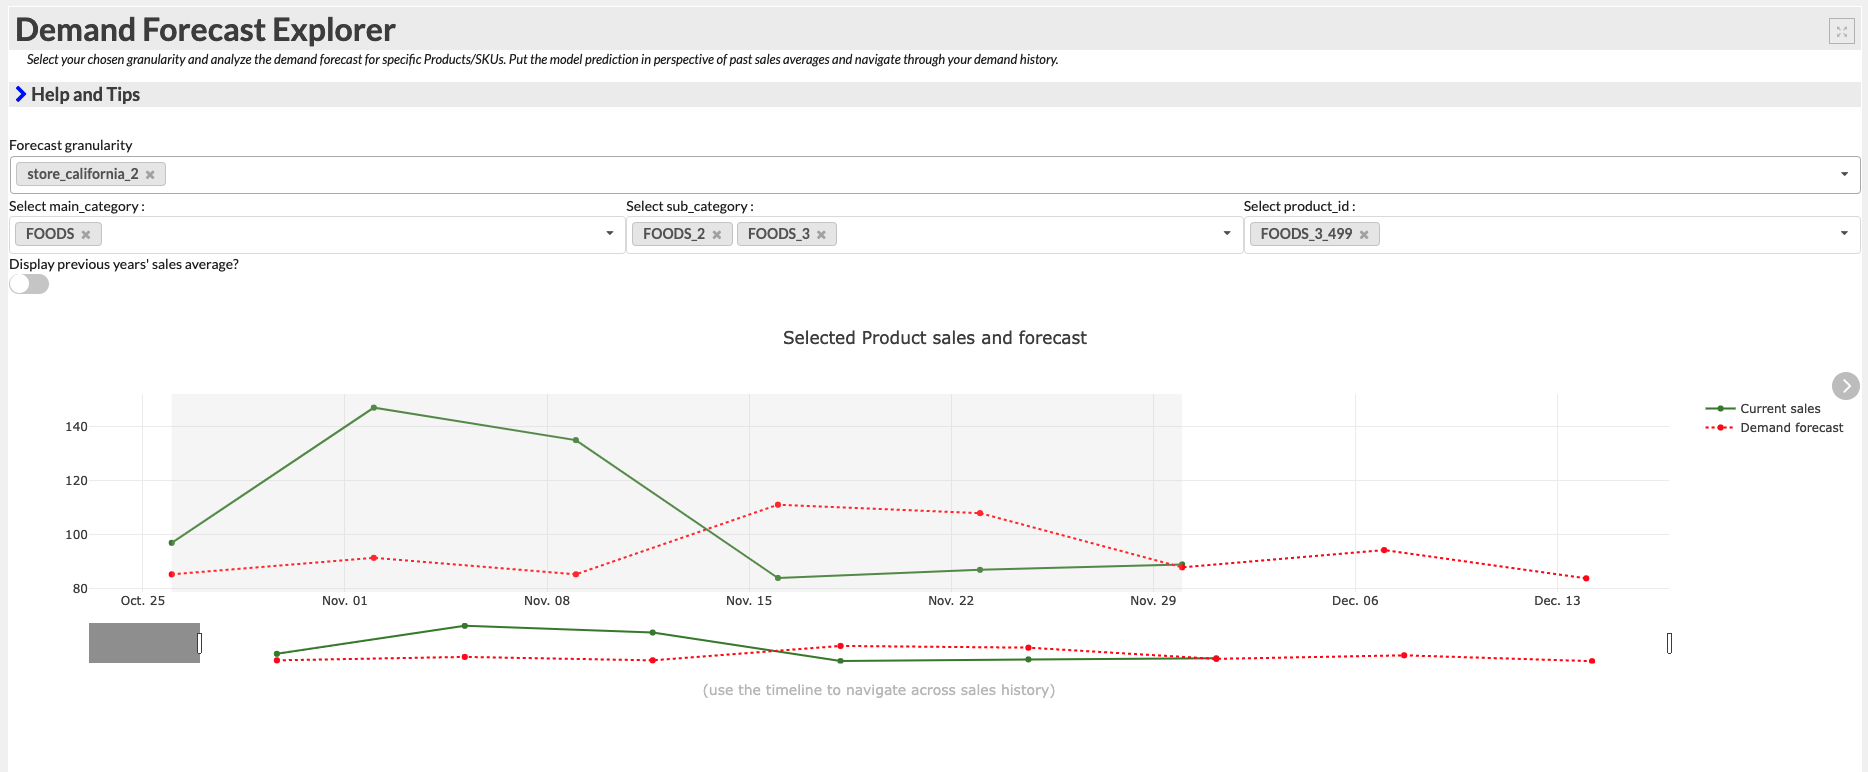
The Webapp | Forecast explorer tab provides a prebuilt Webapp to enable assessment of our individual products’ forecasted demand at each forecast granularity. The Webapp allows us to visualize multiple products together and compare the forecasted demand to past sales.
The Forecast model evaluation tab allows for a more global analysis of the demand forecast model by leveraging Dataiku’s subpopulation analysis capability to look at the model predictions based on categorical attributes.
Forecast Model interpretation uses a feature importance graph to present the most important variables driving product demand and partial dependence plots to assess the relationship between input features and the model’s predictions.
The Seasonal clustering tab allows us to observe the results of our products/SKUs’ seasonal clustering and assess the distribution of the clustering features.
Lastly, we can globally monitor our sales and quickly identify our most popular items via the Sales monitoring tab.
A short note on automation
It is possible to automate the flow of this solution to be triggered based on new data, a specific time, etc via the Dataiku Application. All of these trigger parameters can be tuned in the Scenarios menu of the project. Additionally, reporters can be created to send messages to Teams, Slack, email, etc. to keep our full organization informed. These scenarios can also be run ad-hoc as needed. Full detail on the scenarios and project automation can be found in the wiki.
Reproducing these Processes With Minimal Effort For Your Own Data
The intent of this project is to enable marketing teams to have a plug-and-play solution built with Dataiku to forecast the demand of products over a period of time. By creating a singular solution that can benefit and influence the decisions of a variety of teams in a single organization, smarter and more holistic strategies can be designed in order to optimize sourcing and production planning, inventory management, pricing, and marketing strategies, and much more.
We’ve provided several suggestions on how to use transaction data to forecast demand but ultimately the “best” approach will depend on your specific needs and your data. If you’re interested in adopting this project to the specific goals and needs of your organization, roll-out and customization services can be offered on demand.