How-To: Perform Statistical Analysis on Time Series Data
Before building models on a dataset, it is important to explore the data by plotting charts and performing statistical analyses. This process applies to any dataset, including time series data.
By exploring your time series data, you’ll understand its characteristics better. For example, you can get insights into the underlying trends, patterns, correlations, etc. These insights will help you know which kinds of feature engineering to apply to your time series data and decide on the kinds of algorithms that would be best suited for modeling the data.
This article covers how to perform various statistical analyses on a dataset that contains weekly price information for three airline stocks United Airlines (UAL), American Airlines (AAL), and Delta Airlines (DAL). The following figure shows plots of the adjusted closing price Adj Close of the three time series in the dataset.
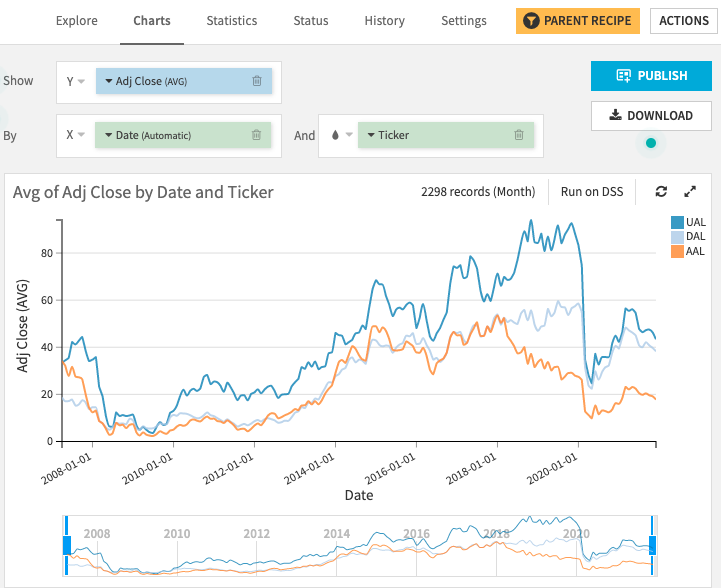
The plots show a dip in airline stock prices in early 2020 — likely due to the COVID pandemic. Also, there appears to be a general upward trend from 2009 to 2020 for the UAL and DAL time series, and not so much for AAL.
Let’s now see how you can perform statistical analyses on the time series to supplement the insights you’ve gained from the charts. In the next few sections, you’ll run some of the available tests within Dataiku to investigate if there are trends and autocorrelation within the data.
Note
For a complete list of the available time series tests in Dataiku, see Time Series Analysis in the product documentation.
Test for Trends in Time Series Data
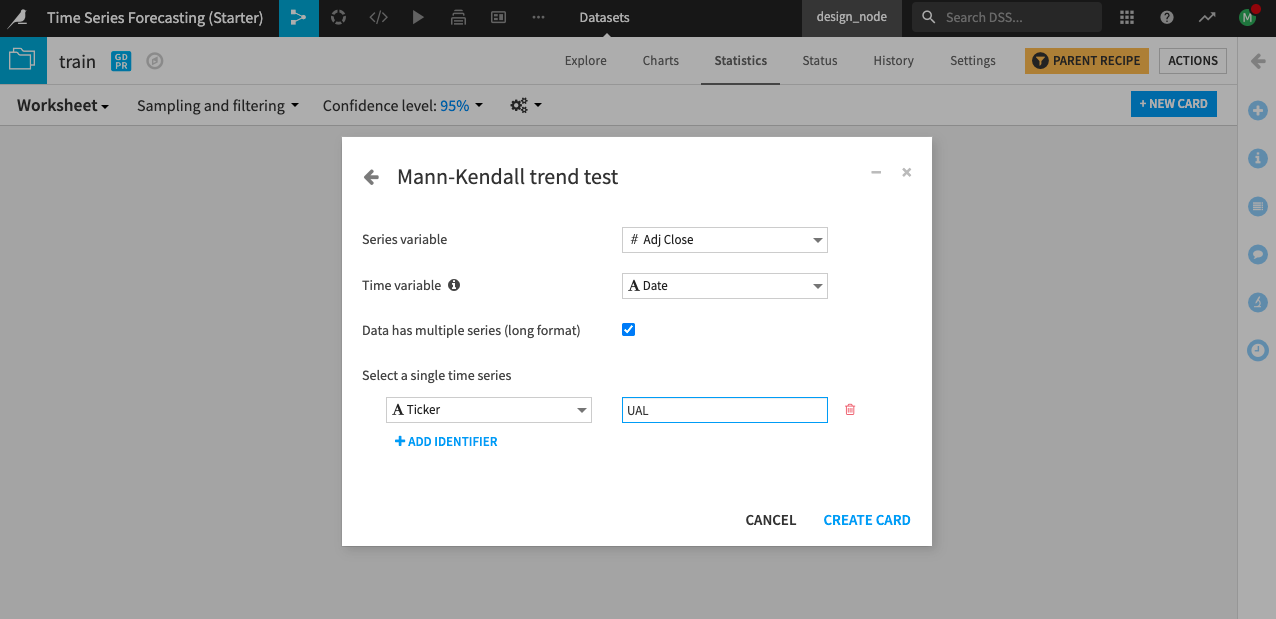
The previous chart showed that all three of the time series have a general upward trend. You can use the Mann-Kendall trend test in Dataiku’s Interactive Statistics interface to analyze one of the time series (the adjusted closing price of UAL) for a trend.
Dataiku creates a test card that contains the test details.
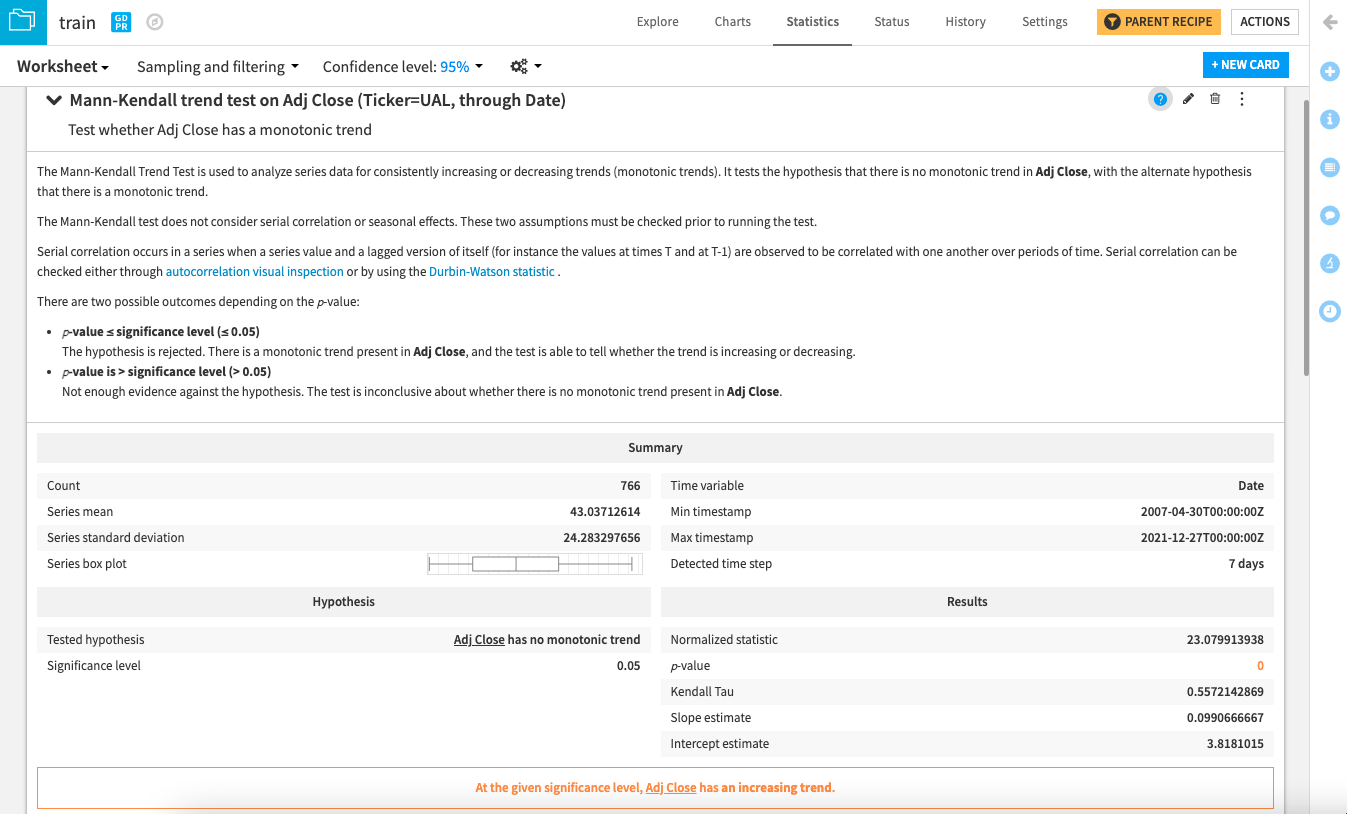
In this case, this test confirms that the time series has an upward or increasing trend, given a significance level of 0.05. You can also apply the test to the other two time series (Adj Close for AAL and DAL) to see if they have the same property.
Tip
Notice the help button (question mark icon) at the top right corner of the card. You can click this button to open up (and close) additional information on how to use the test and understand your results.
Test for Autocorrelation in Time Series Data
Tests for autocorrelation allow you to assess whether a time series is correlated to lagged versions of itself. You can create a plot to assess the autocorrelation over a year (52 weeks) for the adjusted closing price of the UAL time series.
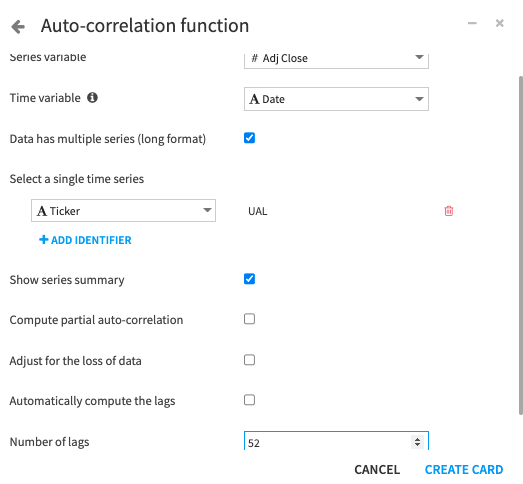
Dataiku creates a test card that contains the autocorrelation plot.
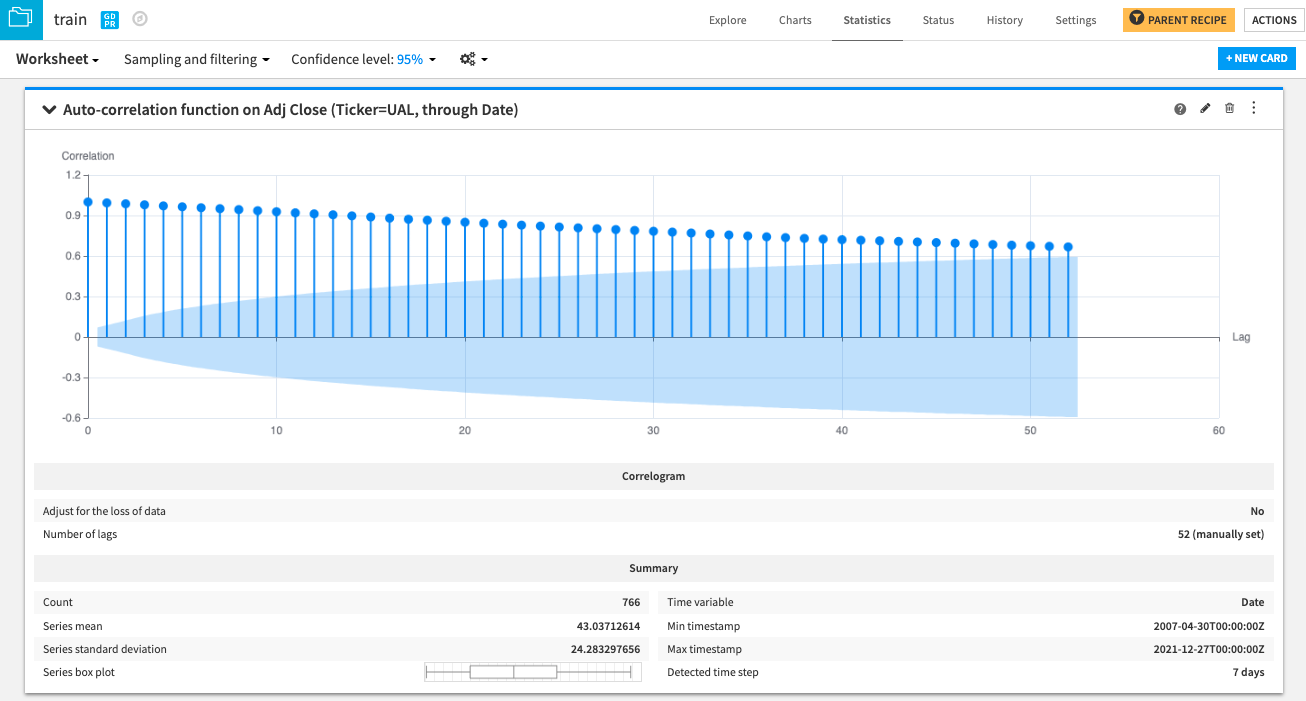
The spikes at each lag indicate autocorrelation. The autocorrelation appears to decrease as the time lags increase. Intuitively, you can expect that the stock price for a given day will be correlated with the prices from the previous days or weeks, and this correlation will reduce as time progresses.
Note
You can also conduct the Durbin-Watson statistical test to confirm the presence of a positive serial correlation in the time series.
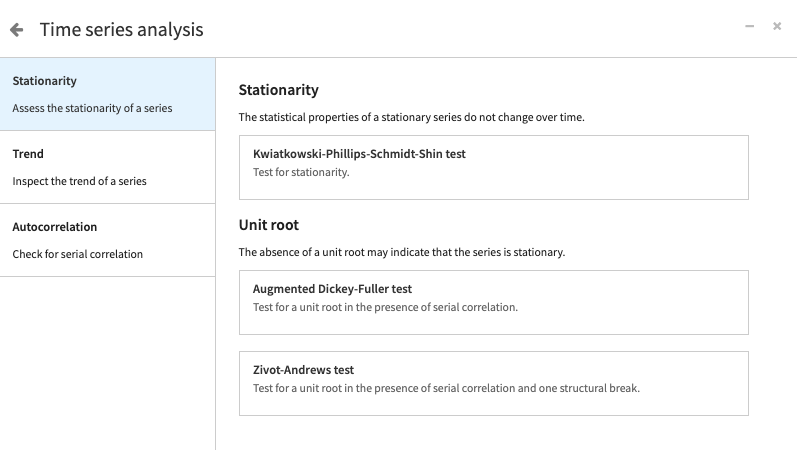
For other time series, you may be interested in testing for properties such as stationarity or the presence of a unit root. For these, the visual time series interface provides tests such as the Kwiatkowski Phillips Schmidt Shin test, the Augmented Dickey-Fuller test, and the Zivot-Andrews test.
What’s Next?
Congratulations on taking your first steps with performing statistical analyses on time series data.
You can continue learning by checking out the Time Series Analysis page in the product documentation and by trying out the other time series analysis cards in the Statistics worksheet of the dataset.