RFM Segmentation
Overview
Business Case
Personalization is a huge opportunity for Retail and CPG businesses but in order to do so, a key step is to identify purchasing patterns among consumers in order to make the right decisions depending on each consumer purchase behavior. While several techniques can be used to do so, one that has been tried and true is RFM segmentation. It identifies purchasing patterns by focusing on the Recency, the Frequency, and the Monetary value of the consumer purchases.
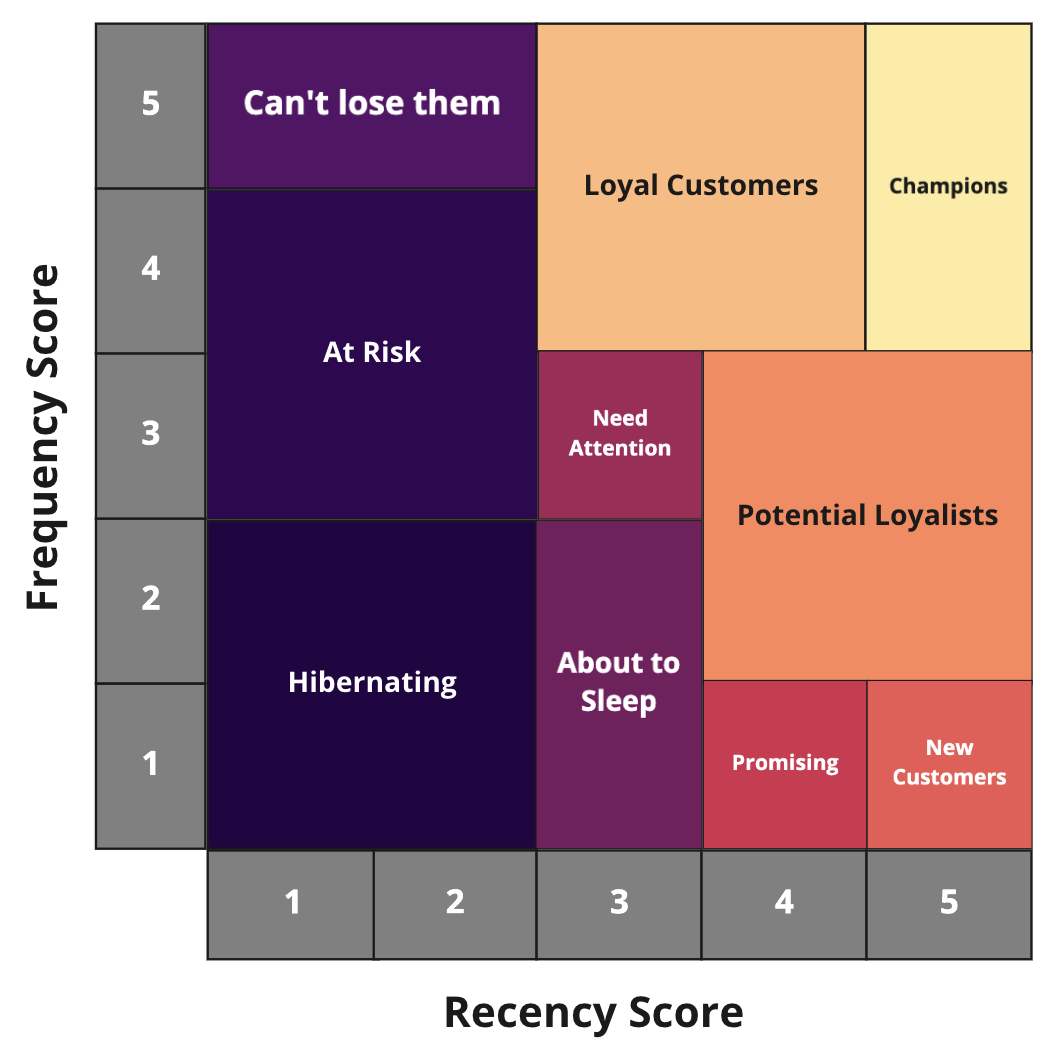
In this plug and play solution, we assess all customers in a transactions dataset against those 3 criteria before segmenting customers across homogenous groups of users (segments): from the “hibernating” to the “champions” every consumer belongs to one segment which can evolve over time depending on the purchases made. Brands are therefore able to push the right offer/product to the right consumer (segment). Doing so will foster loyalty and increase the consumer lifetime value for the brand, while consumers will have a better purchase experience while benefiting from a more personalized journey.
Technical Requirements
Warning
It is strongly recommended to read the project wiki before using this solution as it further explains many of the parameters, requirements, and deliverables throughout the solution. Additionally, if this is your first time doing RFM scoring, we recommend starting first with our RFM-Enriched Customer Lifetime Value Solution.
To leverage this solution, you must meet the following requirements:
Have access to a DSS 9.0+ instance
Dataiku’s Sankey Charts Plugin
To benefit natively from the solution’s Dataiku Application, a PostgreSQL or Snowflake connection storing your data (see Data Requirements) is needed
A Python 3.6 code environment named
solution_rfm-segmentationwith the following required packages:
dateparser==1.0.0
regex==2022.3.2
scikit-learn>=0.20,<0.21
Flask==2.0.2
plotly==5.5.0
nbformat==4.2.0
matplotlib==3.3.4
Note
Dataiku Online instances will auto-install these requirements when the Solution is created.
Installation
This solution is available to install on Dataiku and Dataiku Online instances.
Installing on your Dataiku Instance
If the technical requirements are met, this solution can be installed in one of two ways:
On your Dataiku instance click + New Project > Industry solutions > Retail > RFM Segmentation.
Download the .zip project file and upload it directly to your Dataiku instance as a new project.
Note
If running a DSS 9 instance, the solution is found by navigating to + New Project > Sample projects > Solutions > RFM Segmentation
Installing on a Dataiku Online Instance
Dataiku Online customers can add this Solution to their managed instance from the Launchpad: Features > Add A Feature > Extensions > RFM Customer Segmentation
Data Requirements
The Dataiku flow was initially built using publicly available data. However, this project is meant to be used with your own data which can be uploaded using the Dataiku Application. Having a transactional historical dataset is mandatory to run the project and each row of the dataset should be comprised of:
A product (Product ID)
A related transaction (Transaction ID)
Number of products purchased in a transaction (Product Quantity)
The product purchase price (Product Price)
Transaction date (Date)
Customer who made the purchase (Customer ID)
Workflow Overview
You can follow along with the sample project in the Dataiku gallery.
The project has the following high-level steps:
Connect your data as an input and select your analysis parameters via the Dataiku Application.
Ingest and pre-process the data to be available for RFM computation and propagation
Identify segments and apply segmentation to our customer base
Propagate RFM scoring beyond the defined period of dates
Interactively visualize our RFM segments as well as their evolution.
Walkthrough
Note
In addition to reading this document, it is recommended to read the wiki of the project before beginning in order to get a deeper technical understanding of how this solution was created, the different types of data enrichment available, longer explanations of solution-specific vocabulary, and suggested future direction for the solution.
Plug and play with your own data and parameter choices
To begin, you will need to create a new instance of the RFM Segmentation Dataiku Application. This can be done by selecting the Dataiku Application from your instance home, and clicking Create App Instance.
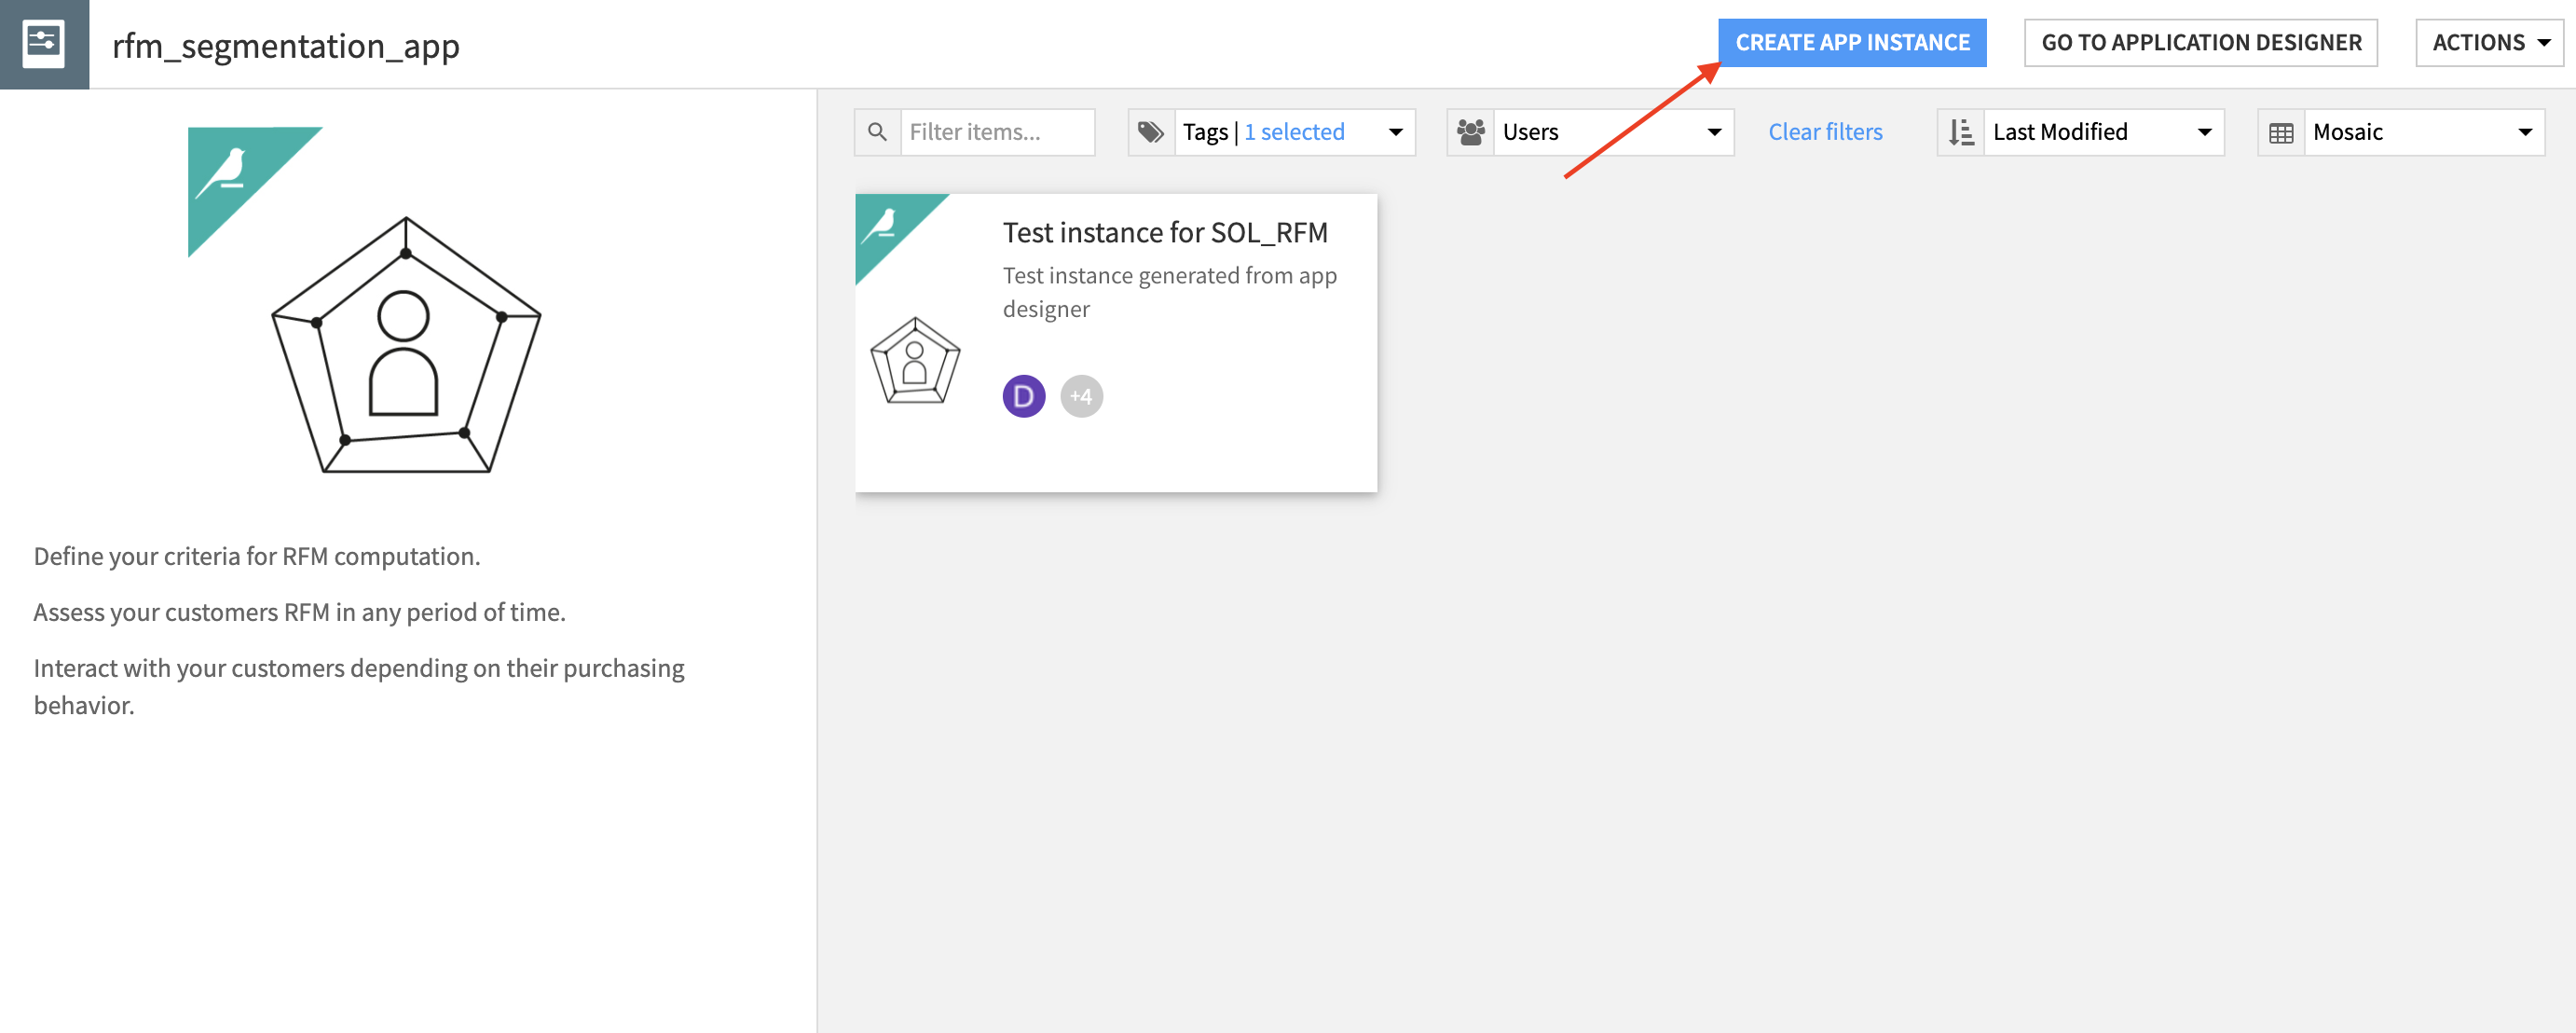
Once the new instance has been created you can walk through the steps of the Application to add your data and select the analysis parameters to be run.
In the Inputs section of the Application, reconfigure the connection parameters of the flow. By default, the solution works with datasets in a filesystem connection. To connect the solution to your own transaction data you will need your admin to inform you of your connection type and schema to be input into the Application parameters. Once completed, the RECONFIGURE button will rebuild the full flow to work with your data. Following reconfiguration, you can refresh the webpage and search for and test the transaction dataset.
Once your data has been uploaded, the data needs to be preprocessed before association rules are identified. Within the Transactions preprocessing section of the App, we can define how we want our transactions dataset to be transformed. Specifically, it is here where we can map the schema of our input transaction dataset to the solution-defined schema (See Data Requirements section above). Additionally, we can clarify how the dates are formatted.
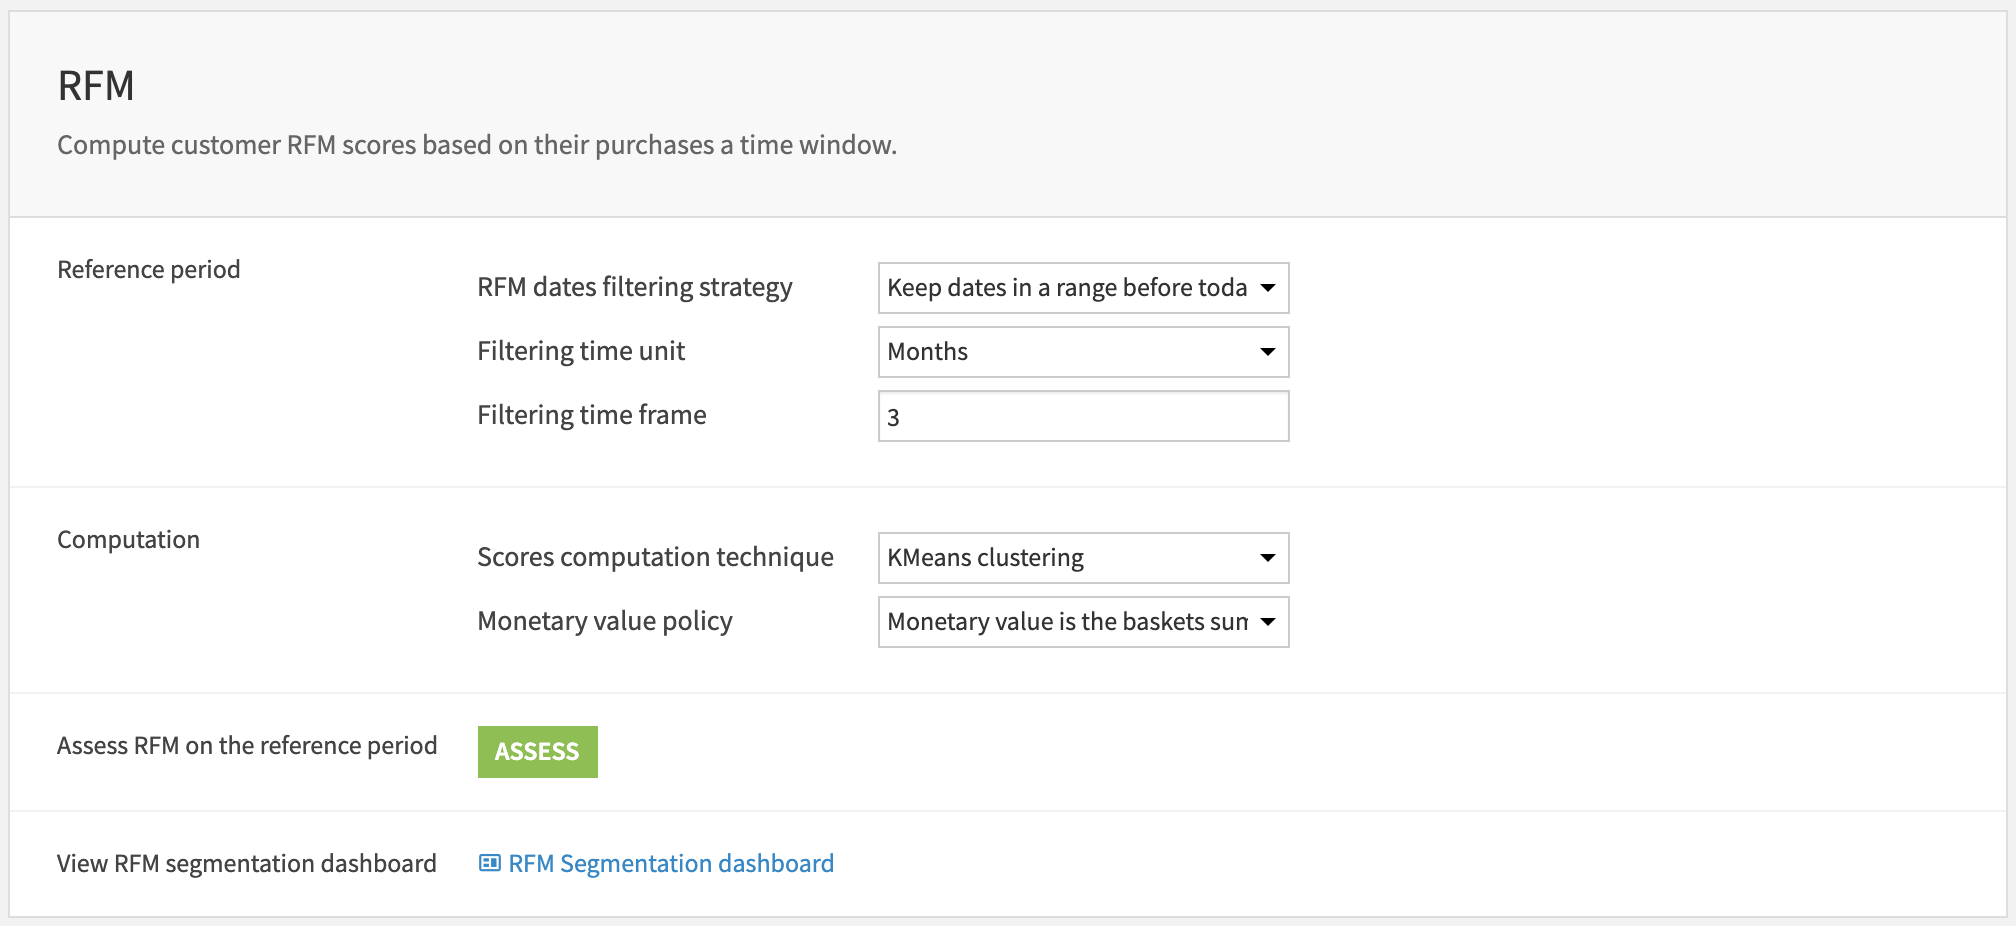
With our data filtered and formatted correctly, we are ready to move to RFM to define the period of time on which we want to filter our transactions history to use for RFM scoring. Additionally, we can select the RFM score computation technique (KMeans vs quantile) and Monetary Value Policy (total basket amount vs. average basket amount). The appendix of the project wiki goes into detail about the difference between these methods and policies.
Optionally, we can apply RFM propagation to our data by setting parameters of the RFM Propagation section. The overall project flow will look different from what has been presented above if Propagation is turned off. Applying Propagation allows us to apply our selected RFM scoring method on a larger date range that we define and enables us to see how customers have transitioned between segments over time.
We offer two final sections to make the Dataiku App more production-ready. The Build all flow at once section allows us to run all jobs needed to build the flow using our set parameters from the Application. The Automation section activates pre-built scenarios in order to refresh the project with new data over time.
Once we’ve built all elements of our Dataiku Application you can either continue to the Project View to explore the generated datasets or go straight to the Dashboards and WebApp to visualize the data. If you’re mainly interested in the visual components of this pre-packaged solution, feel free to skip over the next section.
Under the Hood: How do we compute RFM Scores and Segment Customers?
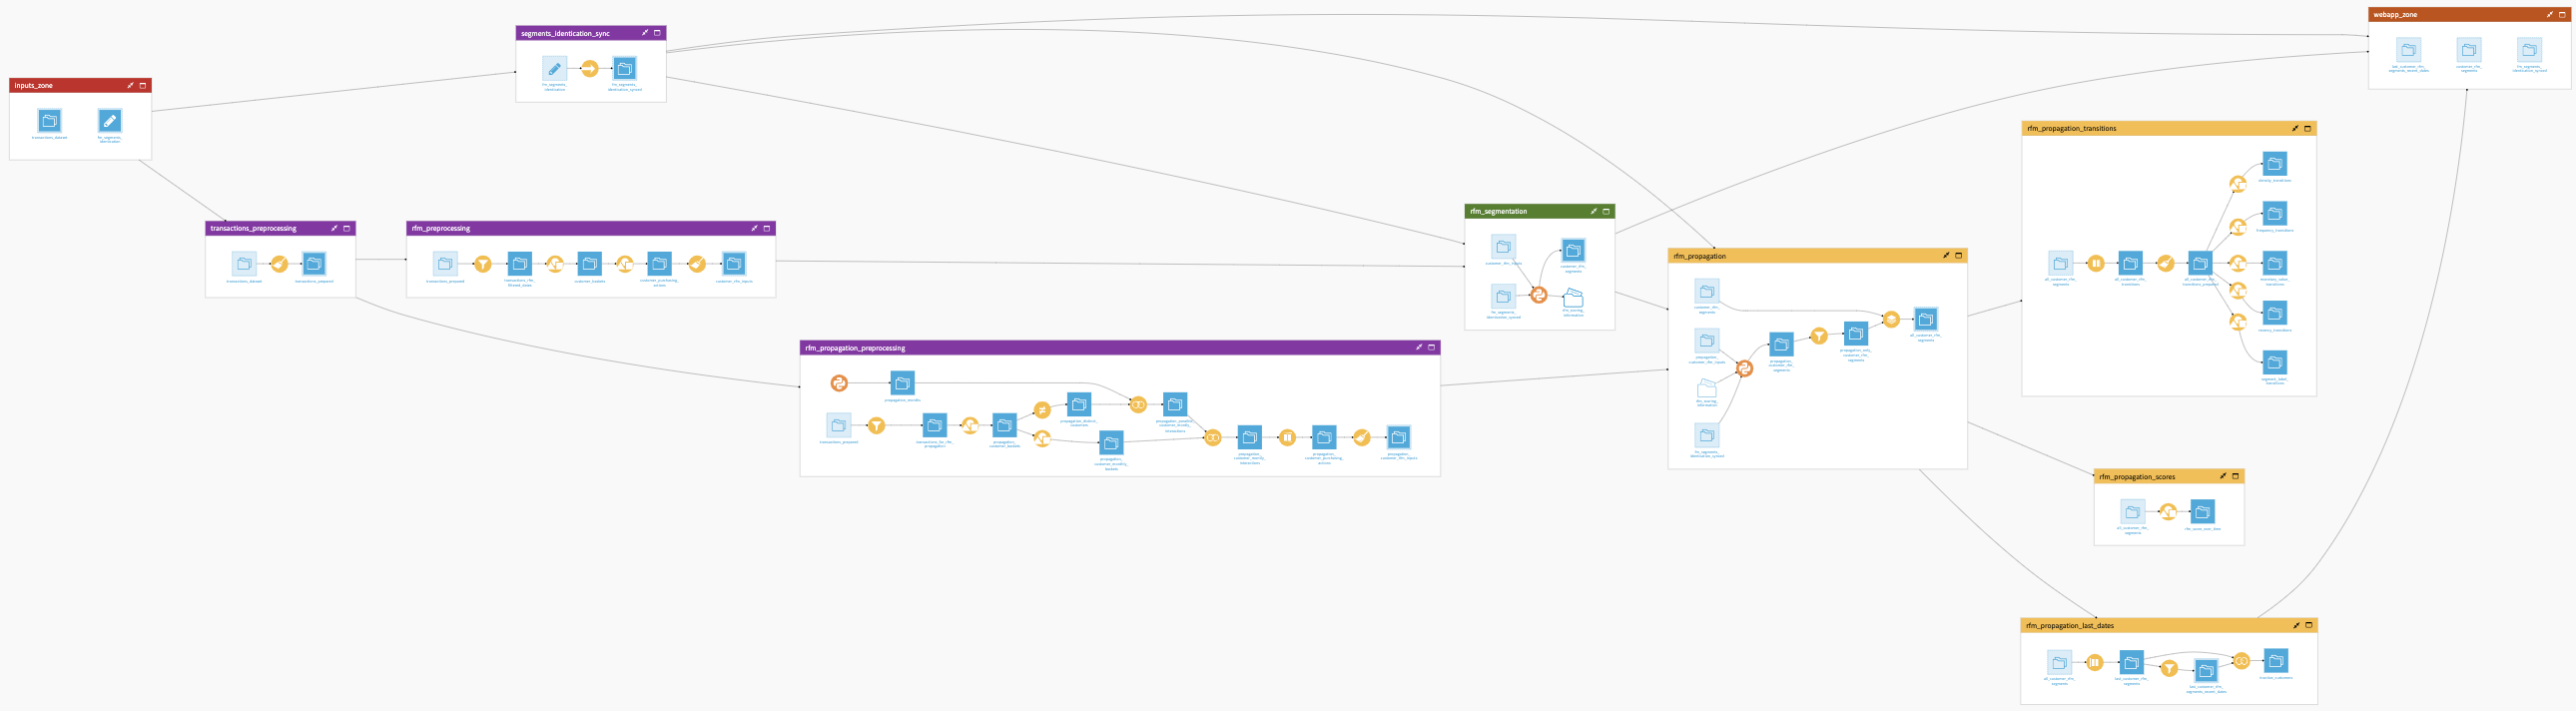
The Dataiku Application is built on top of a Dataiku Flow that has been optimized to accept input datasets and respond to your select parameters. Let’s quickly walk through the different flow zones to get an idea of how this was done. We will begin by focusing on the first branch of our flow which is specifically dedicated to the computation of our RFM scores and customer segmentation based on those scores.
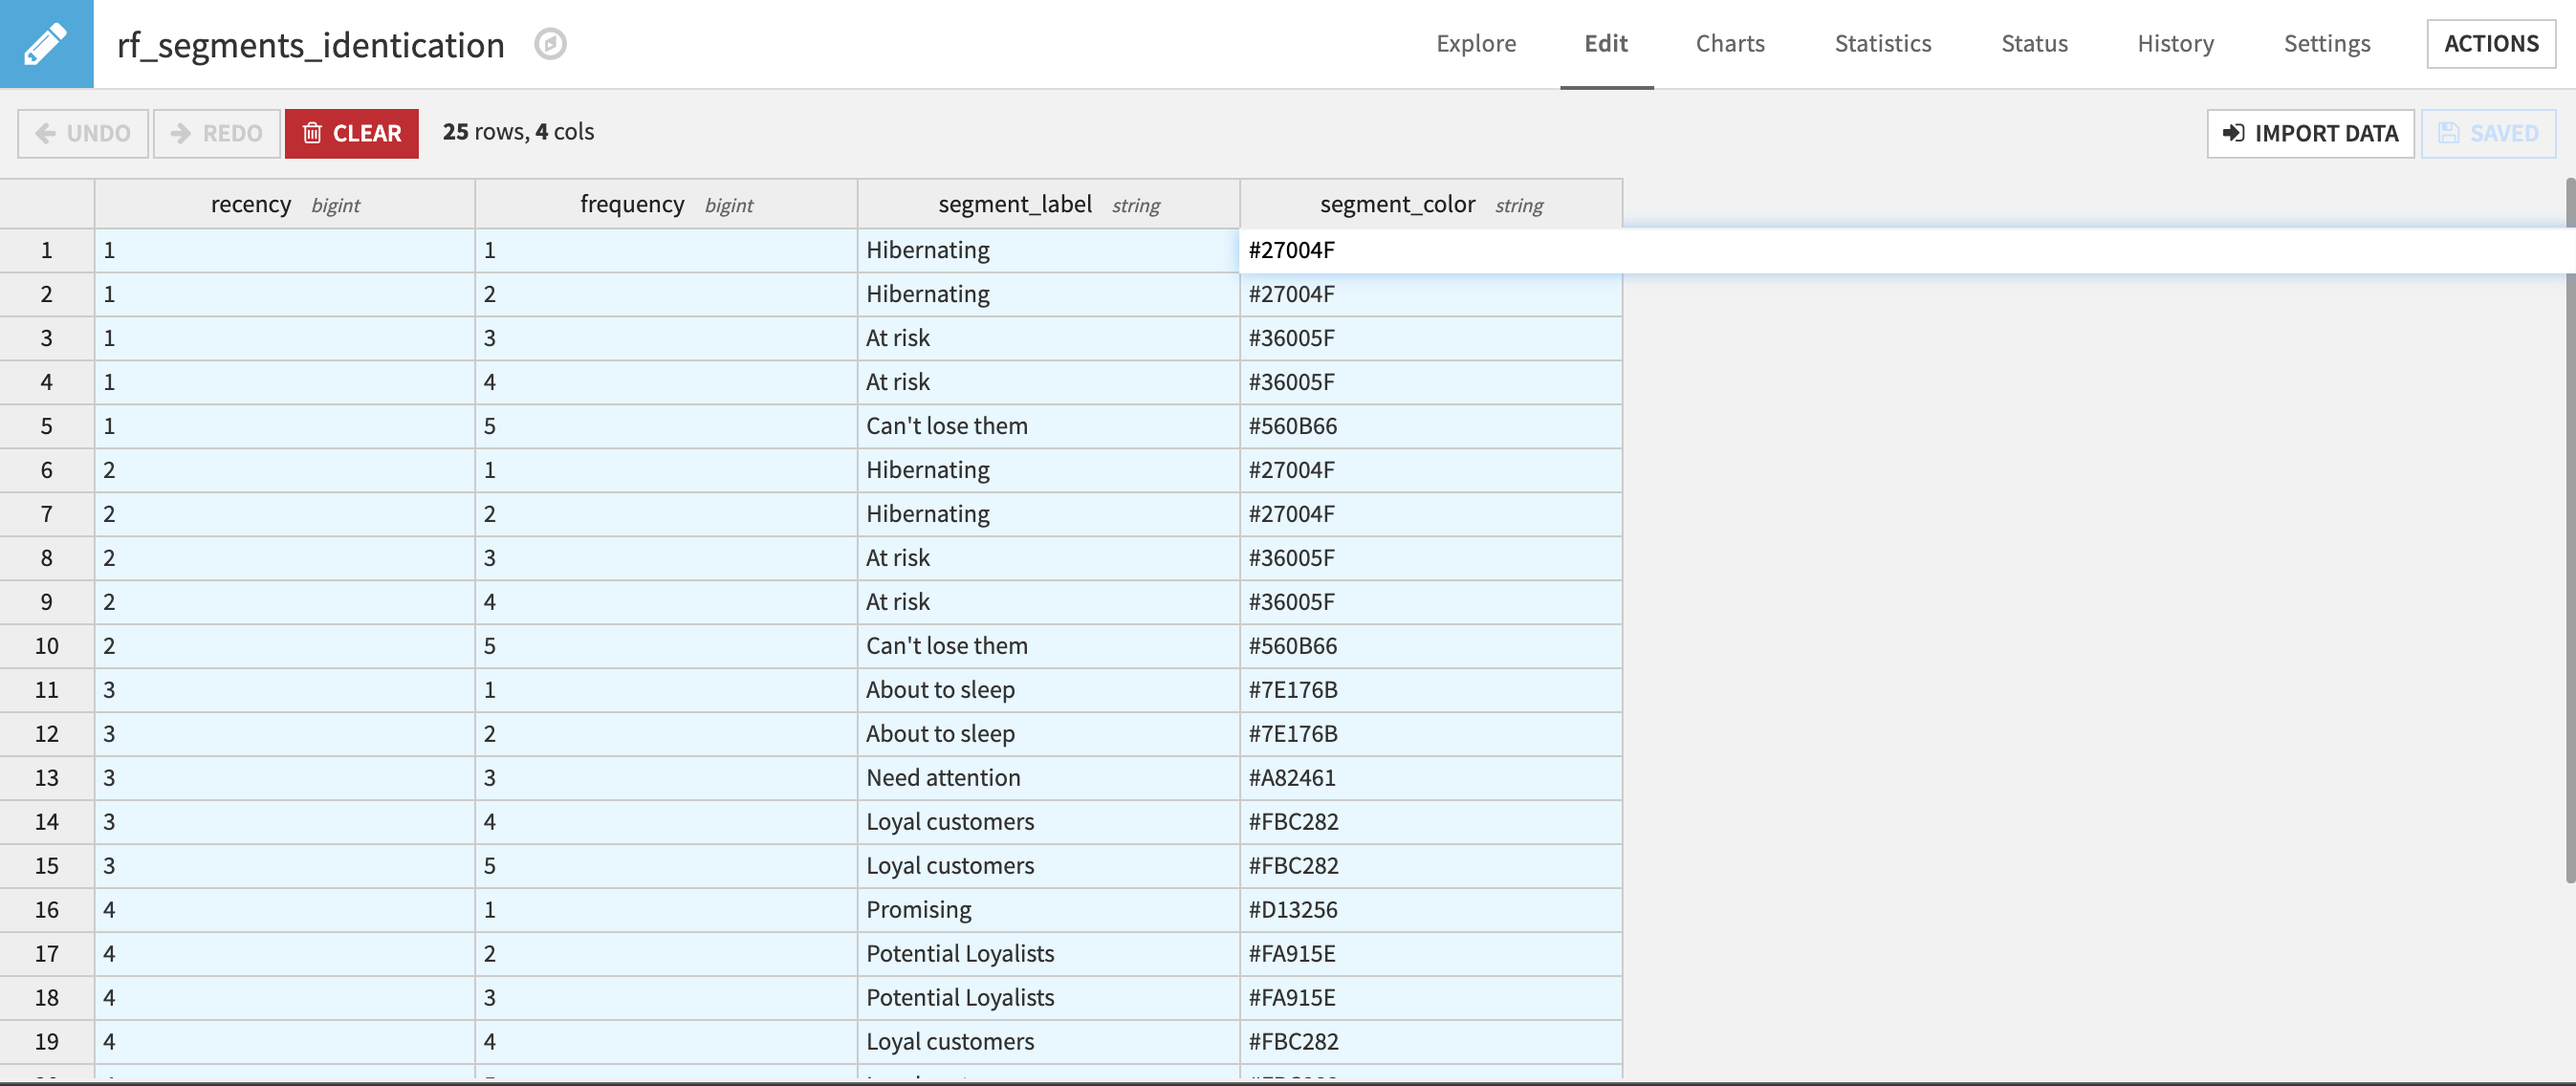
The Inputs_zone contains the transactions_dataset which is populated by ingesting our transactions table defined in the Inputs section of the Application. By default, it contains a publicly available dataset we have provided. Additionally, there is an editable dataset that can be used to tailor the segments applied to customers (name, recency & frequency values, and a color hex code which is used for visualizations). This editable dataset is later synced into a non-editable dataset via the segments_identification_sync flow zone.
The transactions_preprocessing flow zone very simply renames columns, parses the date column if needed, extracts date elements, computes total price per transaction, and retrieves the RFM reference date defined in the Application as a constant to the dataset.
The rfm_preprocessing flow zone takes our prepared transaction dataset and aggregates the transaction data by customer so that we can create the features necessary for RFM scoring. It is in this section that we also filter our transactions based on the period of time we defined in the Dataiku Application as our dates filtering strategy.
We apply our selected RFM scoring method and segment our customers based on this score in the rfm_segmentation flow zone using a single custom python recipe. All customers are scored and segmented by the recipe and the resulting RFM scoring information is stored in a managed folder to be used later for optional propagation. Once again, highly detailed explanations of how this project works as well as reference materials can be found in the project wiki.
Our customer RFM segments are passed along to the webapp_zone which isolates the datasets required for the backend of this solution’s webapps.
Note
If you chose not to propagate RFM scoring you can skip the next section.
Under the Hood: How do we compute propagate RFM scoring?
The secondary branch of our flow which applies our RFM scoring method to a pre-defined propagation period is seemingly more complicated than the first branch detailed above but in practice actually quite straightforward.
We begin with the rfm_propagation_preprocessing flow zone which takes in our prepared transactions dataset and aggregates the transaction data by customer per month. As a result, we get, for each month a customer made a transaction, the features that are used to apply our selected RFM scoring method. We do also filter our transactions based on a period of time but the period is much larger than the one defined by our selected dates filtering strategy.
The rfm_propagation flow zone takes, as an input, the computed customer RFM segments and RFM scoring information output by the rfm_segmentation flow zone and applies RFM segmentation to our customers on a larger period of time. The RFM segments from our reference period are combined with the segments from the propagation period into a single dataset.
In the rfm_propagation_last_dates zone we filter customer RFM data to focus only on the most recent RFM segments and customers present in those recent segments. From this subset of data, we can then identify customers NOT present in the most recently identified segments as inactive customers.
The rfm_propagation_scores zone computes the average RFM score for each month of the propagation period for analysis in the dashboard of month-over-month changes.
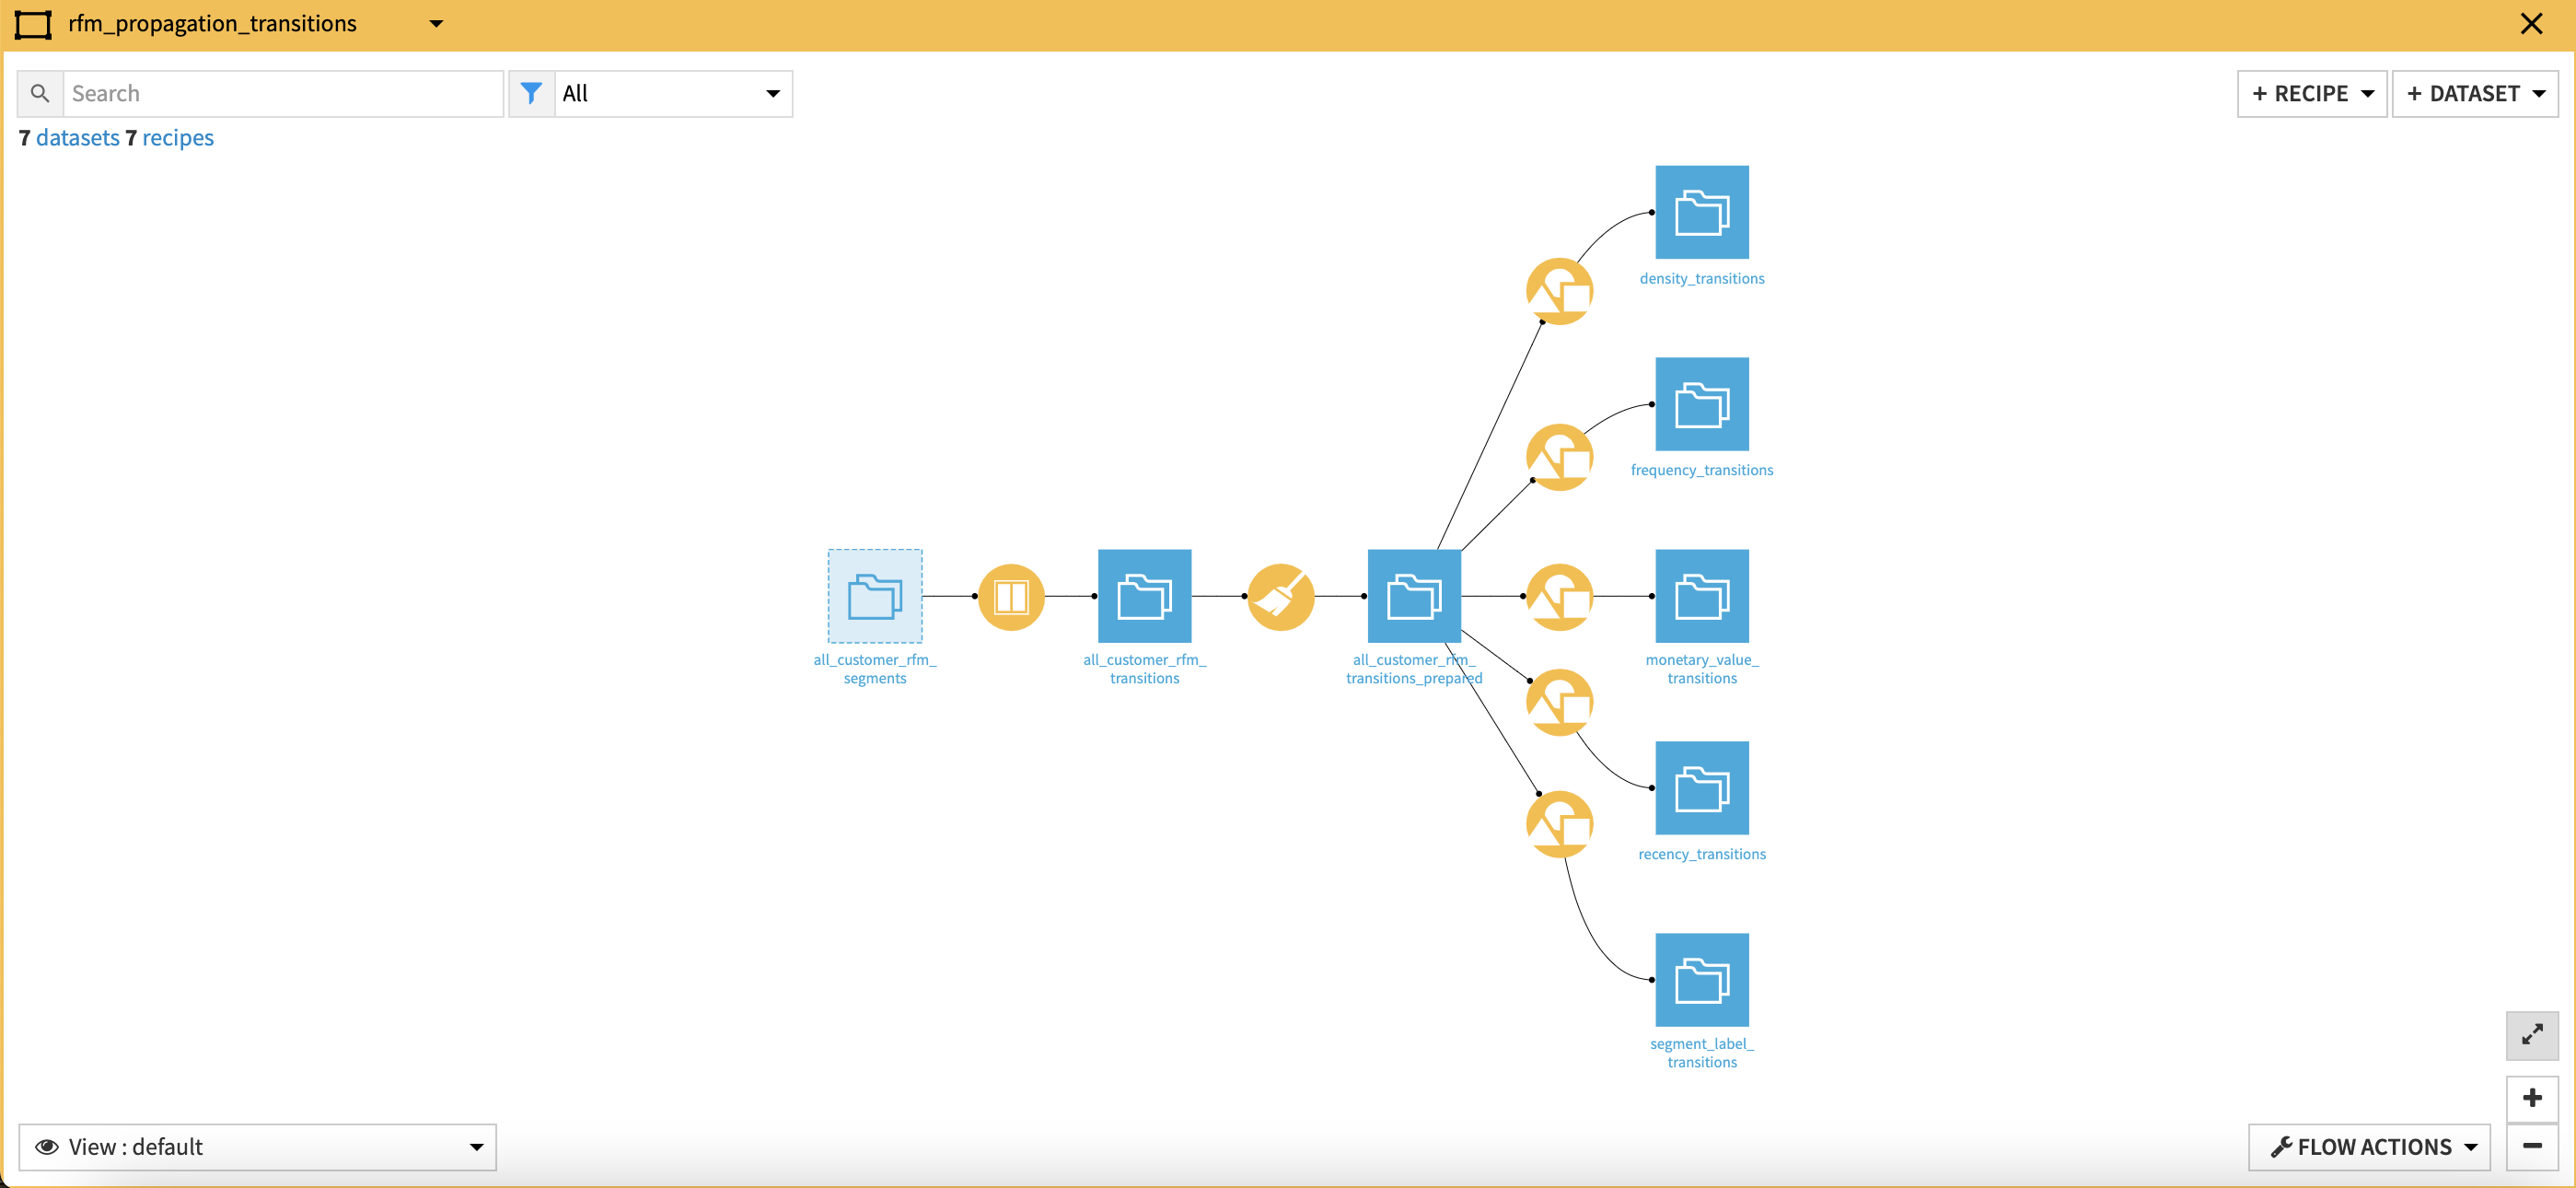
To finish our RFM Propagation analysis, the rfm_propagation_transitions zone computes the transitions between RFM features (Recency, Frequency, Monetary) as well as the transitions between RFM segments before splitting the dataset into individual datasets per feature/segment so that we can analyze all transitions across multiple axes.
Finally, the webapp_zone isolates the datasets required for the backend of this solution’s webapps.
Further explore your association rules with shareable visualizations
The RFM Segmentation solution comes with two prebuilt dashboards. If your RFM Propagation was disabled only the RFM Segmentation dashboard will work. We will begin by walking through what is available in this dashboard.
The RFM Segments explorer delivers a pre-built webapp that enables us to explore the distribution of customers within our RFM segments. If this slide shows an error or is blank you may need to restart the Webapp backend. Clicking on the Application Helpers menu will open a FAQ to enable more guided usage of the Webapp. The colors used for each customer segment and monetary value are defined in the editable dataset of the Inputs section and within the project variables, respectively.
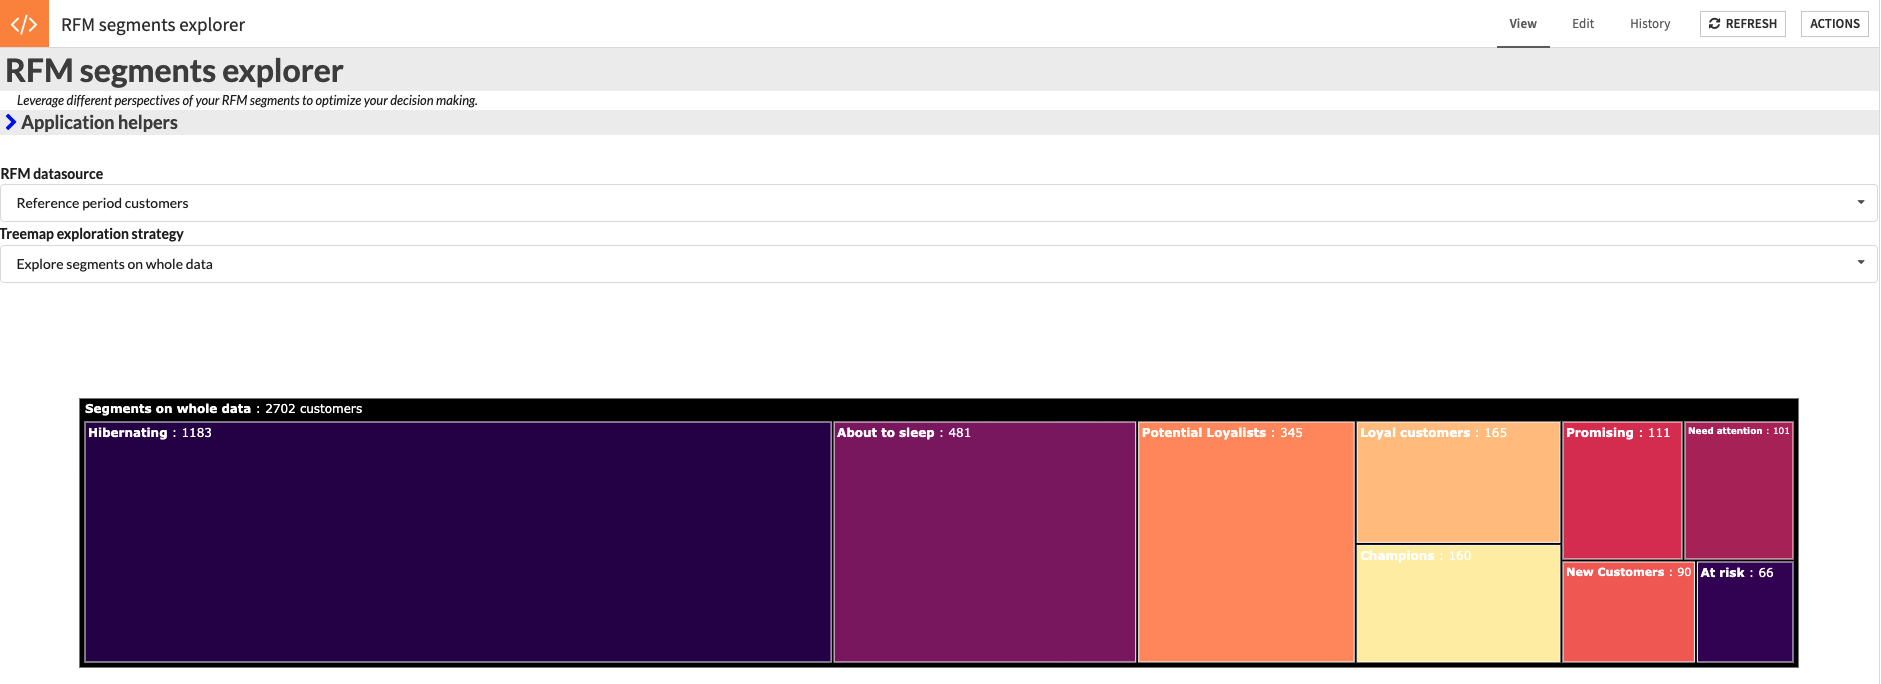
If RFM Propagation was enabled, we can select between our reference period customers, most recent dates customers, and inactive customers as the data source for our Webapp analysis.
The Treemap exploration strategy lets you choose between 3 different types of analysis:
Analyzing segments on whole data shows customer segments based only on Recency and Frequency while ignoring their monetary value.
Analyzing segments by monetary value relative importance shows the customer segments based on their Recency and Frequency but additionally groups them by their respective monetary value.
Analyzing segments split by monetary value creates individual treemaps for a specific monetary value that can be selected/deselected, of the Recency and Frequency segments occurring in your dataset.
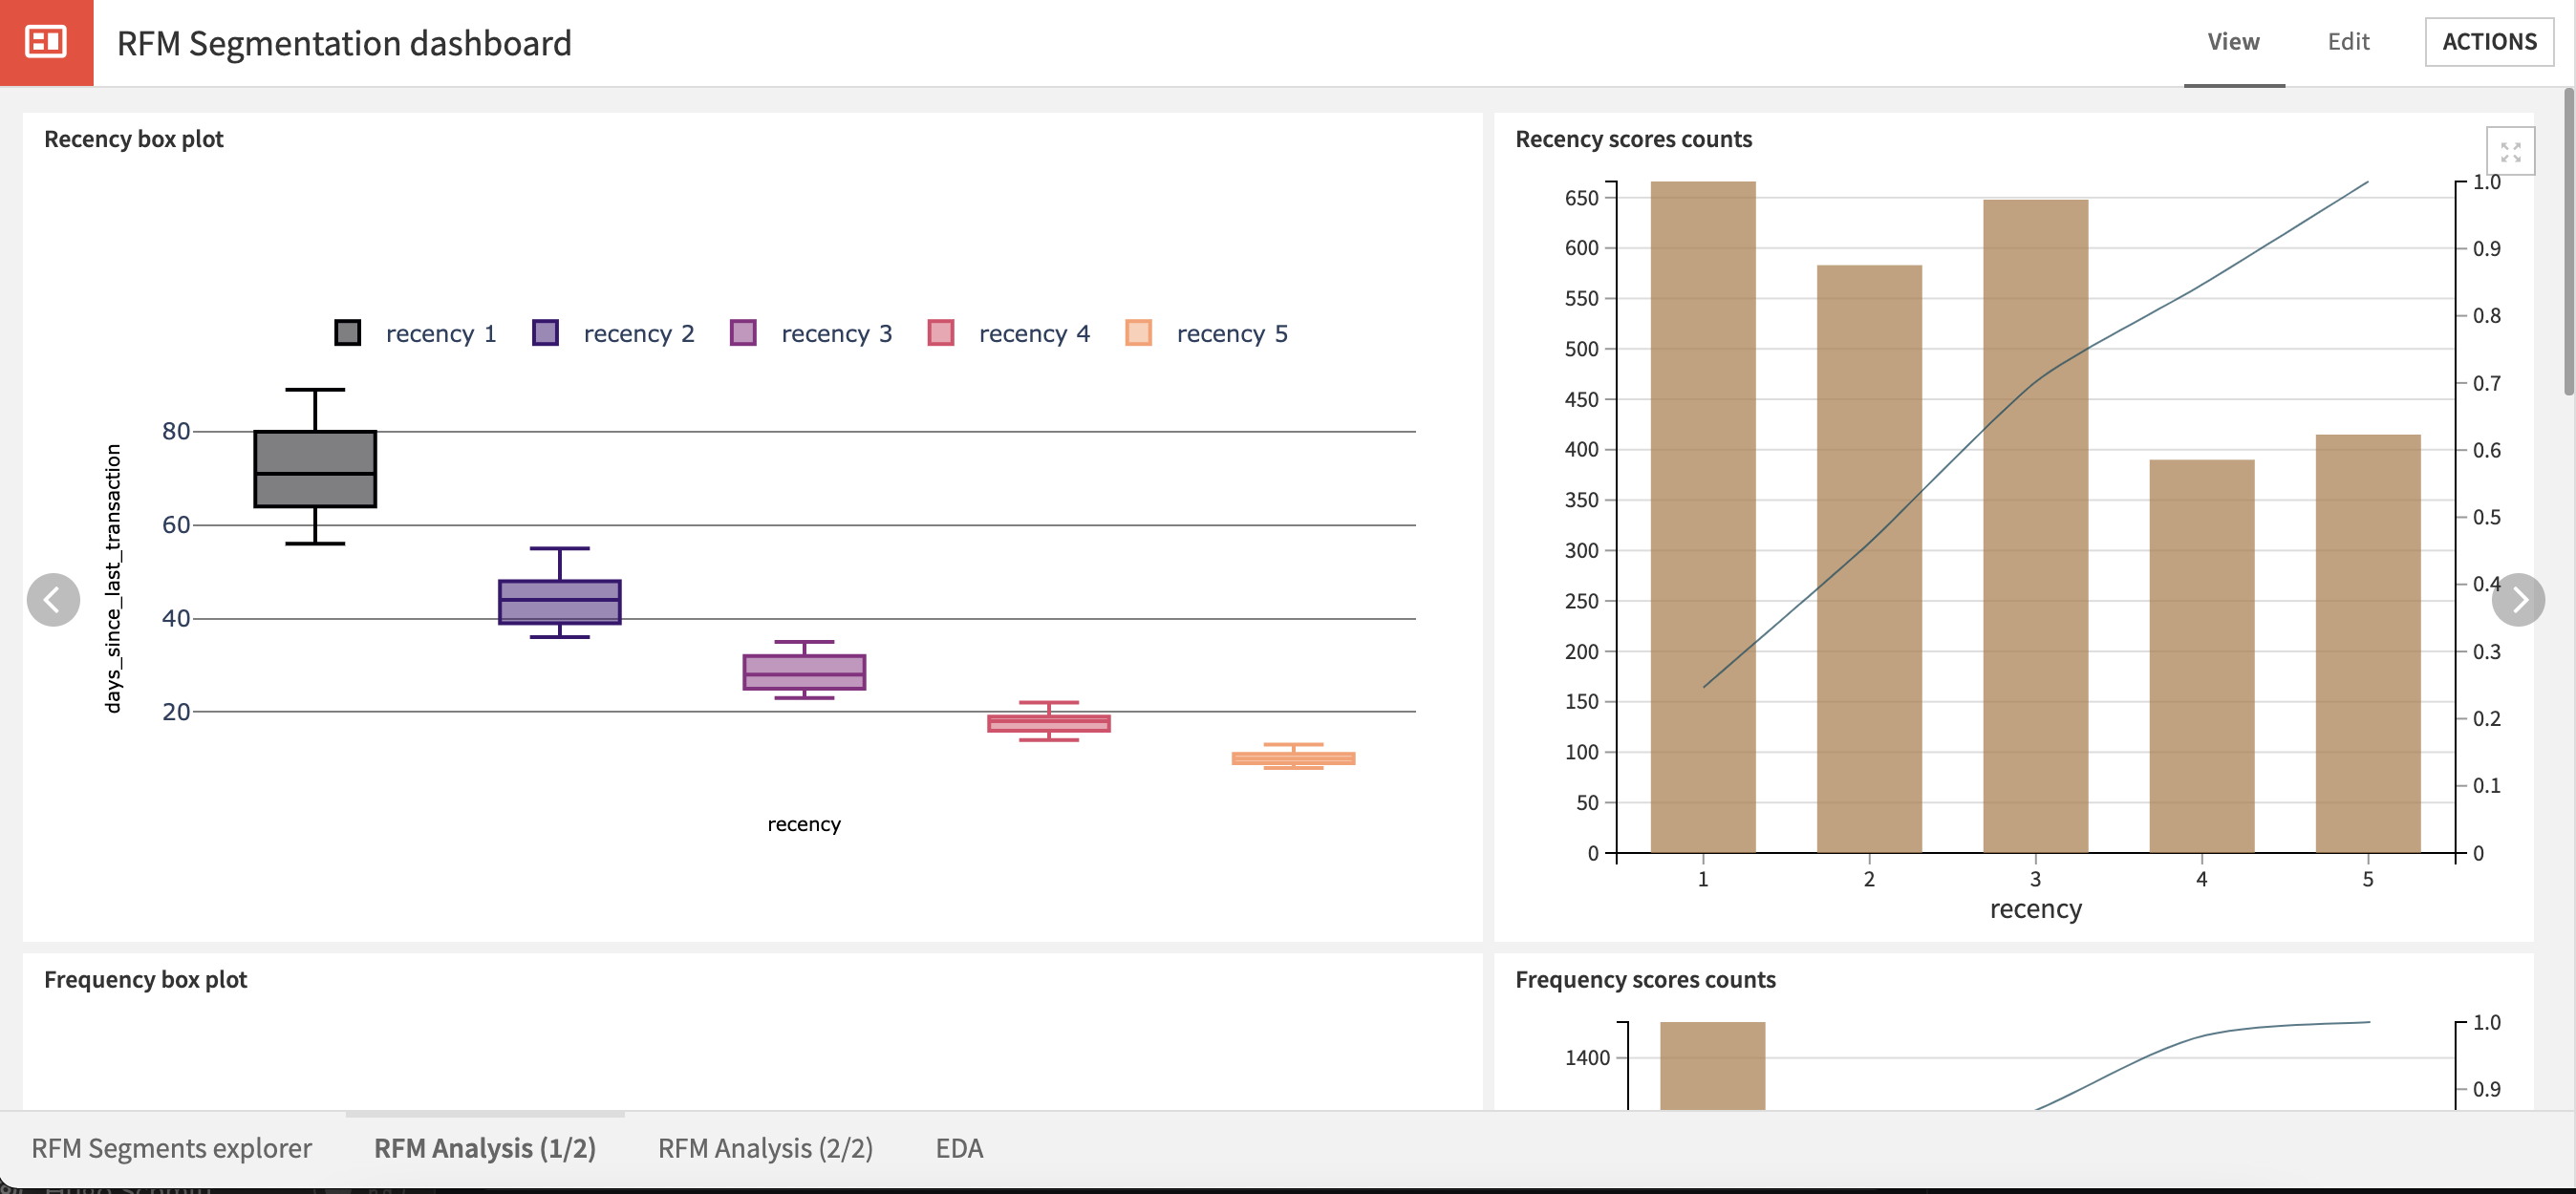
Two tabs are made available to analyze our RFM scores - the first focuses on understanding the composition and occurrences of our RFM scores while the second tab contextualizes the RFM segments in a more global view. Lastly, the EDA tab presents univariate and bivariate analyses of the RFM core information (i.e. the customer features we leverage to assess their RFM scoring).
Assuming RFM Propagation was enabled, we can also have access to the RFM Propagation dashboard containing two slides:
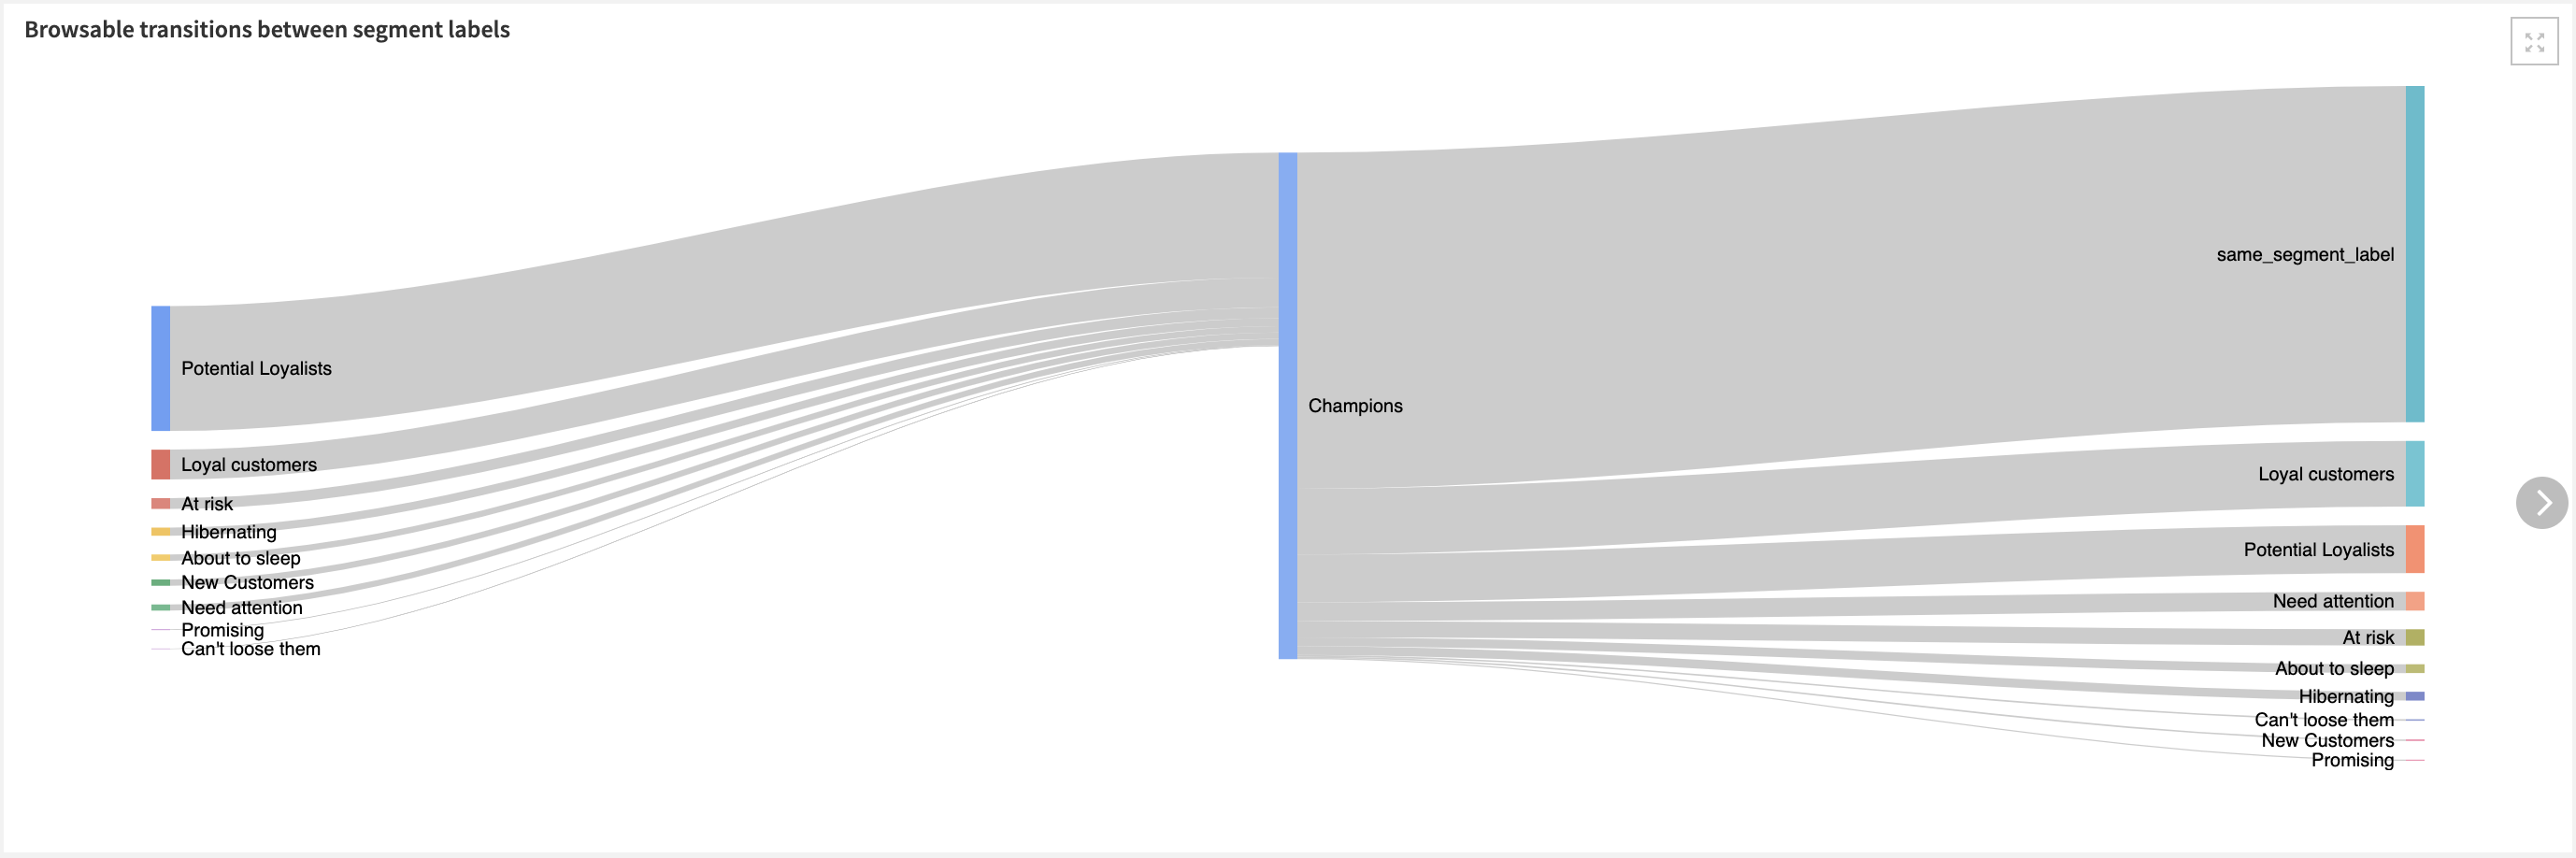
The RFM transitions tab uses a Sankey diagram to see the transitions occurring between RF segment labels (defined in the originating editable dataset). The chart is centered around customers classified as “Champions” so on the left side we can see all customer segments from which “Champions” originated while the right side shows other segments that our customers tend to transition to once they are Champions. There are additional charts in this tab to see transitions between:
Recency Scores
Frequency Scores
Monetary Value Scores
Density Scores
The RFM scores over time tab allows us to see the evolution of a variety of scores over time with bar colors indicating the period when these scores were computed. The scores over time include:
RFM Scores
RFMD Scores
Recency Scores
Frequency Scores
Monetary Value Scores
Density Scores
A short note on automation
As mentioned in the Dataiku Application section of this article, it is possible to automate the flow of this solution to be triggered based on new data, a specific time, etc. All of these trigger parameters can be tuned in the Scenarios menu of the project. Additionally, reporters can be created to send messages to Teams, Slack, email, etc. to keep our full organization informed. These scenarios can also be run ad-hoc as needed. Full detail on the scenarios and project automation can be found in the wiki.
Reproducing these Processes With Minimal Effort For Your Own Data
The intent of this project is to enable marketing teams to have a plug-and-play solution built with Dataiku to segment customers by their RFM scores. By creating a singular solution that can benefit and influence the decisions of a variety of teams in a single organization, smarter and more holistic strategies can be designed in order to optimize customer retention, identify at-risk customers, improve customer communication, and adapt marketing strategies to customer segment distributions.
We’ve provided several suggestions on how to use transaction data to segment your customers but ultimately the “best” approach will depend on your specific needs and your data. If you’re interested in adopting this project to the specific goals and needs of your organization, roll-out and customization services can be offered on demand.