Concept: Pivot Recipe
The Pivot Recipe transforms datasets into pivot tables, which are tables of summary statistics. This operation can also be referred to as reshaping from long to wide format.
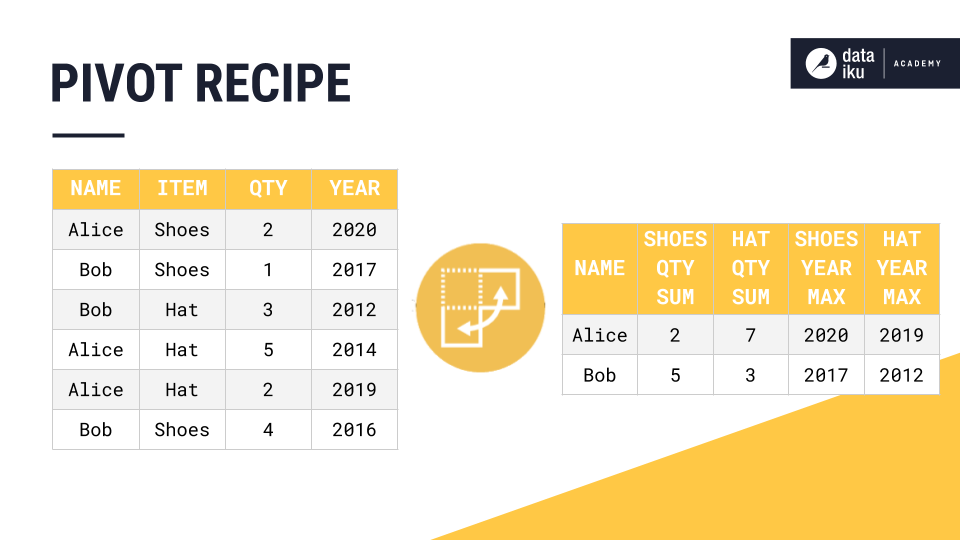
In the following example, we will use a Pivot Recipe to extract some useful statistics from a table of retail transactions. Specifically, we want to calculate the total number of items purchased as well as the most recent year of purchase for each customer.
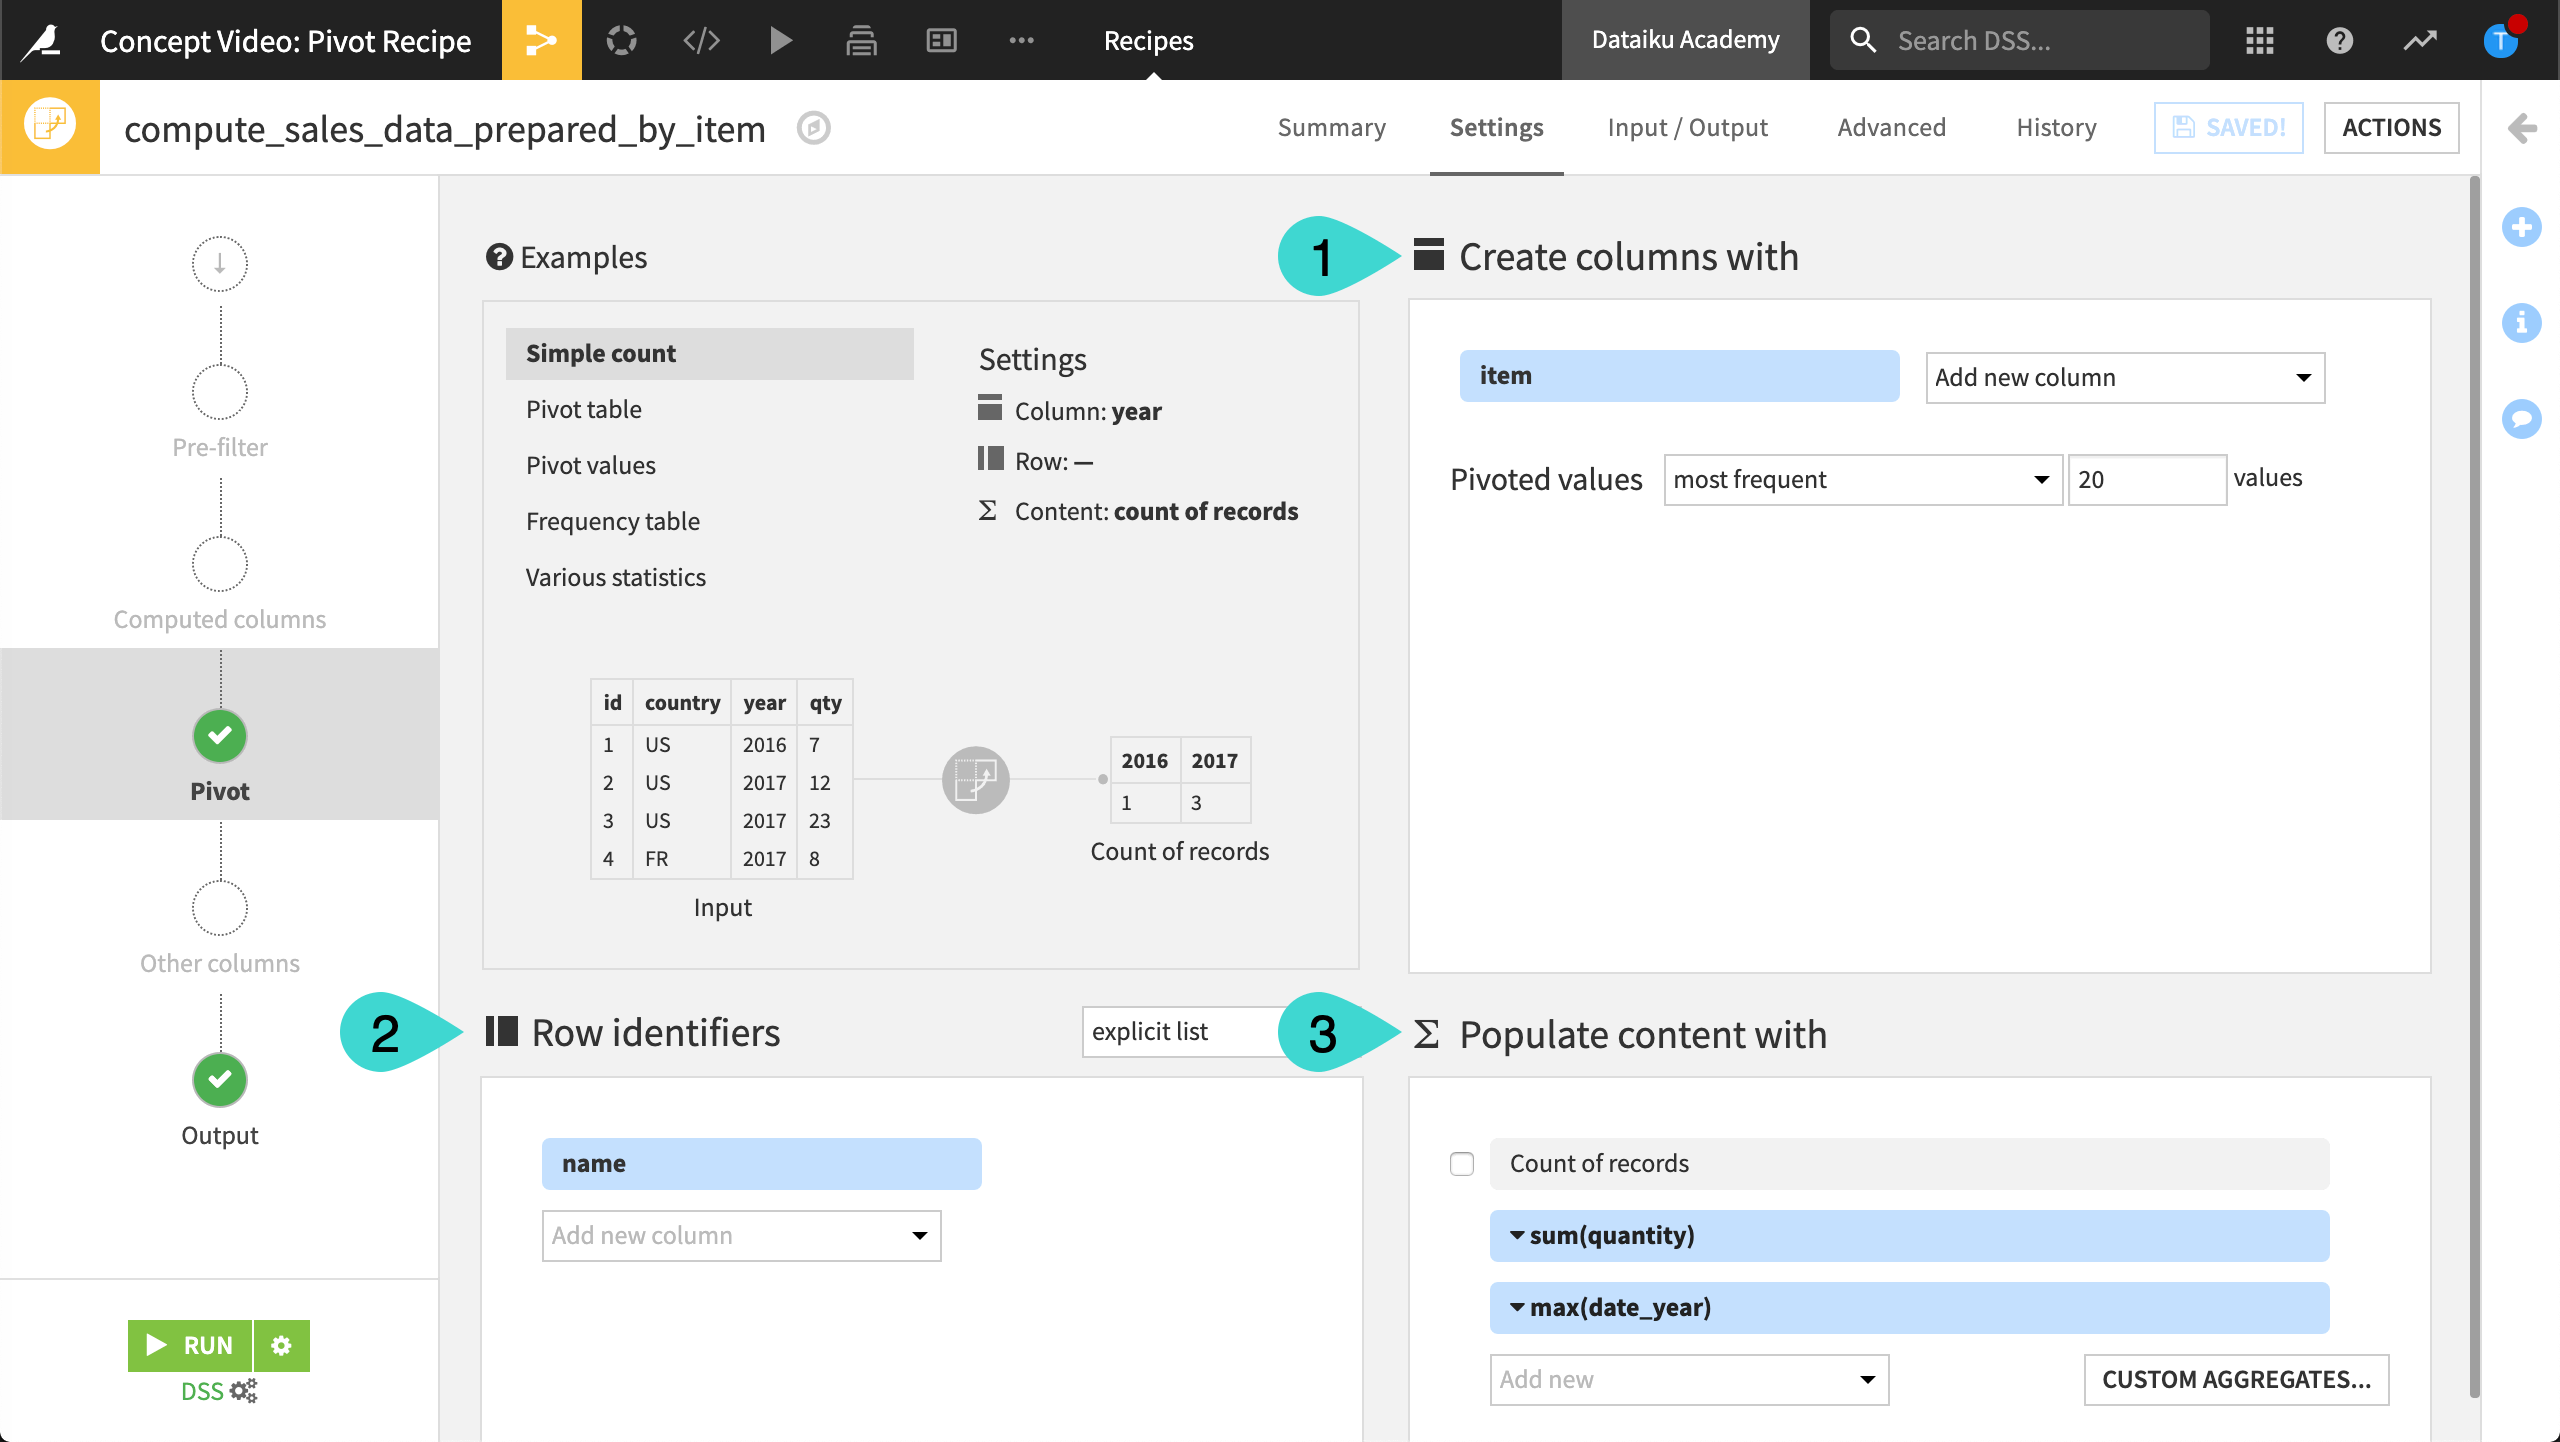
To do this, we’ll need to configure the Pivot Recipe. The three main components of the Pivot Recipe are Pivot, Group Key, and Aggregations. The pivot determines the reshaping of a dataset into a pivot table. Specifically, we decide which rows we want to transform into columns. The group keys, or row identifiers, determine the rows of a pivot table. Finally, we decide which columns contain values that we want to aggregate.
In our example, we first select to pivot by the item column, then choose to use the name column as the group key, and finally we tell DSS to compute aggregations for the quantity and year columns.
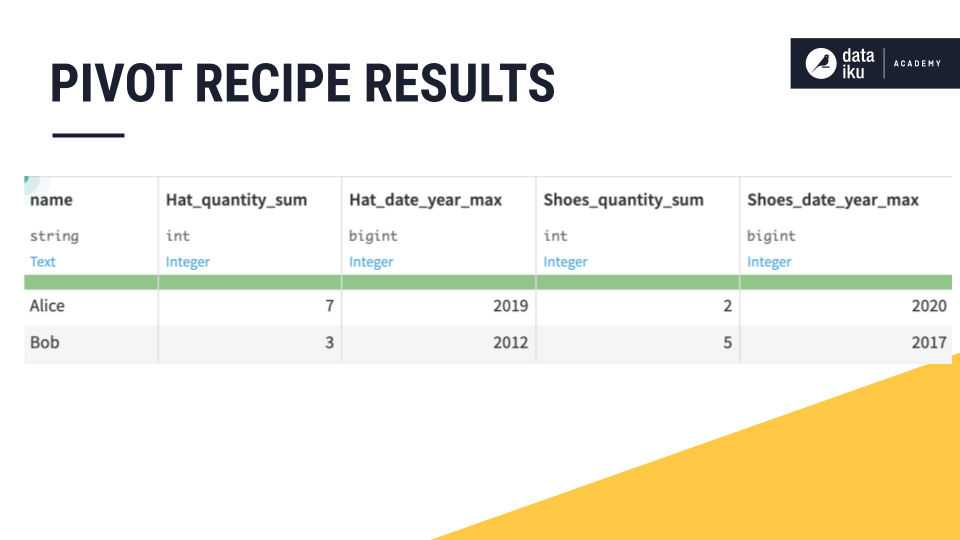
As a result, our pivot table displays aggregates on hat and shoe categories using Alice and Bob as the pivot table row identifiers. Our pivot table displays the aggregations we selected for the quantity and year columns.