How-To: “What-If Accelerators” Counterfactual and Actionable Recourse
Once you have a prediction model along with predictions, you might want to find out what changes would yield a different outcome. Knowing what inputs to change and how much to change them in order to impact a specific outcome is valuable information.
In Crash Course in Dataiku DSS 9, we learned about interactive scoring and how to set up interactive scoring for a dashboard consumer. “What-if” accelerators take interactive scoring one step further.
“What-if” accelerators can help determine the stability of the prediction given certain changes in the input values and answer questions such as, “How different could these inputs be while still maintaining the same prediction probability?”; and, “What differences in inputs would lead to a different prediction altogether?”.
To illustrate, we’ll create two analyses for a subscription business company using customer churn data:
First, we’ll use counterfactuals to explore sample records similar to our reference record, but with small changes that cause the model to predict any different outcome class than the original prediction.
Then, we’ll use actionable recourse to select a specific prediction class we’re interested in achieving, and explore sample records that have been altered enough from our reference record input values to influence that particular outcome in which we’re interested.
Counterfactuals
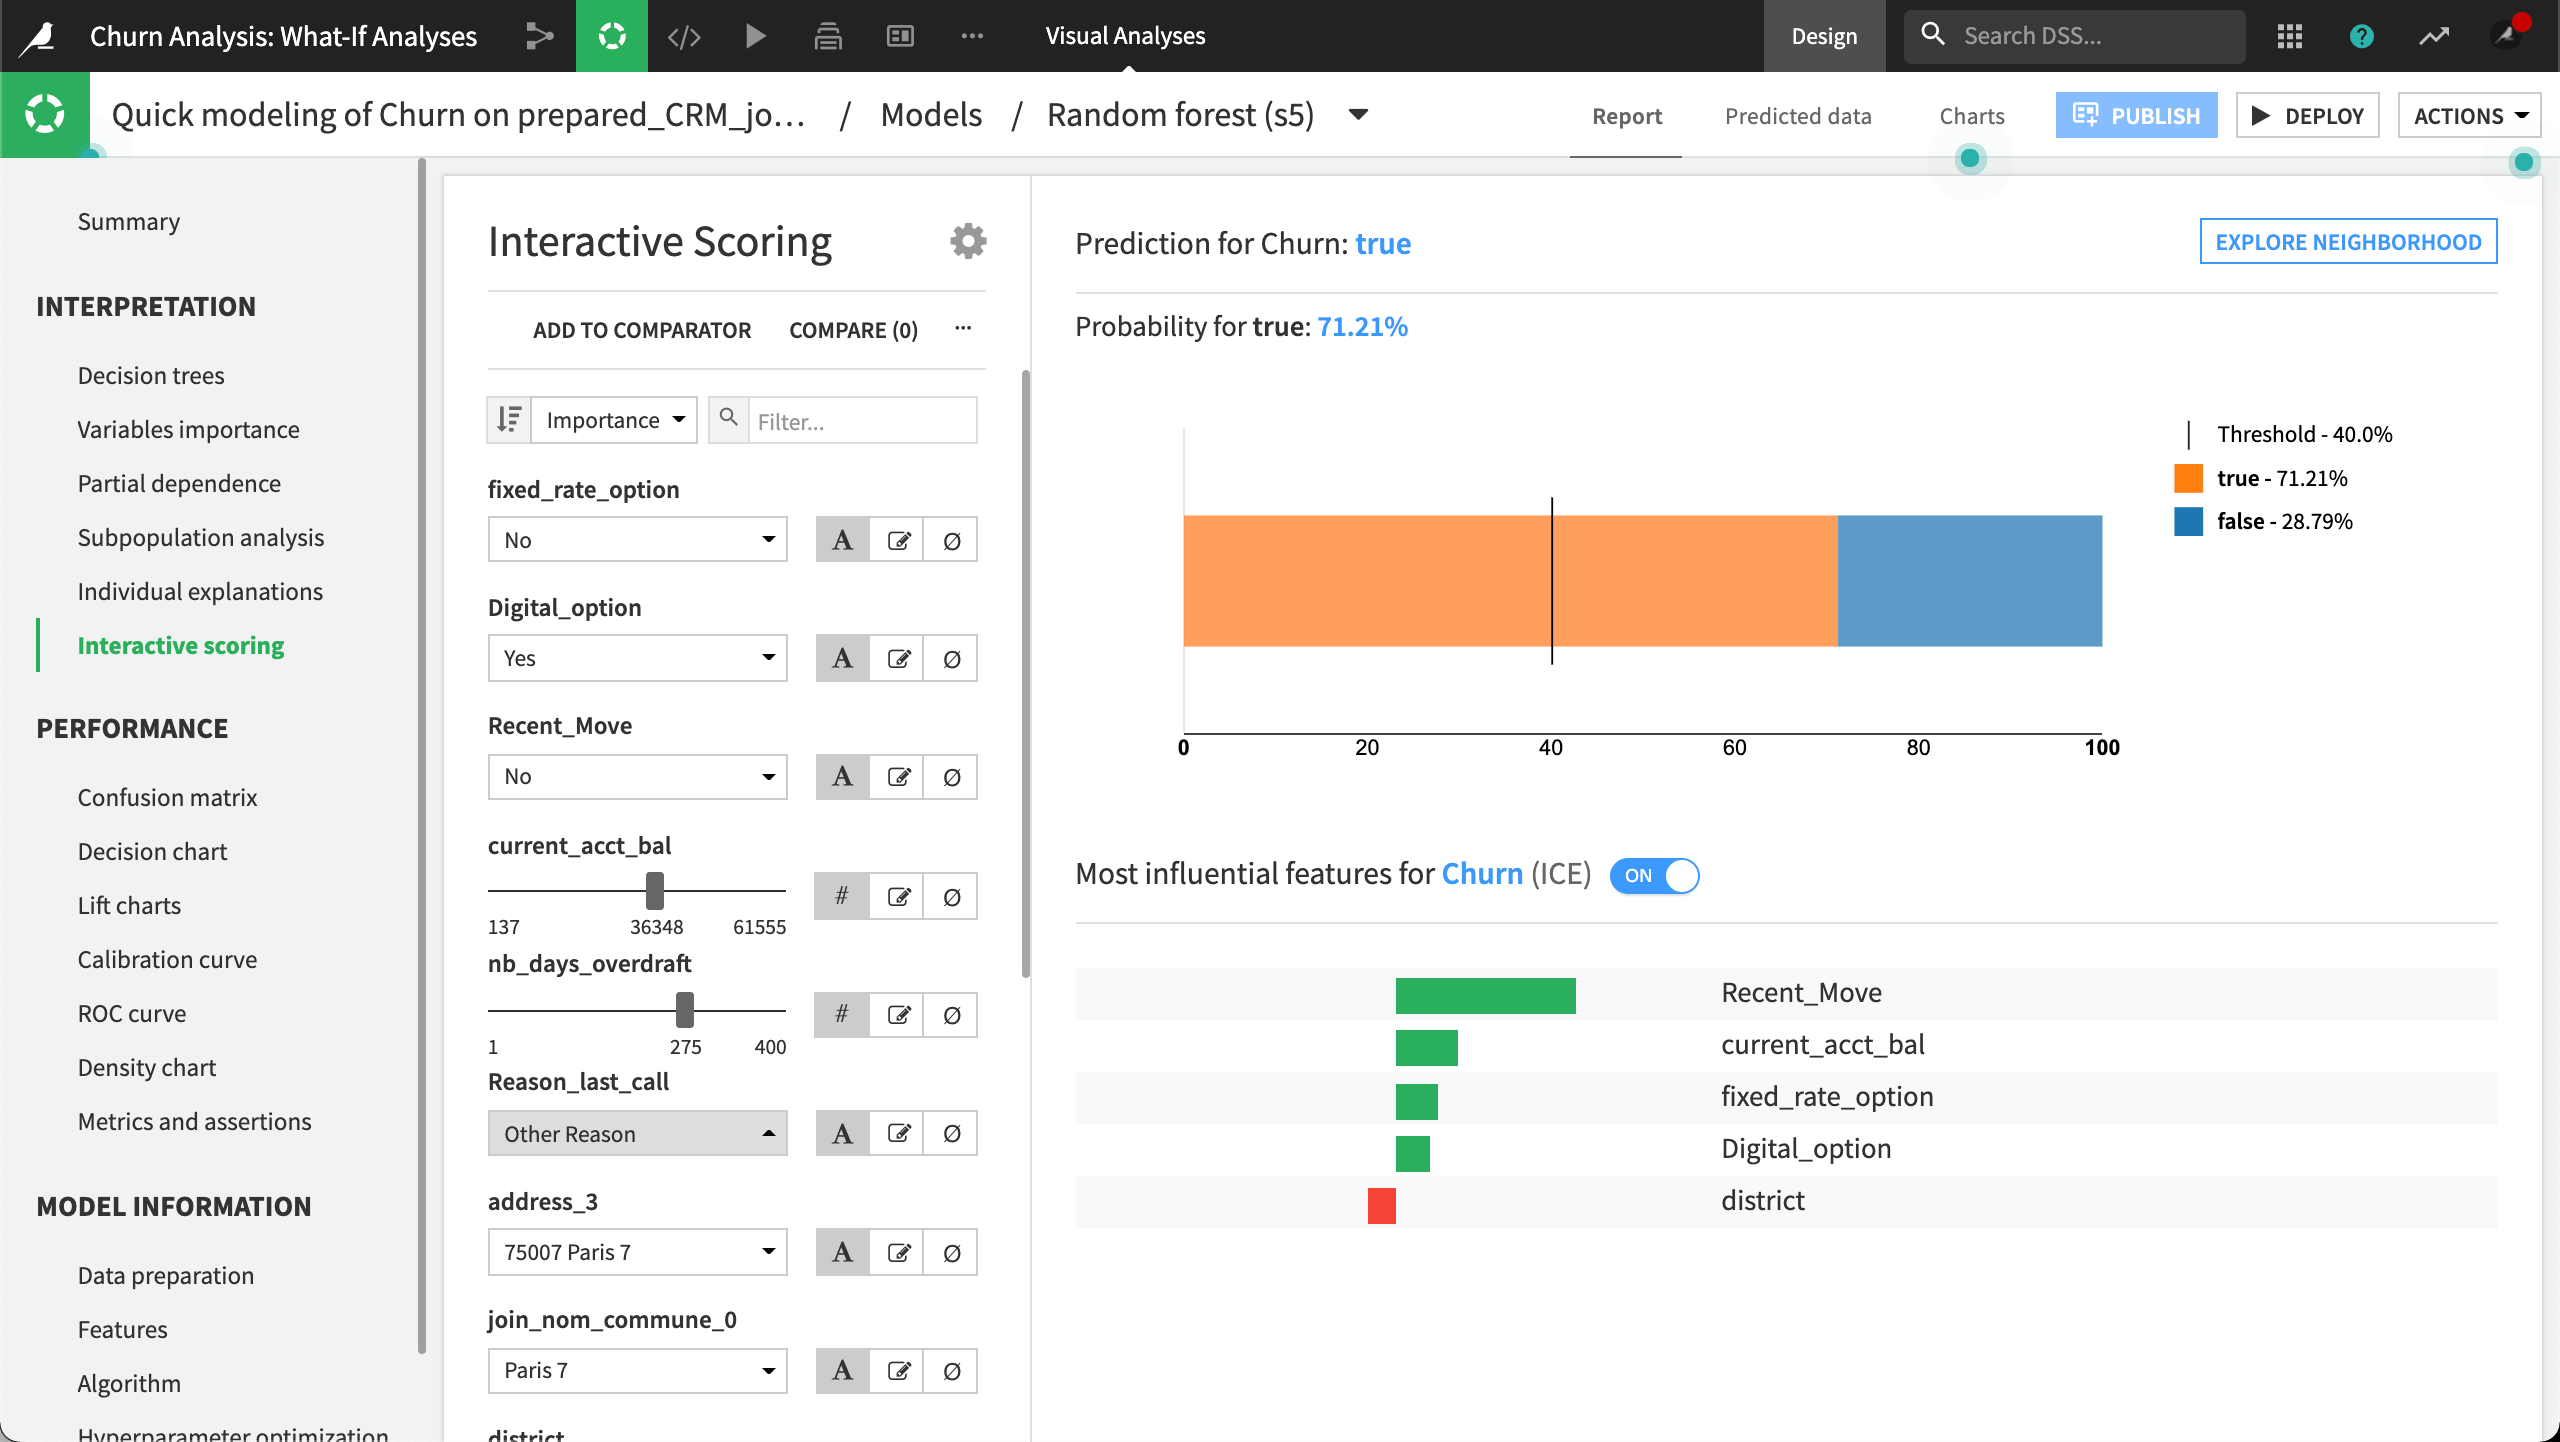
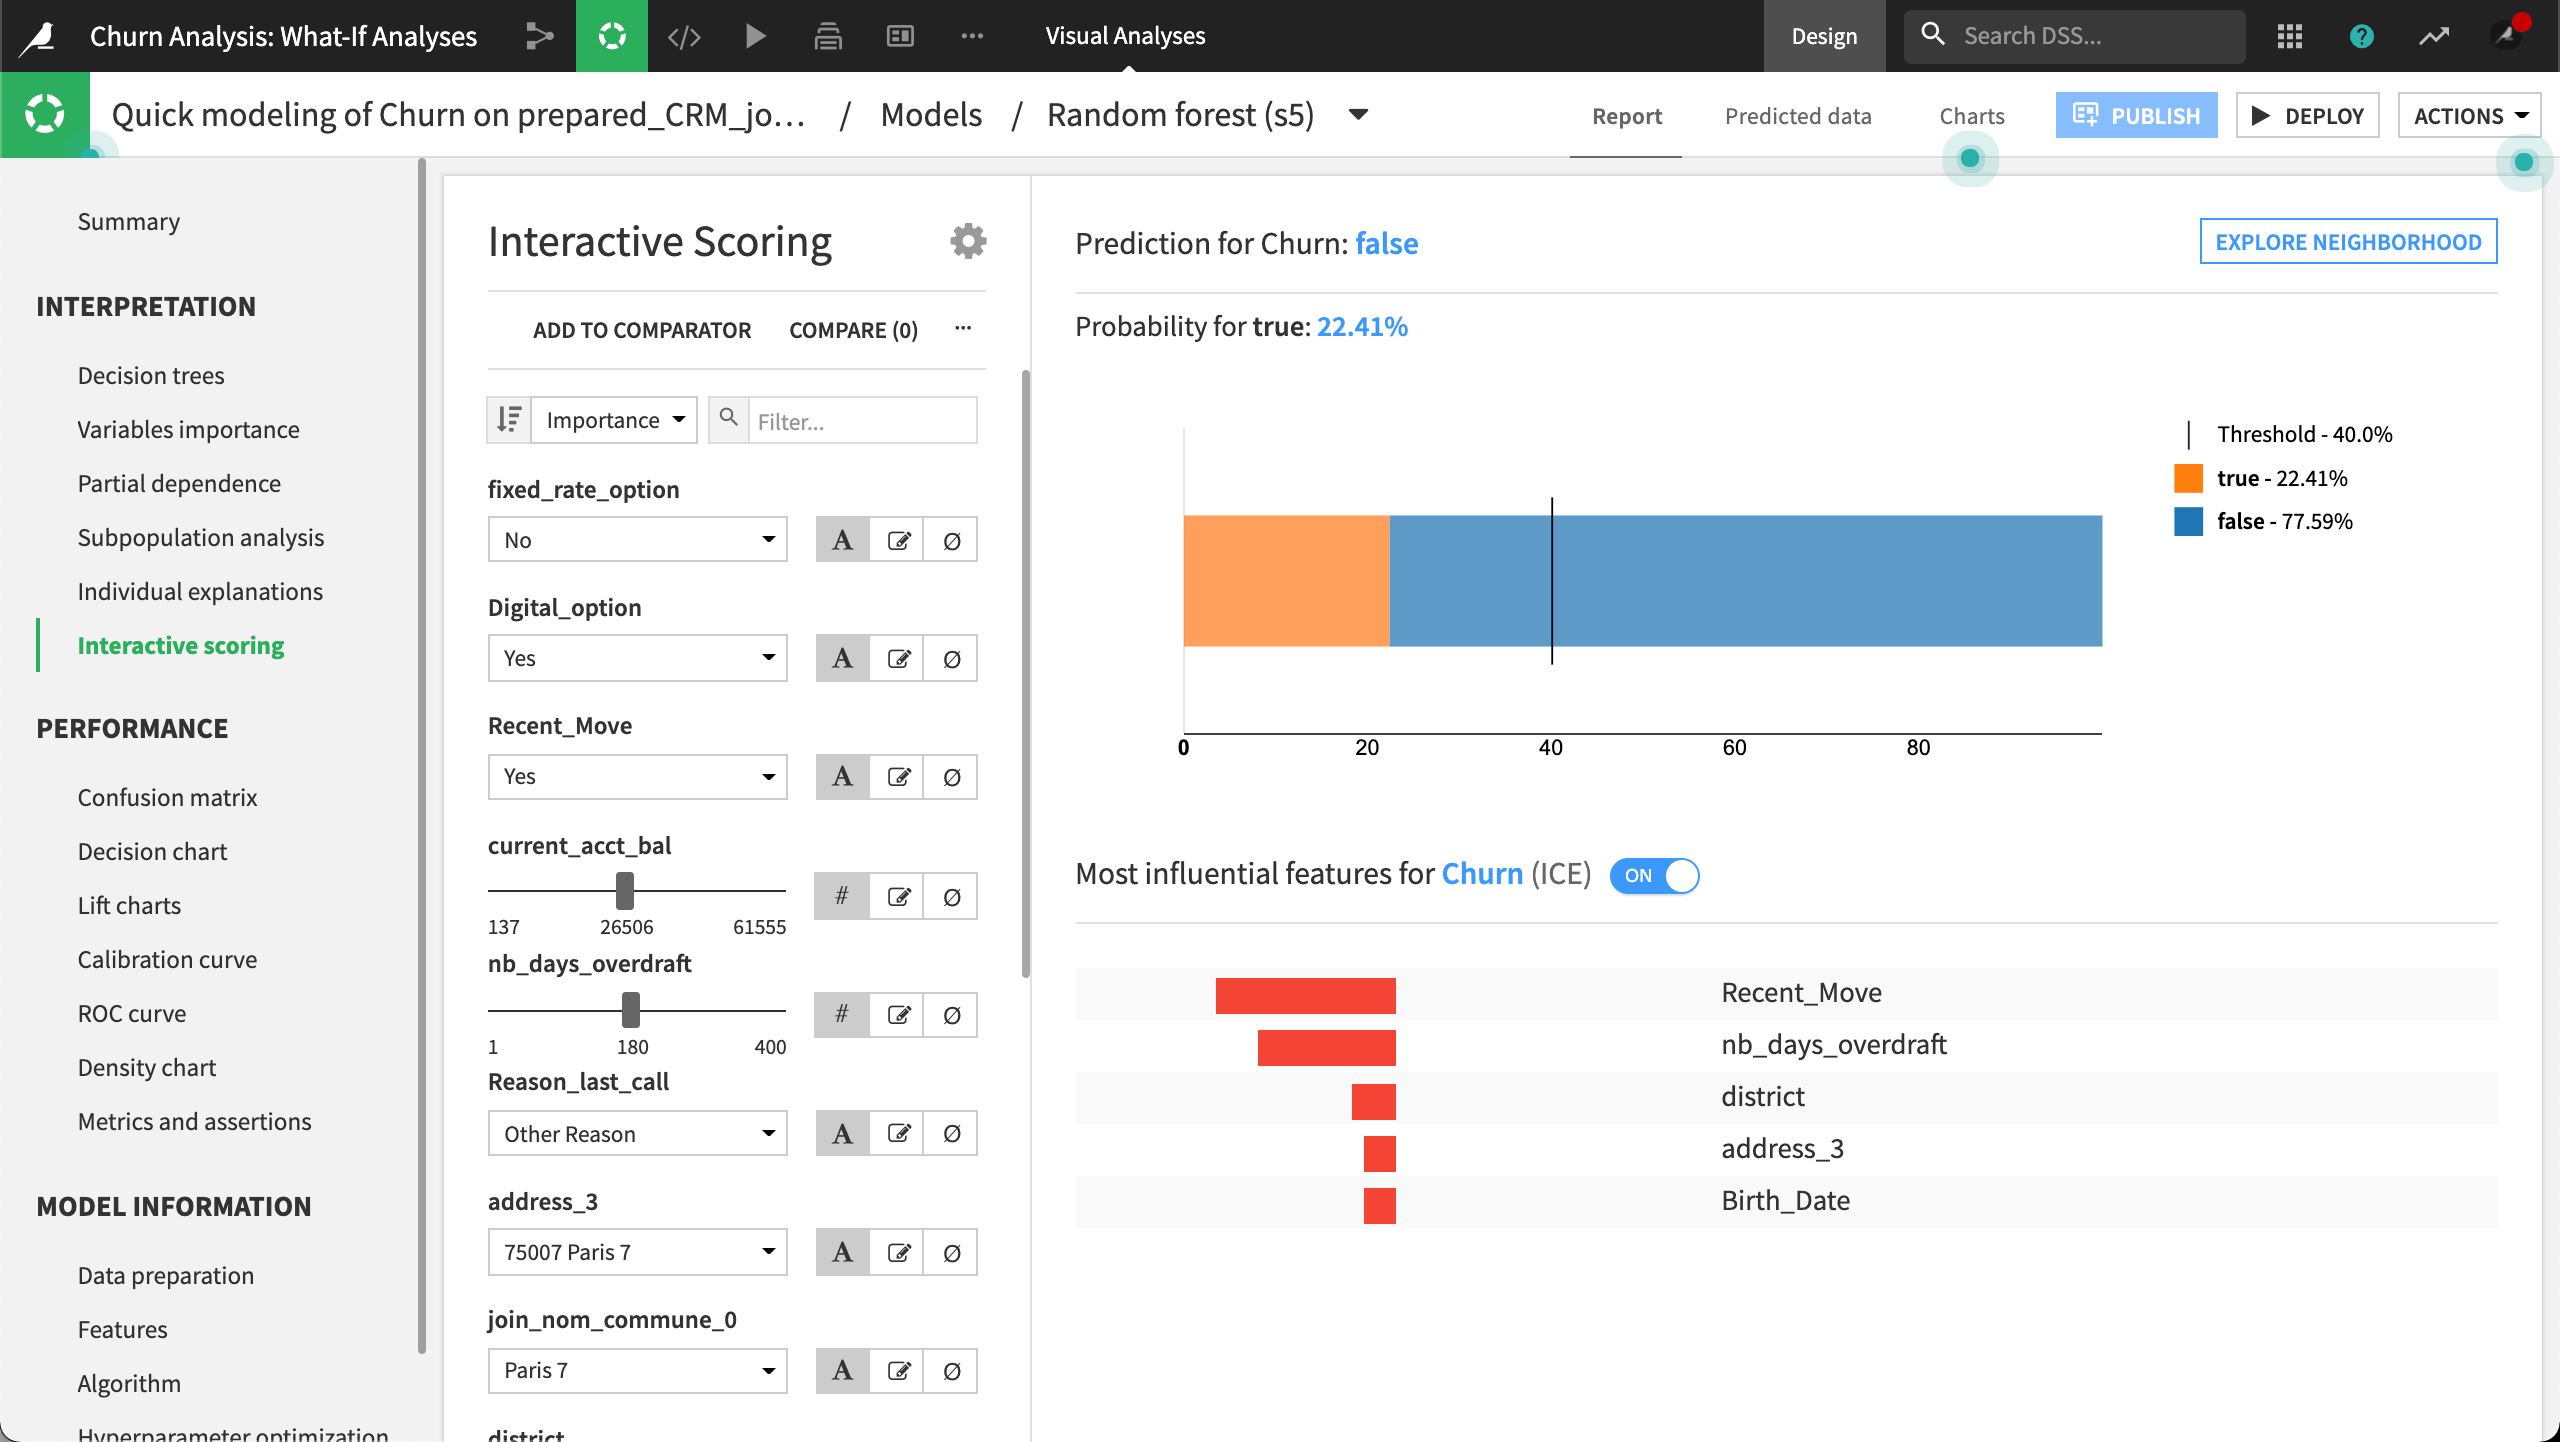
To begin, we’ve created an example, or “reference record”, using the interactive scoring simulator. More specifically, we’ve used interactive scoring to see what the model will predict when certain changes are made to features like recent_move, current_acct_bal, and nb_days_overdraft.
For this particular reference record, the results show that the probability of churning is approximately 71%, given our inputs.
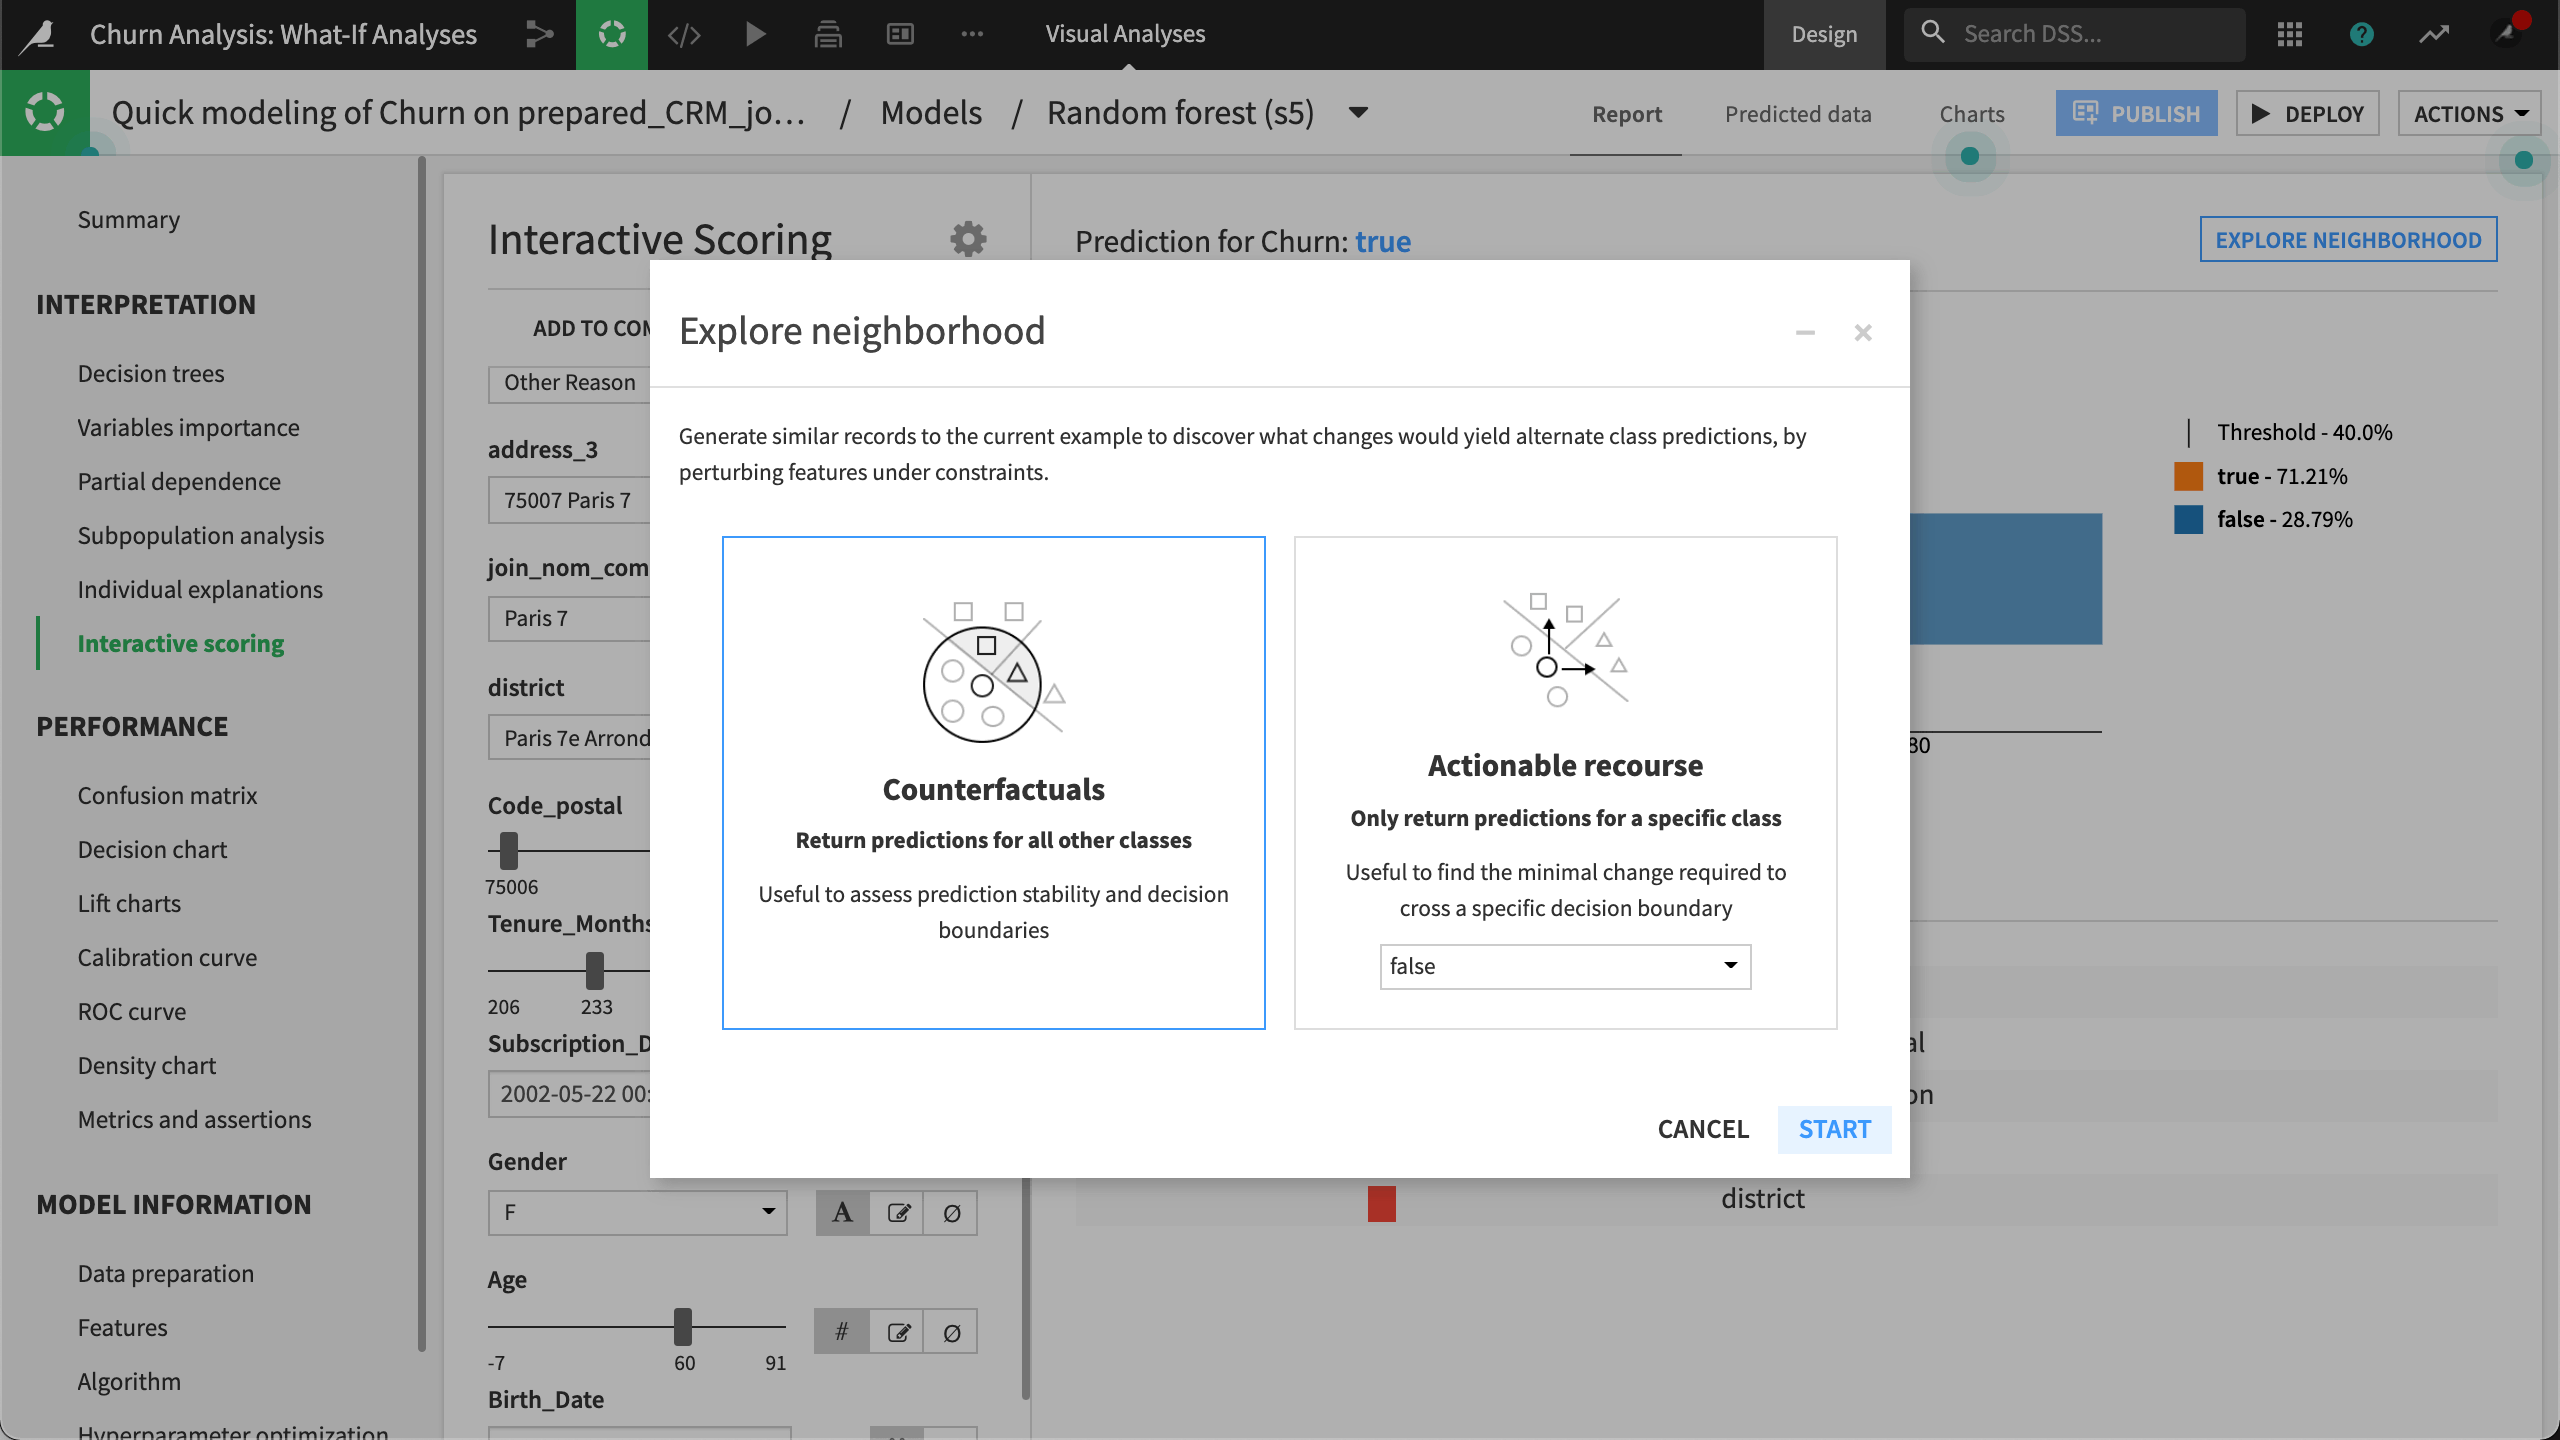
Exploring lots of similar records in this way could get tedious. To automate this task, we’ll explore the neighborhood and look at counterfactuals.
In the Interactive scoring / Counterfactuals panel, we can configure each actionable feature’s minimum and maximum restraints.

Once we click Compute, Dataiku systematically computes new samples using the actionable features and the specified restraints. The resulting samples represent observations that could happen but have not necessarily been seen in the training dataset, each with its plausibility measure.
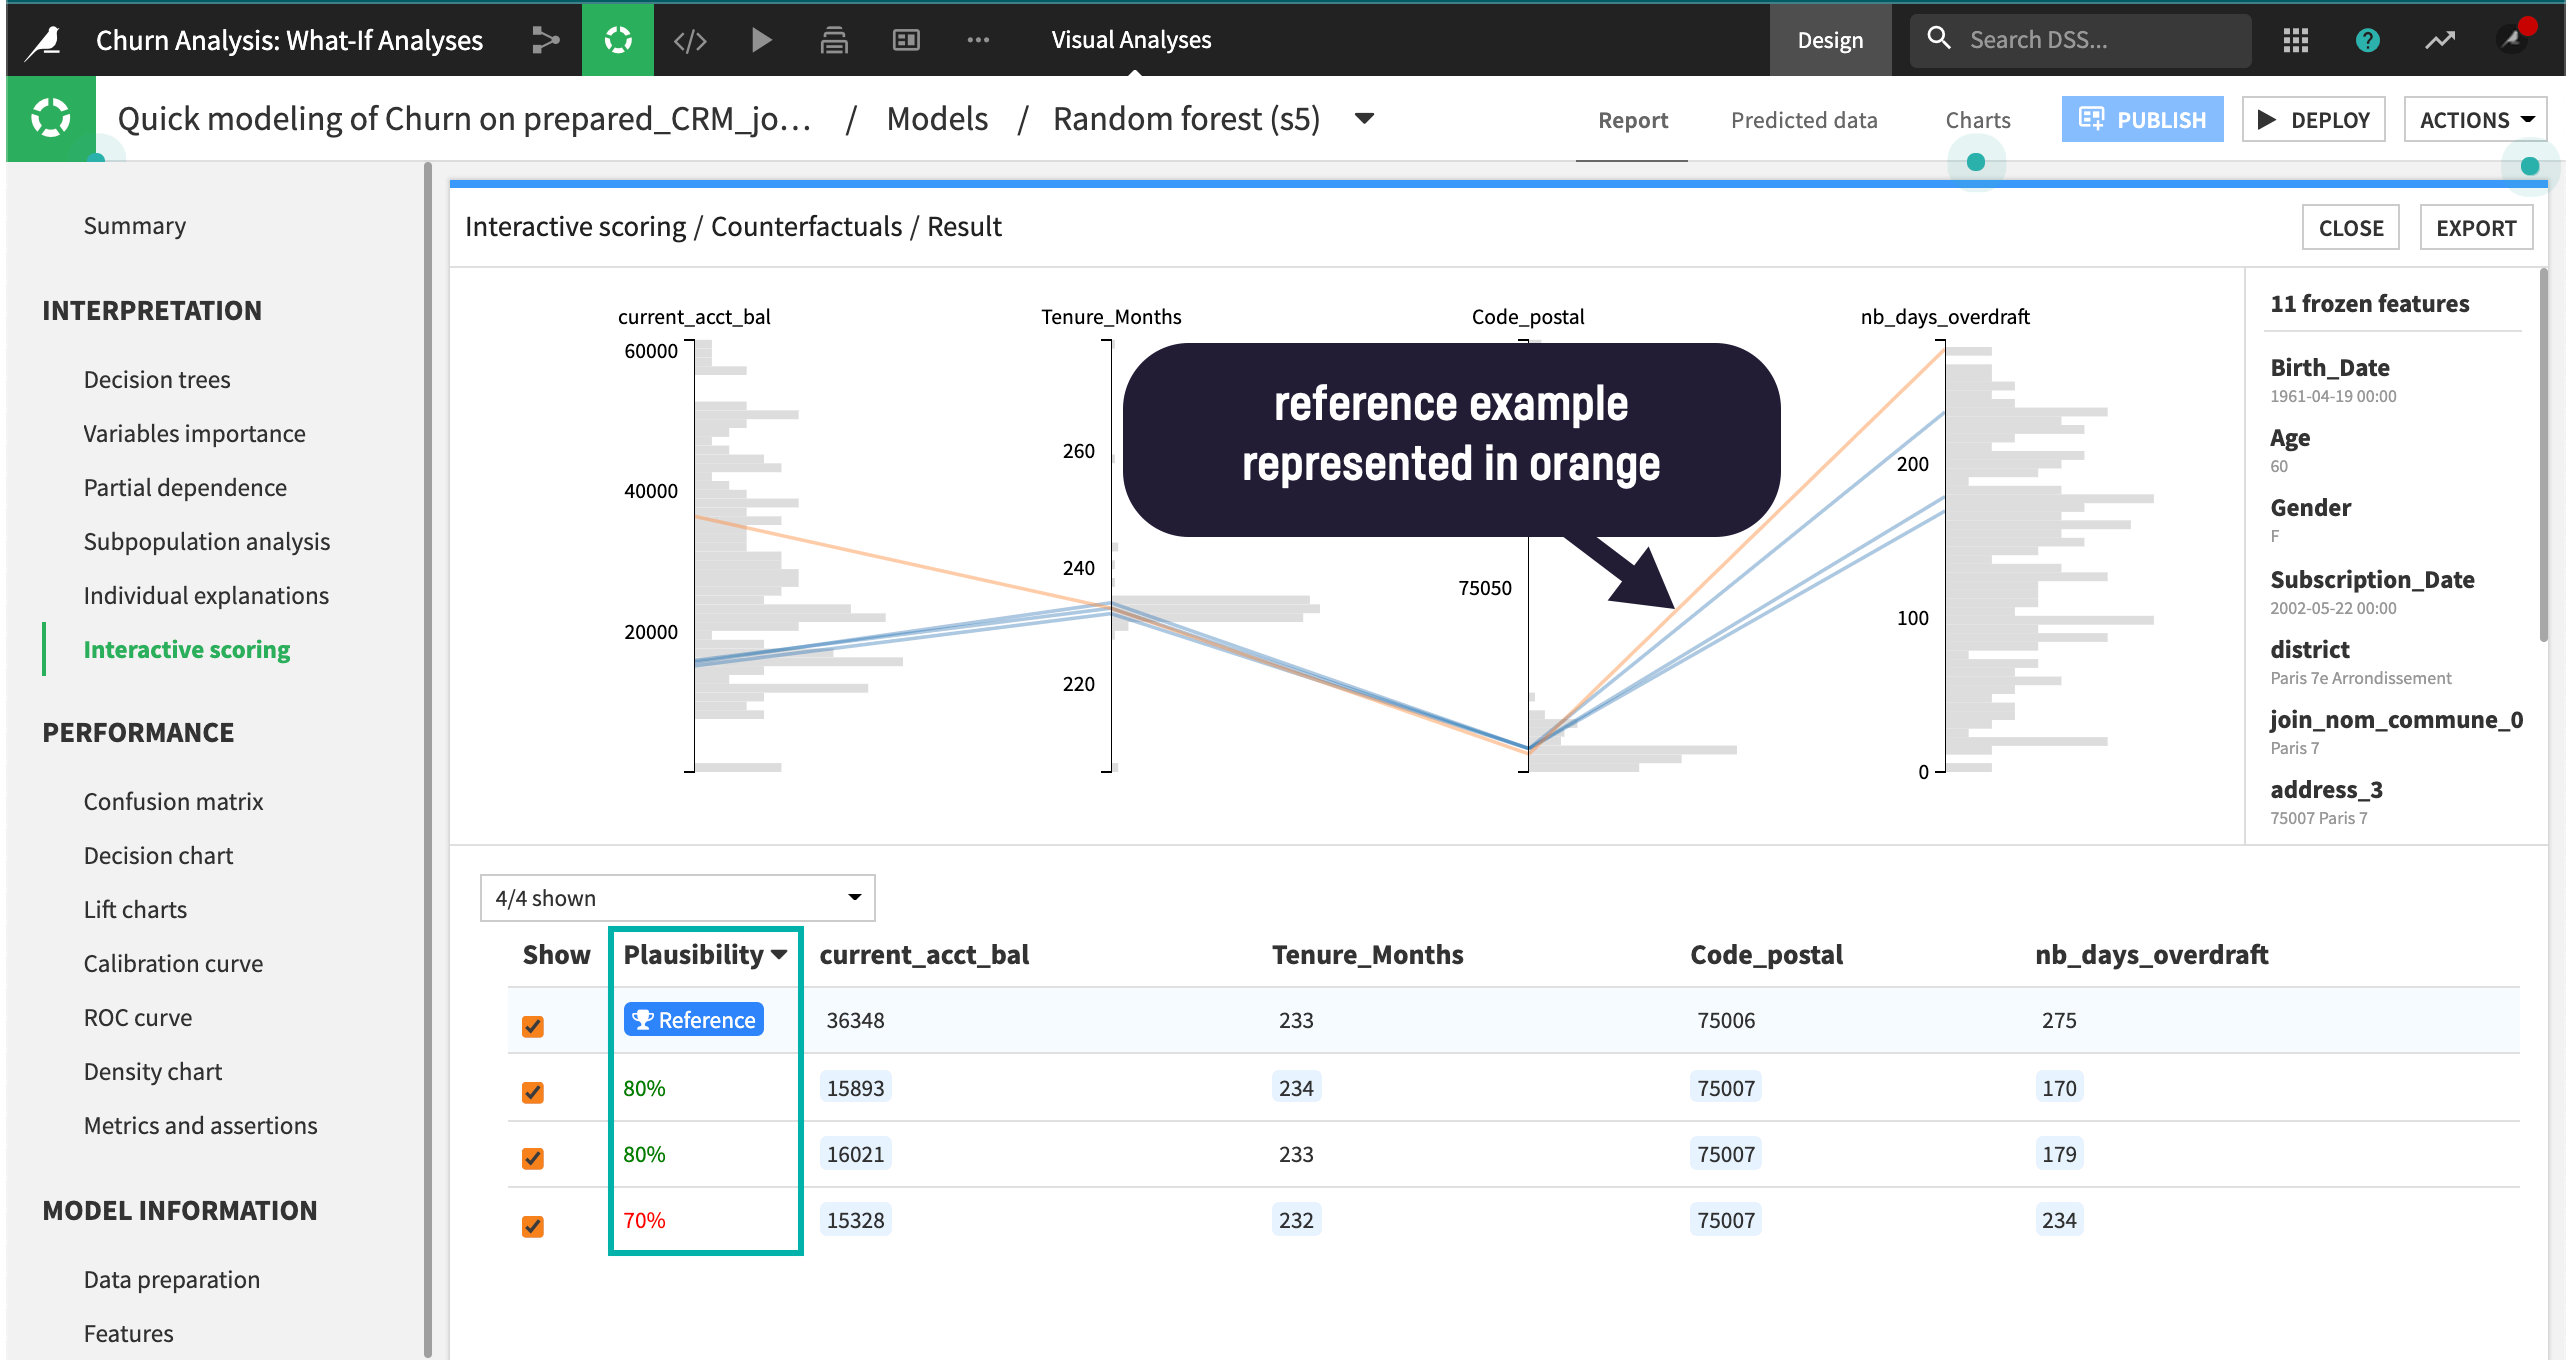
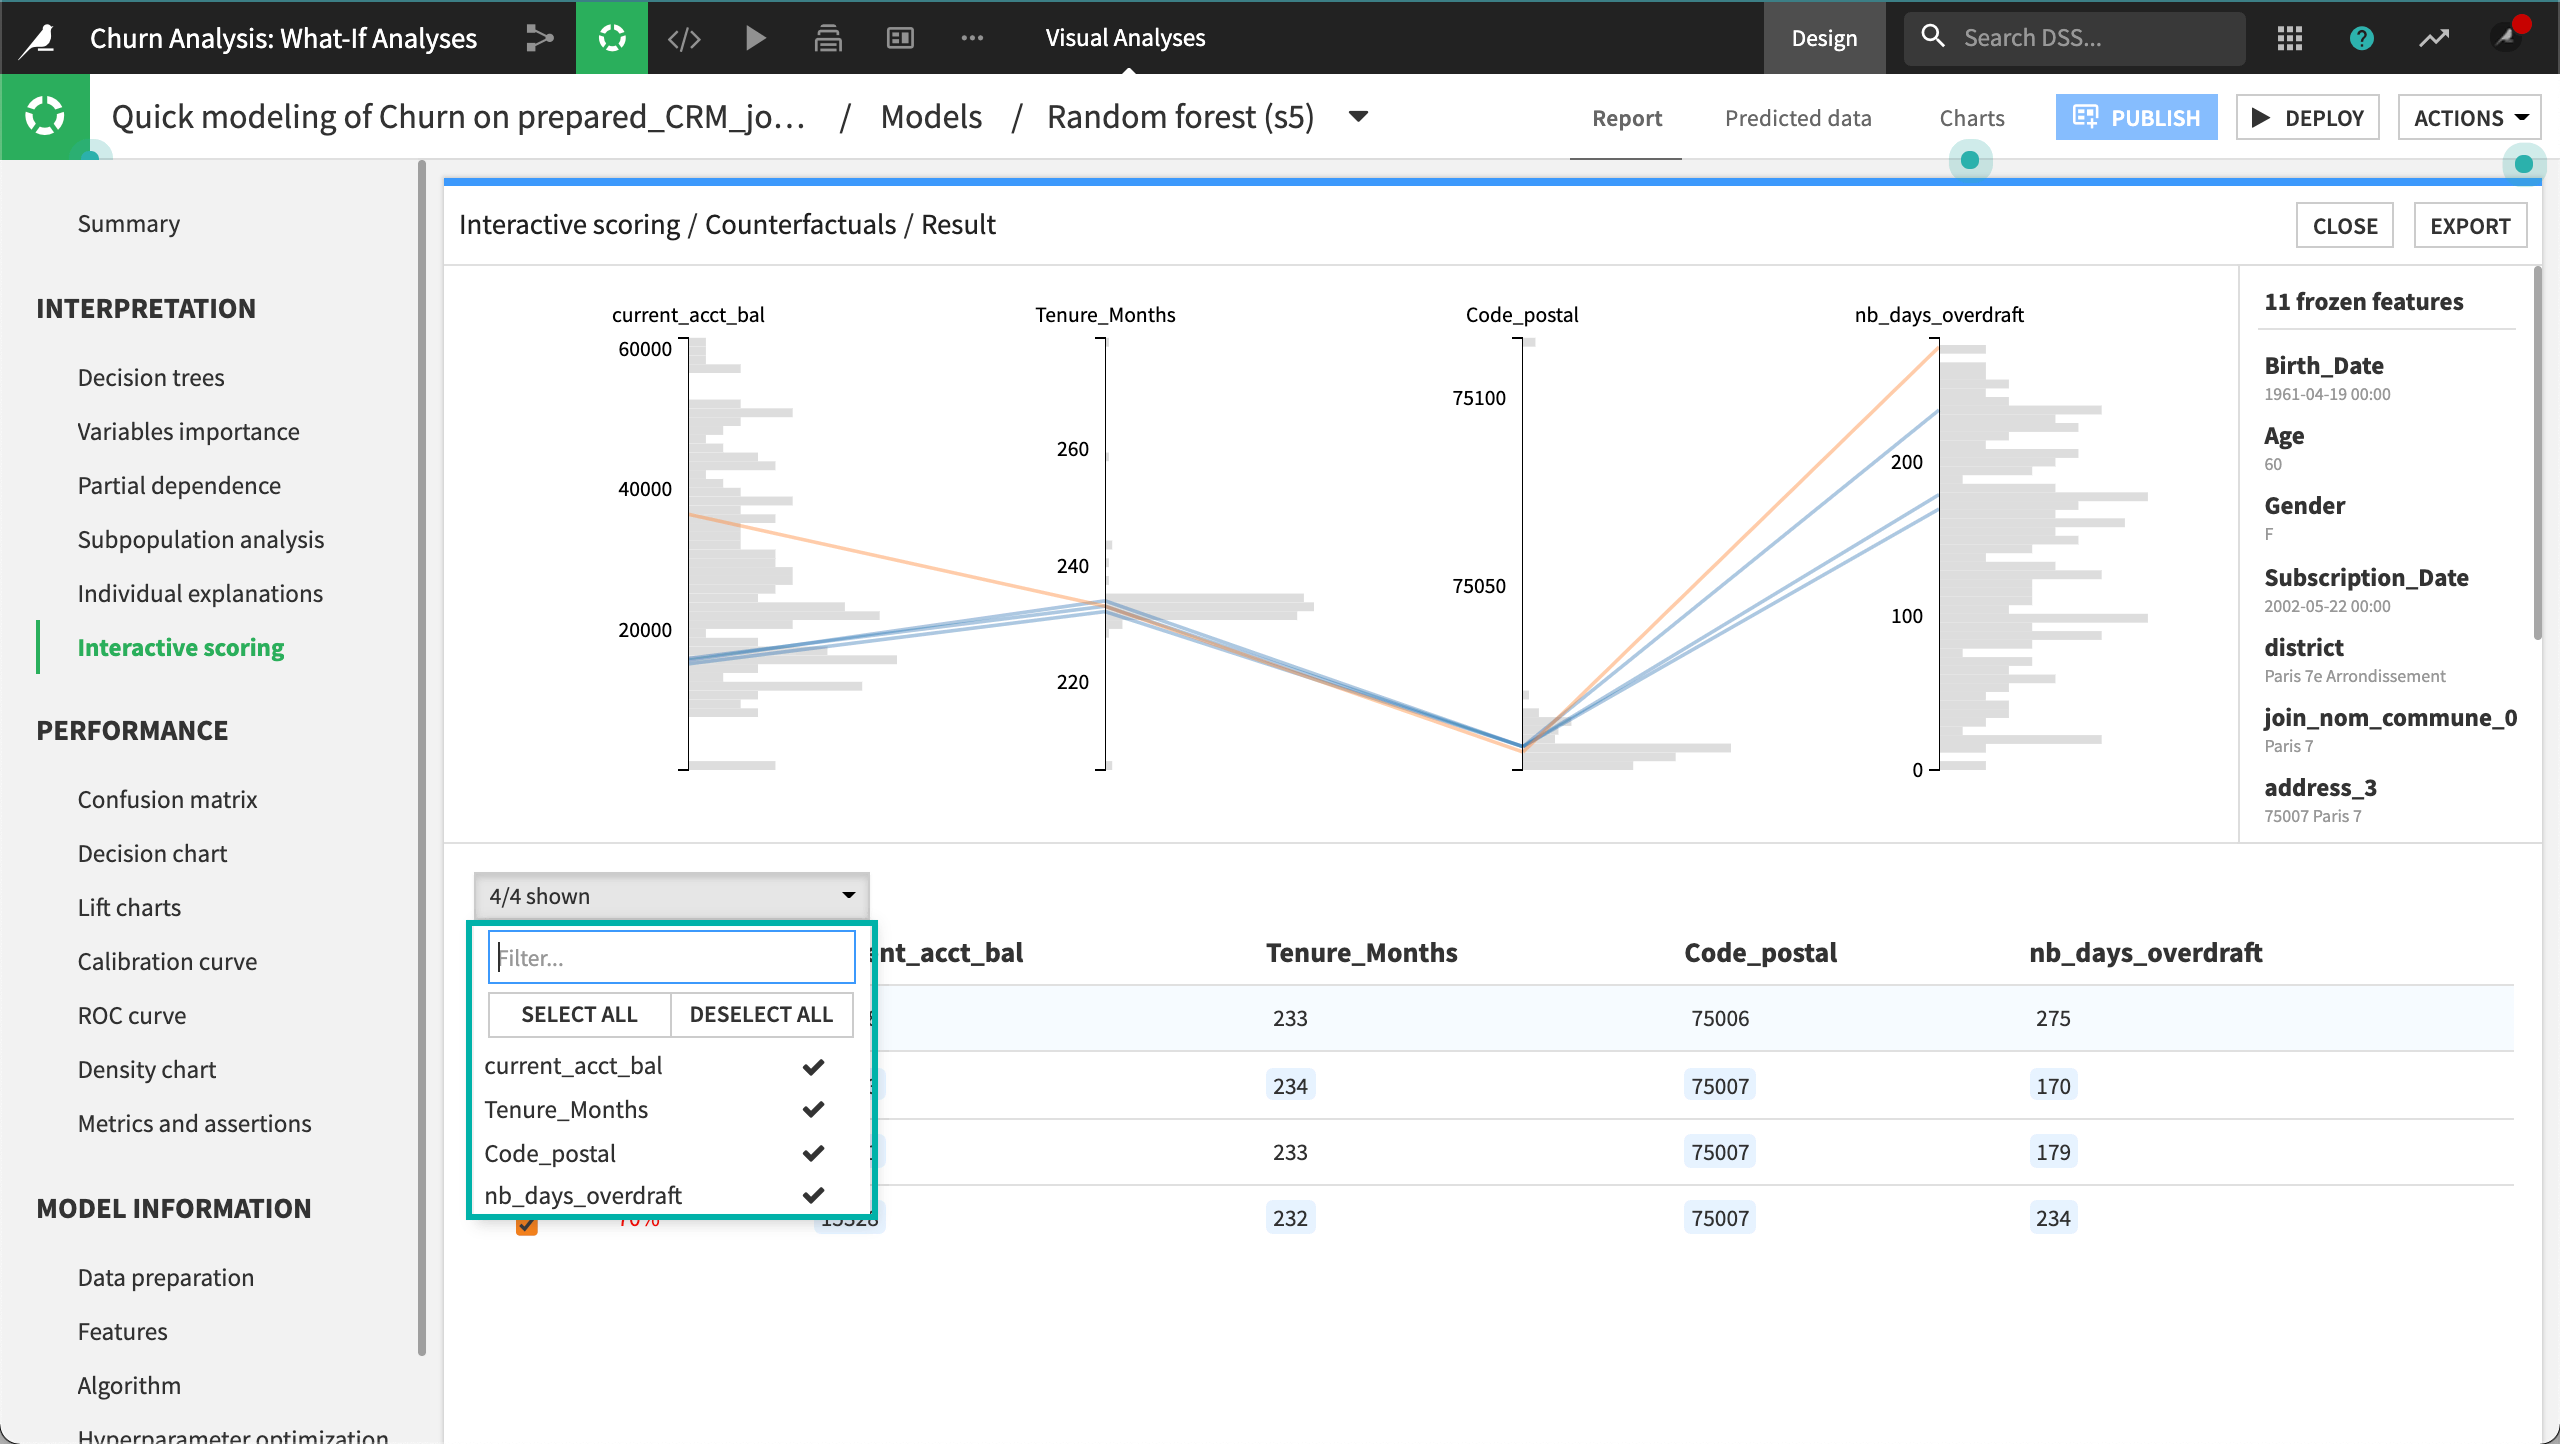
Next, we can interact with the results by selecting to display specific features. We can also return to the interactive scoring simulator and create a new reference record.
Actionable Recourse
Similar to counterfactuals, we’ll start with the interactive scoring simulator and create a reference record. Our reference record shows that churn probability is very low with our particular set of features and input values, and the prediction is false.
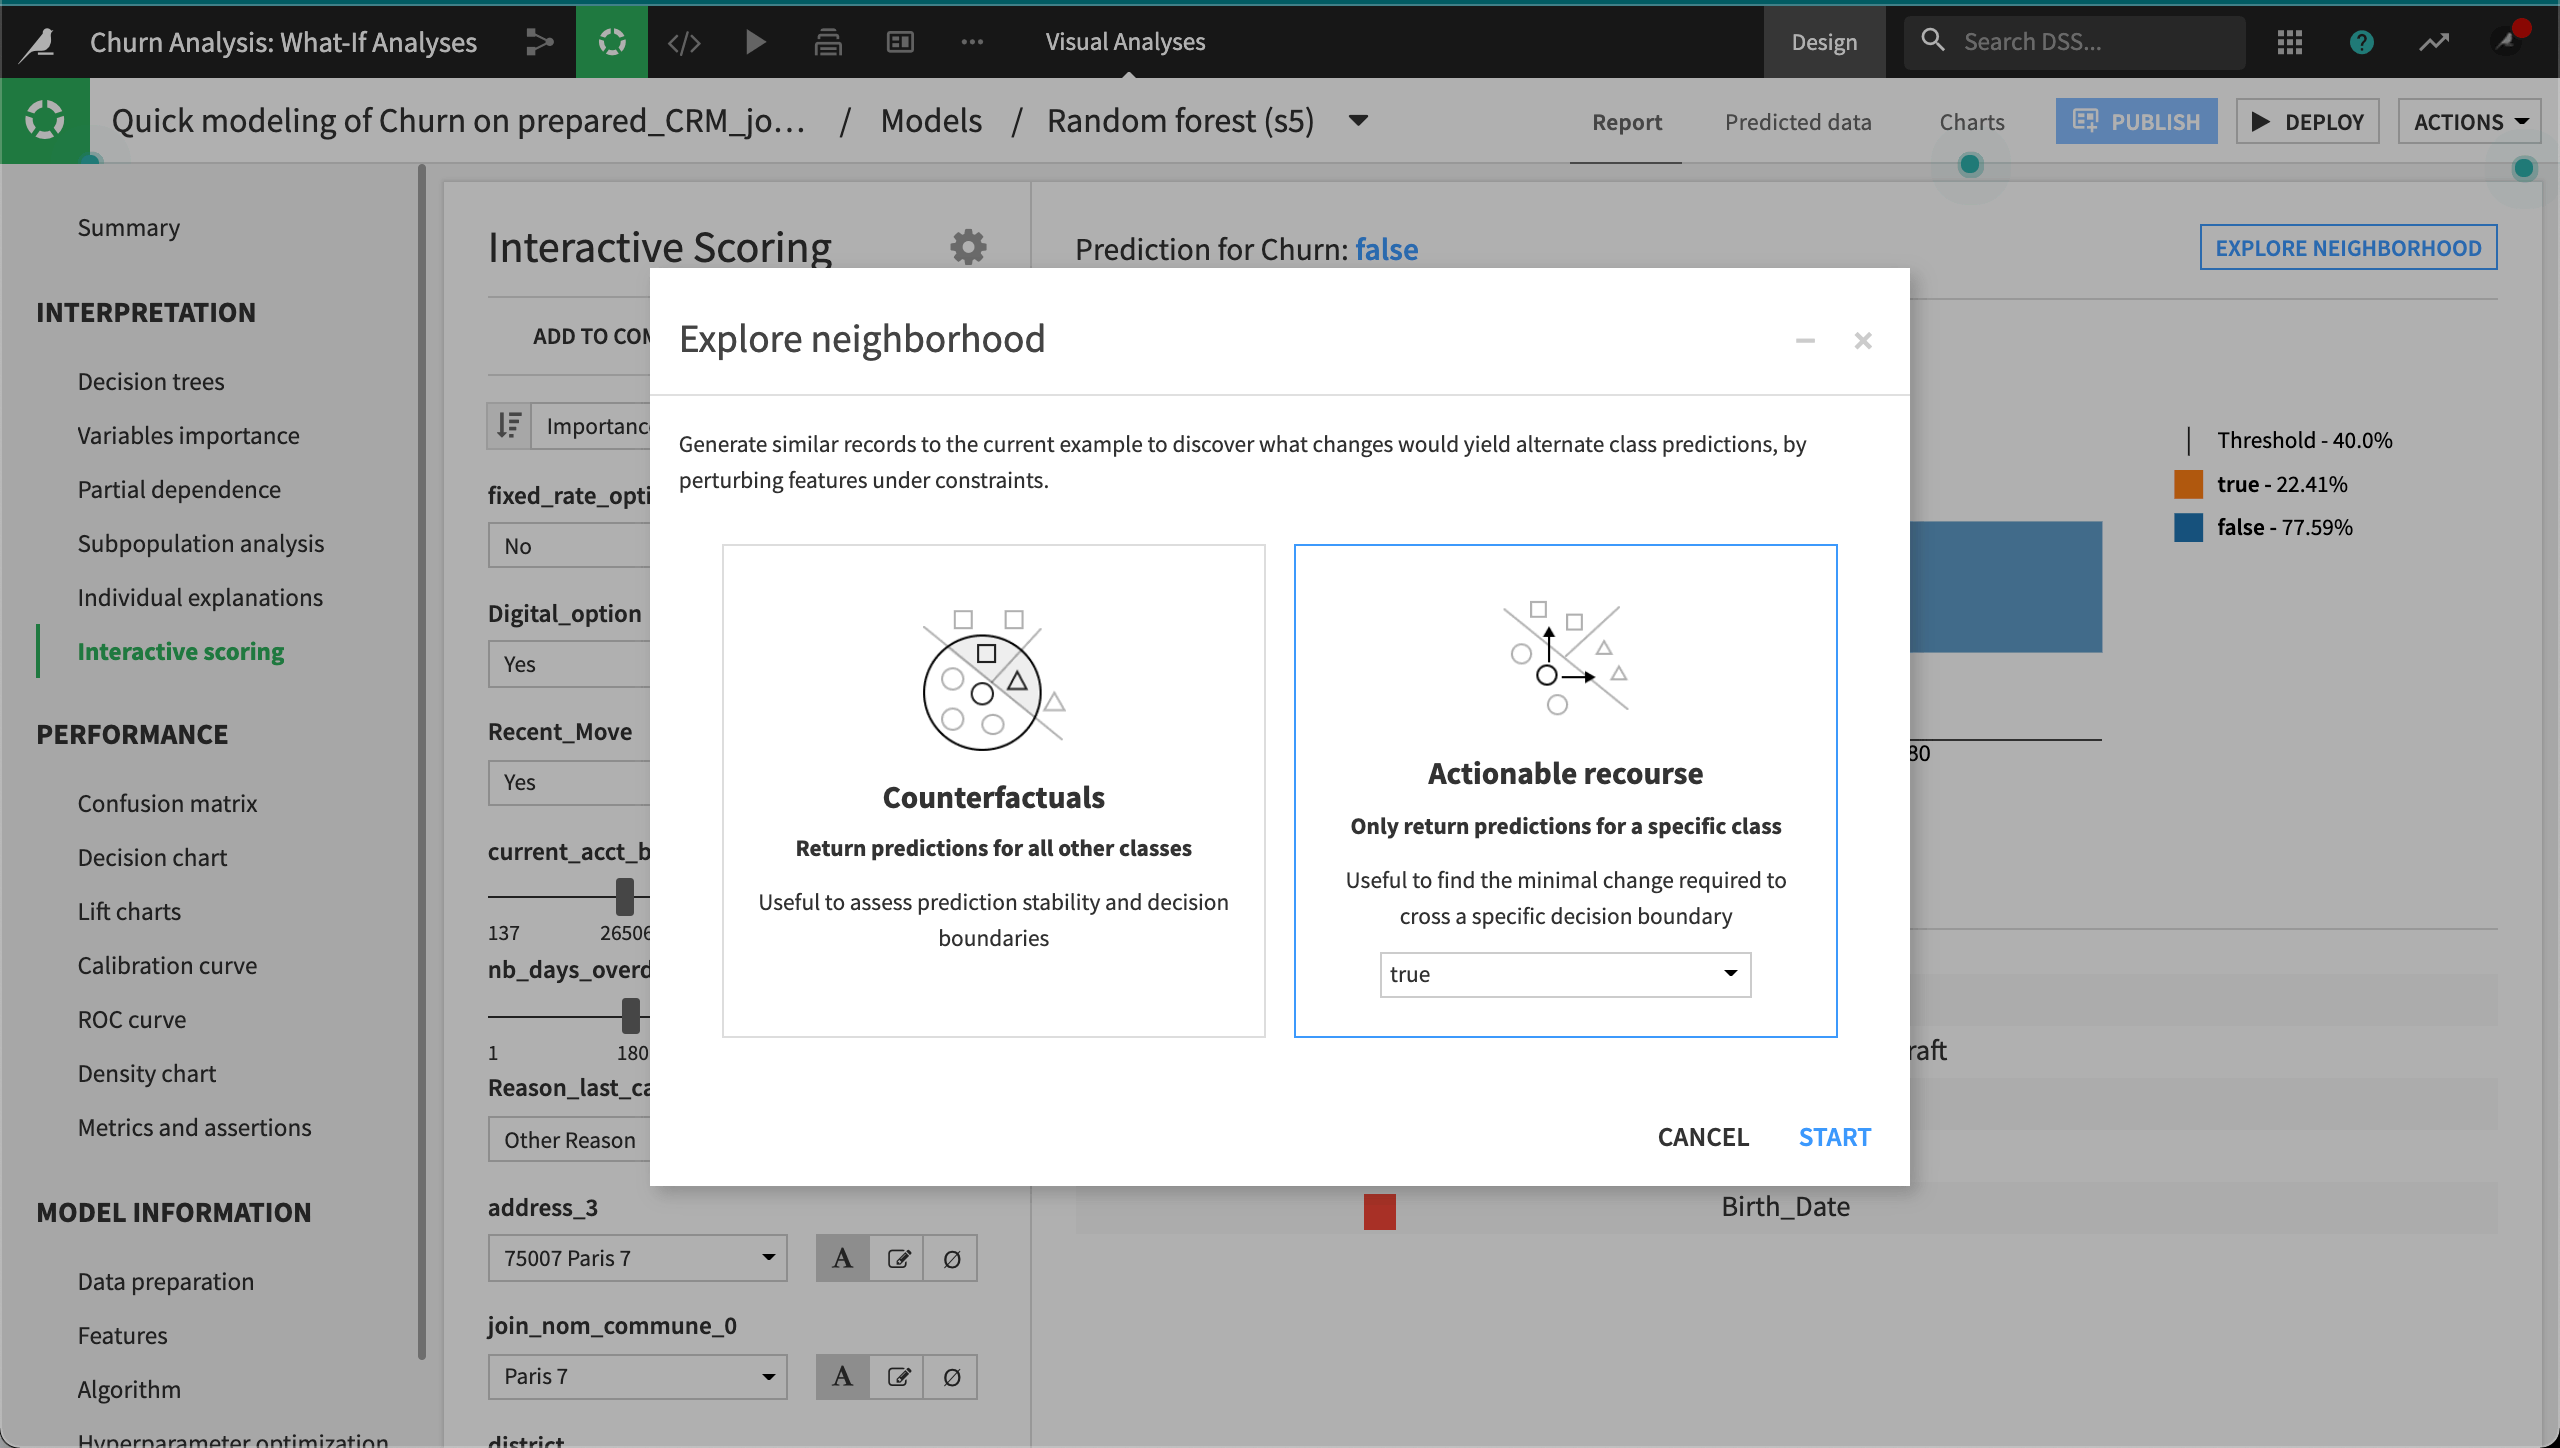
We want Dataiku to return similar examples where the model predicts a different class–that is, where the prediction is true. Since we want to look at many records similar to our reference record, we’ll explore the neighborhood and look at actionable recourse. The Explore neighborhood window lets us select a class outcome. Since there are only two classes in our example, the class, true, is selected for us.
In the Interactive scoring / Actionable recourse panel, we can configure the minimum and maximum restraints for each actionable feature, similar to the way we did with our counterfactuals analysis.
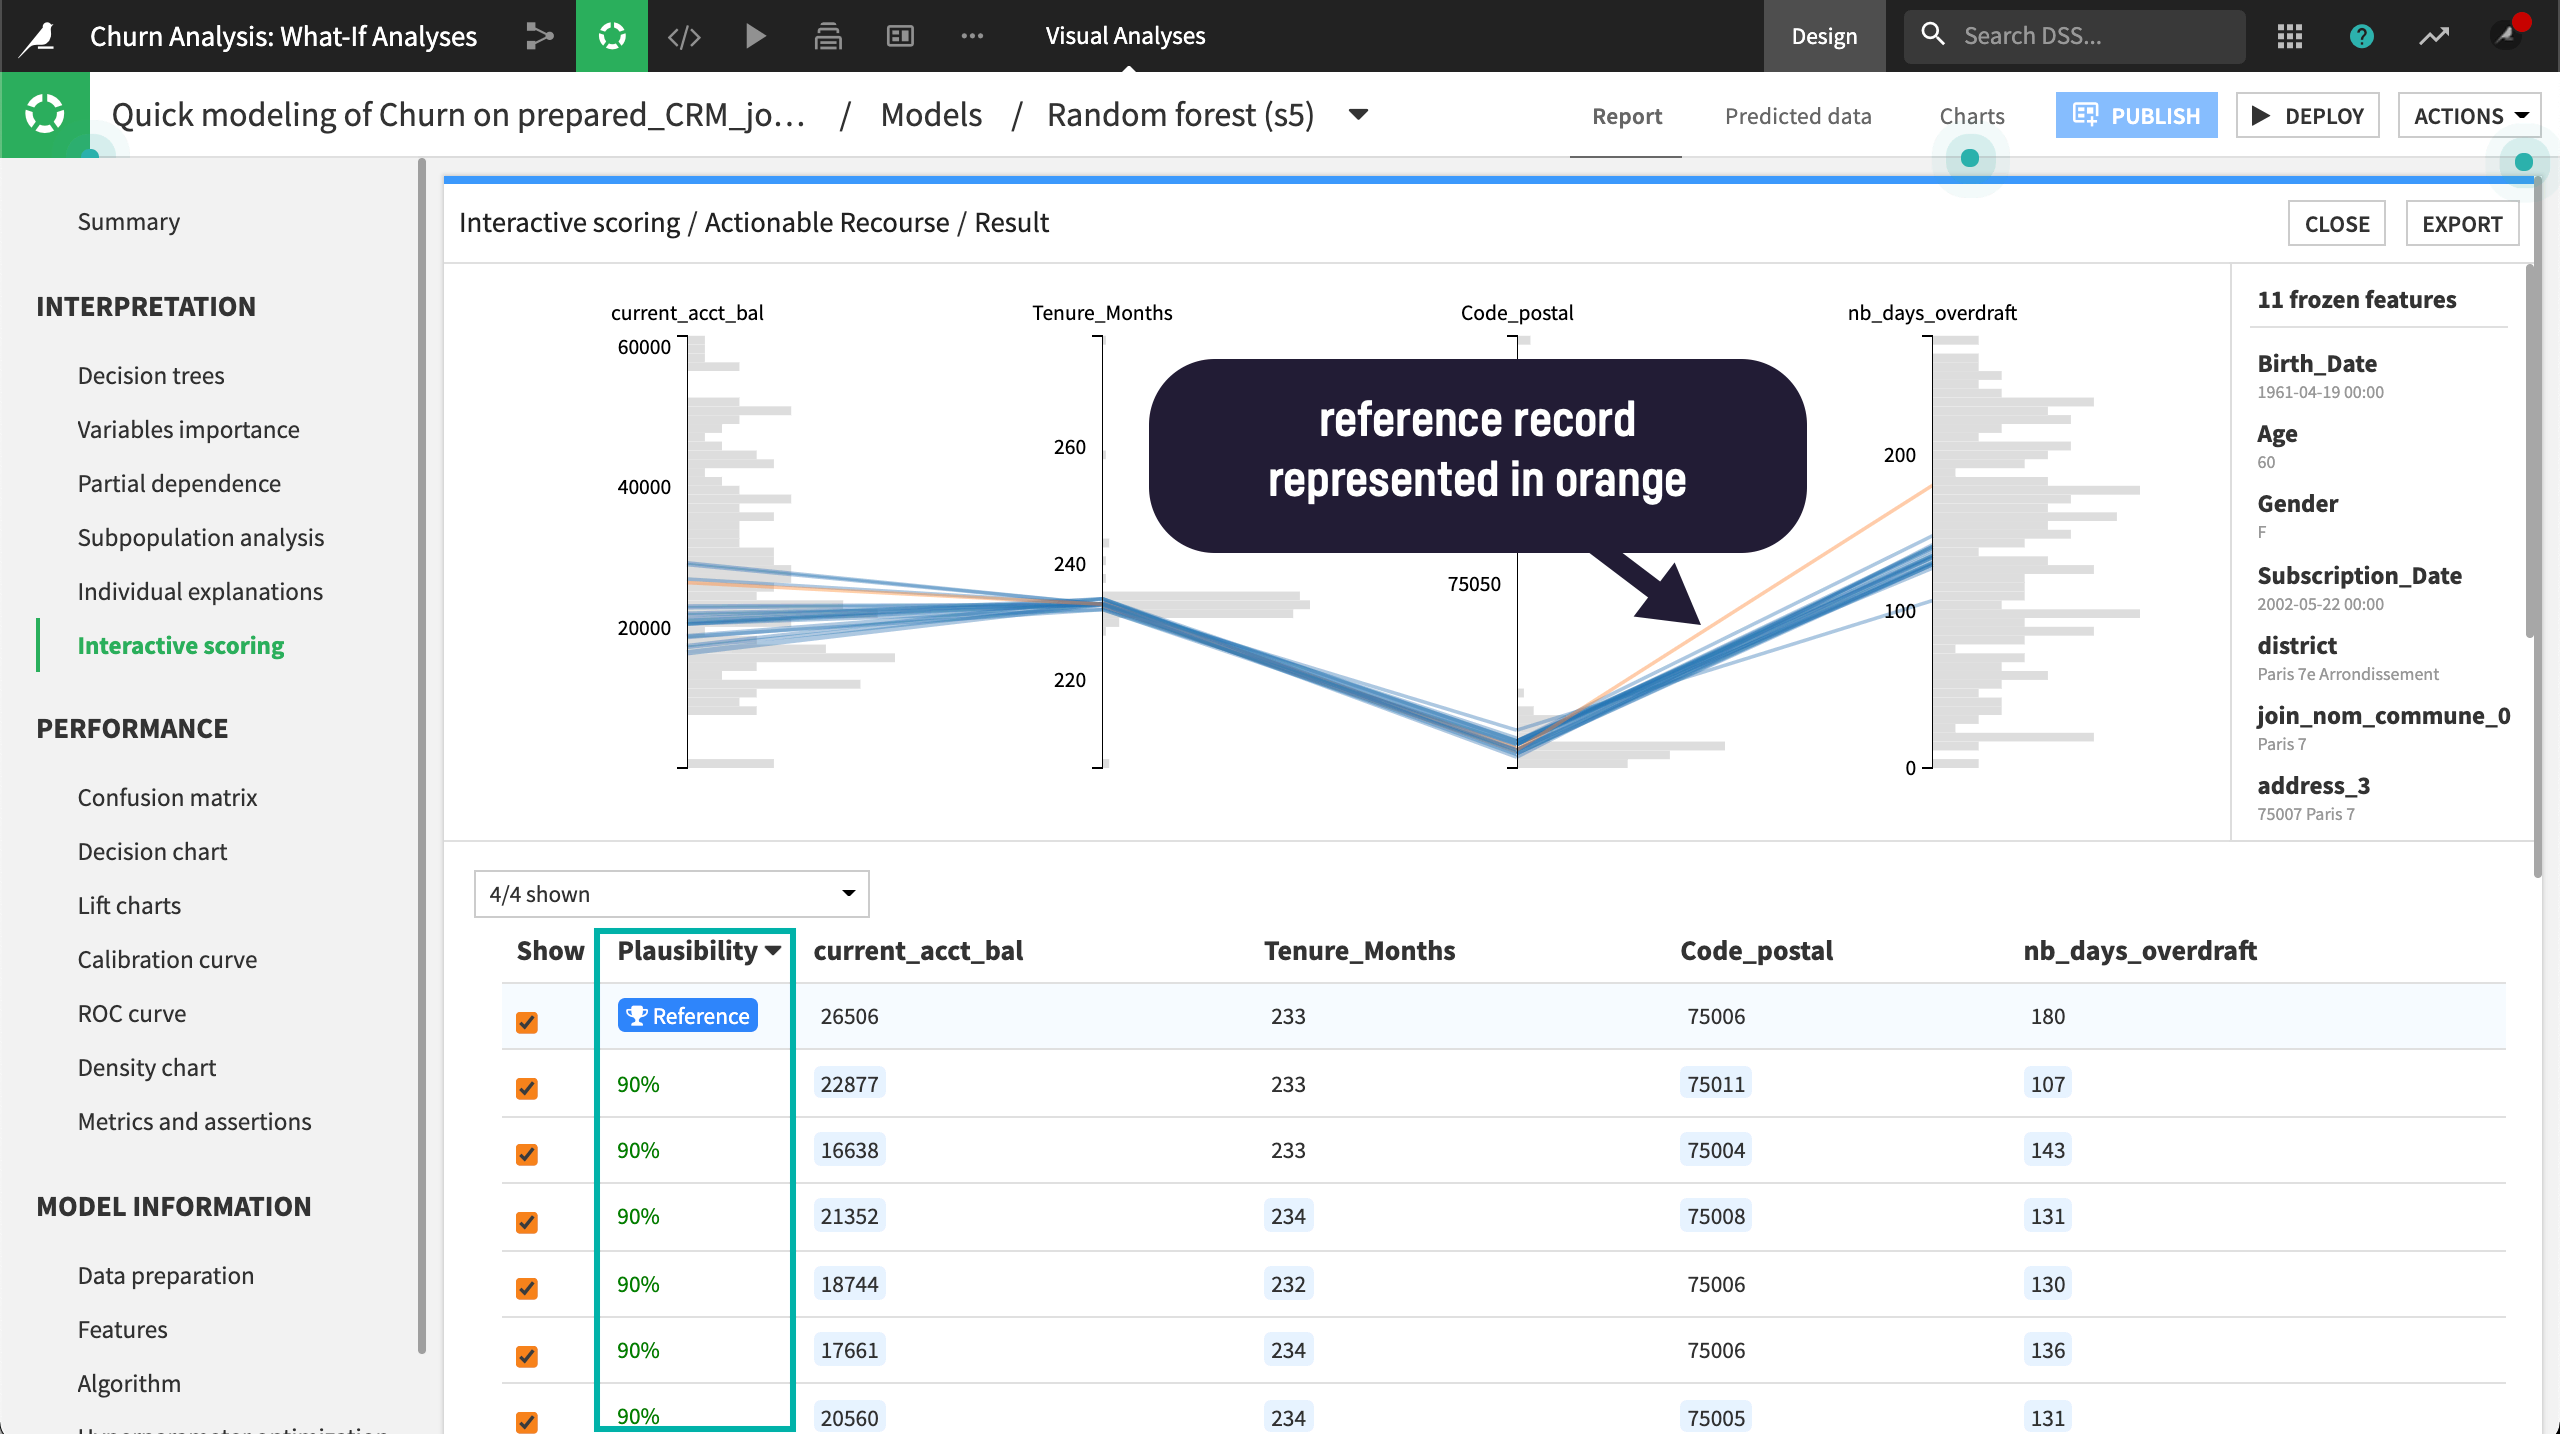
Once we click Compute, Dataiku systematically computes new samples using the actionable features and the specified restraints. The resulting samples represent observations that are all predicted to be true. These are samples that could happen but have not necessarily been seen in the training dataset, each with its plausibility measure.
The results of both analyses can be used to inform the development of the model by letting the model developer know the robustness of the model. The analyses can also inform business stakeholders of the likely outcome based on small changes to specific inputs or the smallest changes needed to influence a different outcome.