Hands-On Tutorial: Automation for a Production Environment
Let’s Get Started!
In this tutorial, you will:
make a scenario more robust by adding steps to compute metrics and run checks while building a data pipeline;
add a reporter to send progress alerts.
Use Case
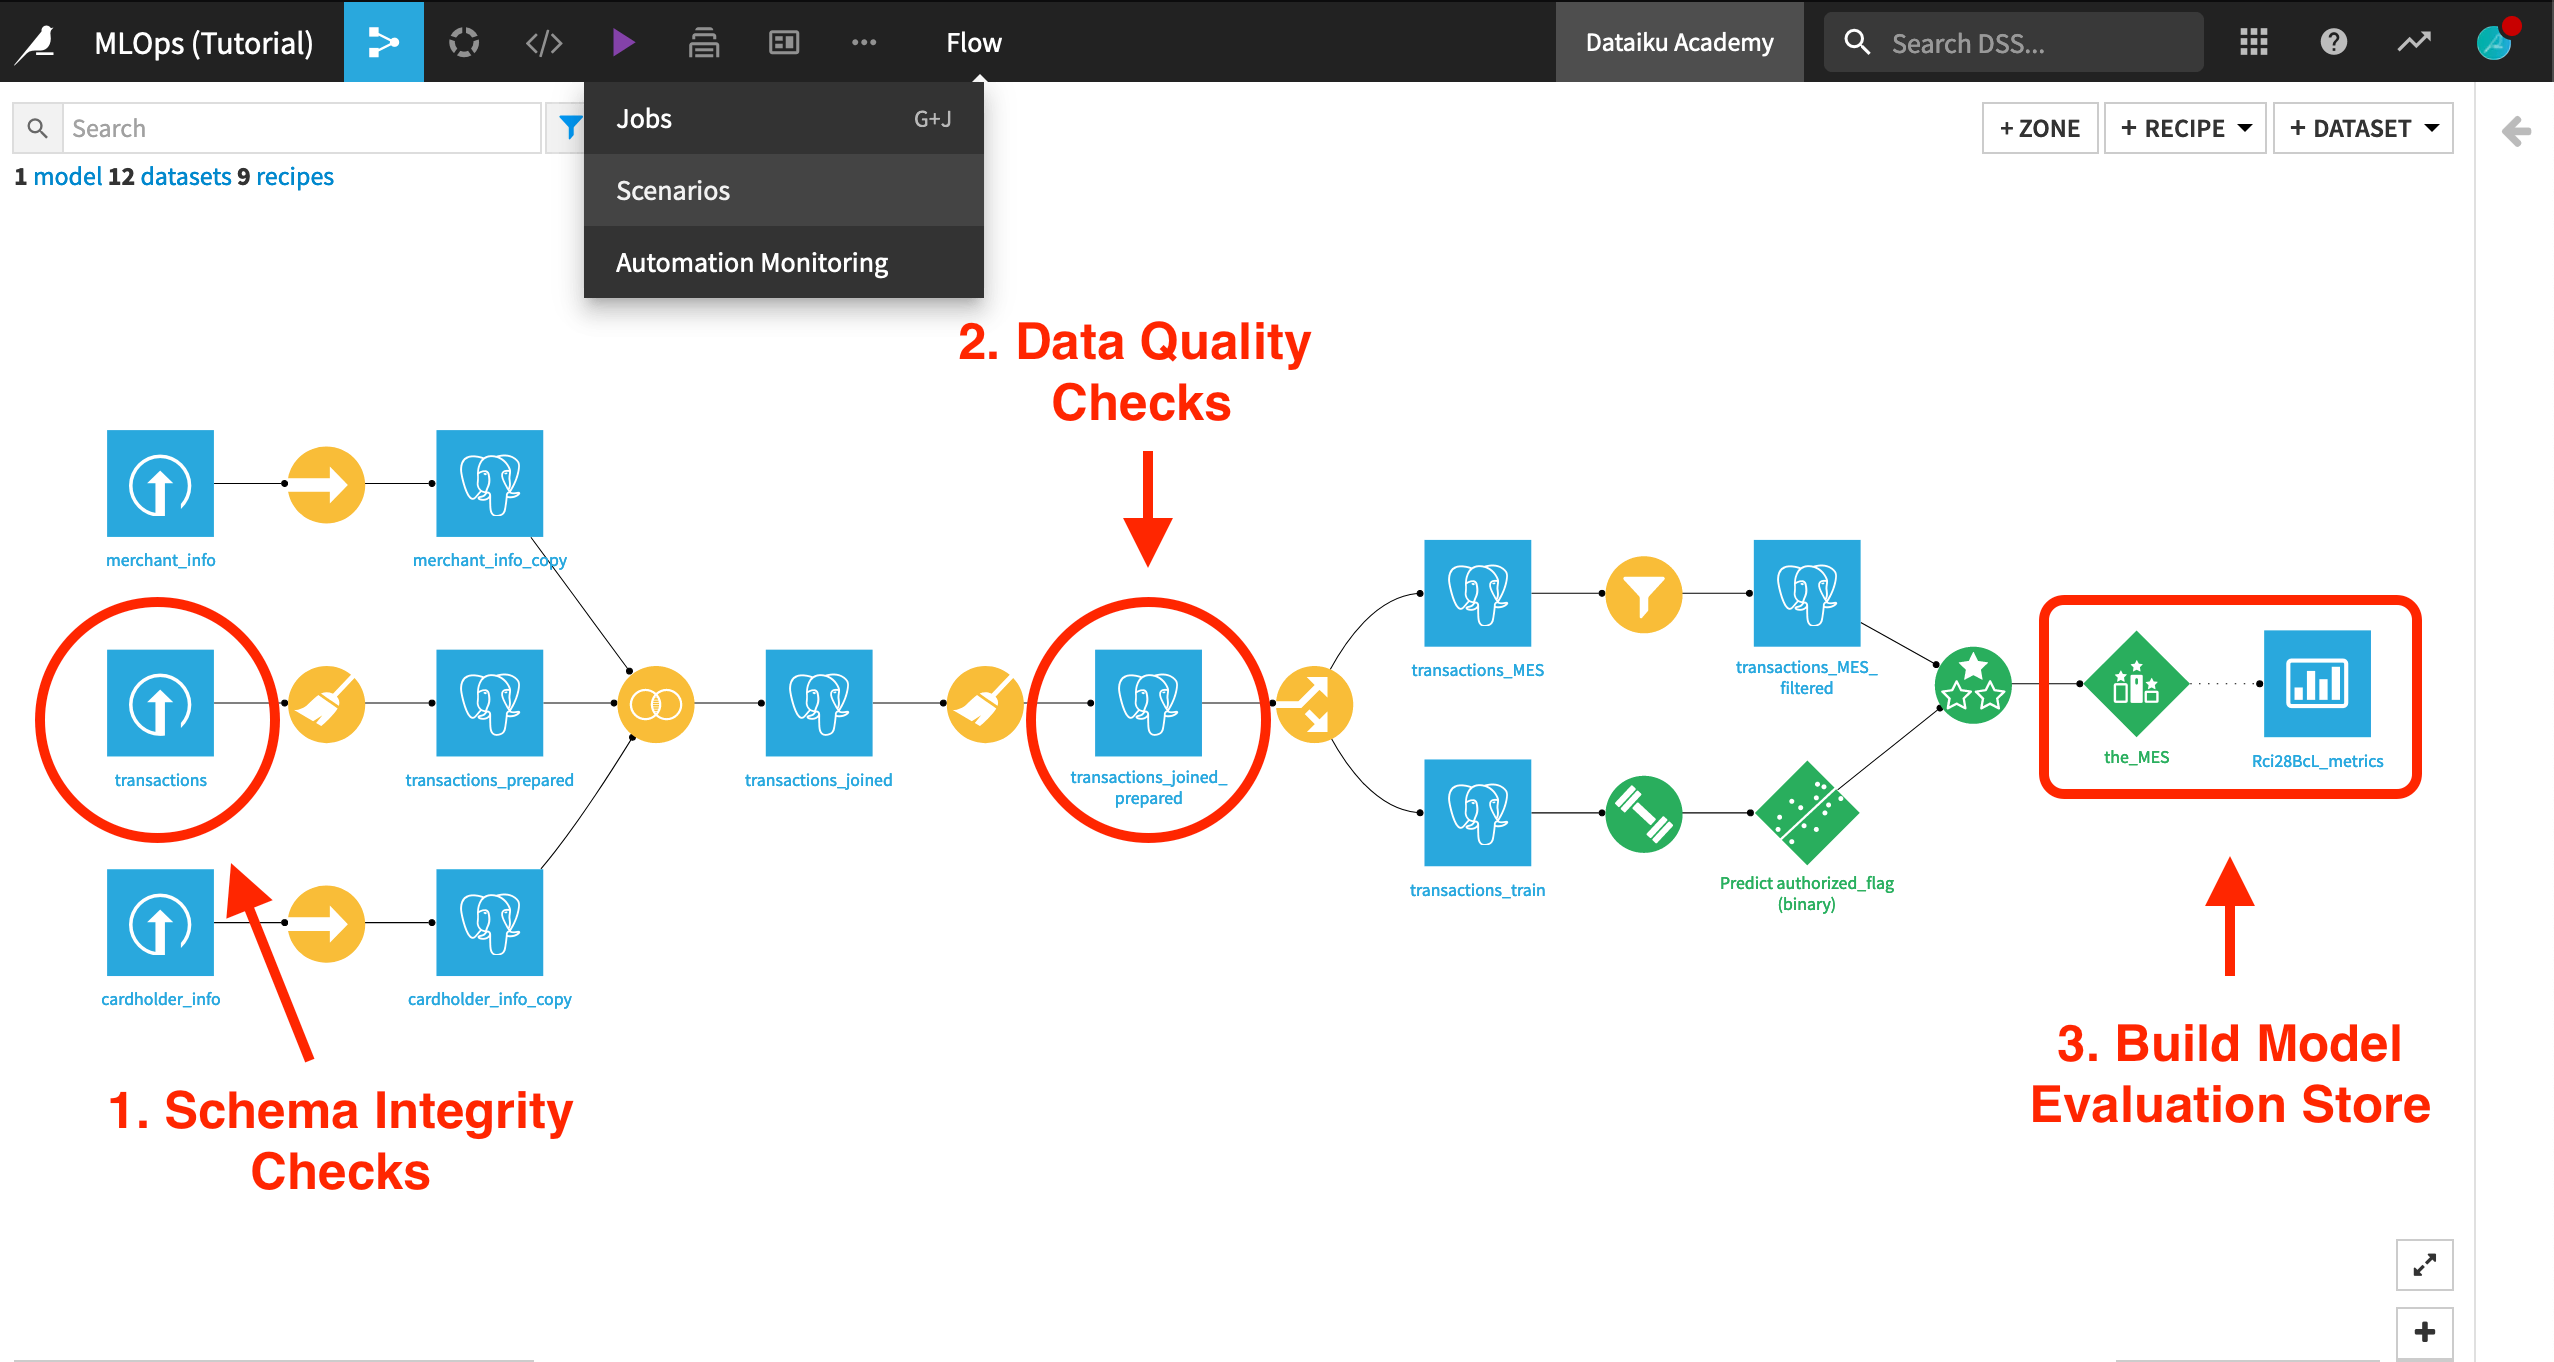
In tutorials throughout the MLOps Practitioner learning path, you’ll work with a simple credit card fraud use case. Using data about transactions, merchants, and cardholders, we have a model that predicts which transactions should be authorized and which are potentially fraudulent.
A score of 1 for the target variable, authorized_flag, represents an authorized transaction. A score of 0, on the other hand, is a transaction that failed authorization.
The focal point of the Flow is a model evaluation store that logs the performance of the prediction model against new quarters of data. In this case, we consider three months of data as one batch.
Prerequisites
This tutorial assumes basic knowledge of automation features like metrics, checks, scenarios, and triggers. If these are unfamiliar to you, check out the Automation course first.
This tutorial is the first in a series of tutorials in the MLOps learning path. The prerequisites for that series can be found below. However, for just this first tutorial, you’ll only need Dataiku 10.0 or above.
The tutorial does include adding a reporter, but that step can be skipped if not configured.
Note
Review the technical prerequisites for the MLOps Practitioner learning path.
Create the Project
For this tutorial, we’ll start from a project with a completed Flow and a simple build scenario.
From the homepage of the Design node, click +New Project > DSS Tutorials > MLOps > MLOps (Tutorial).
Note
You can also download the starter project from this website and import it as a zip file.
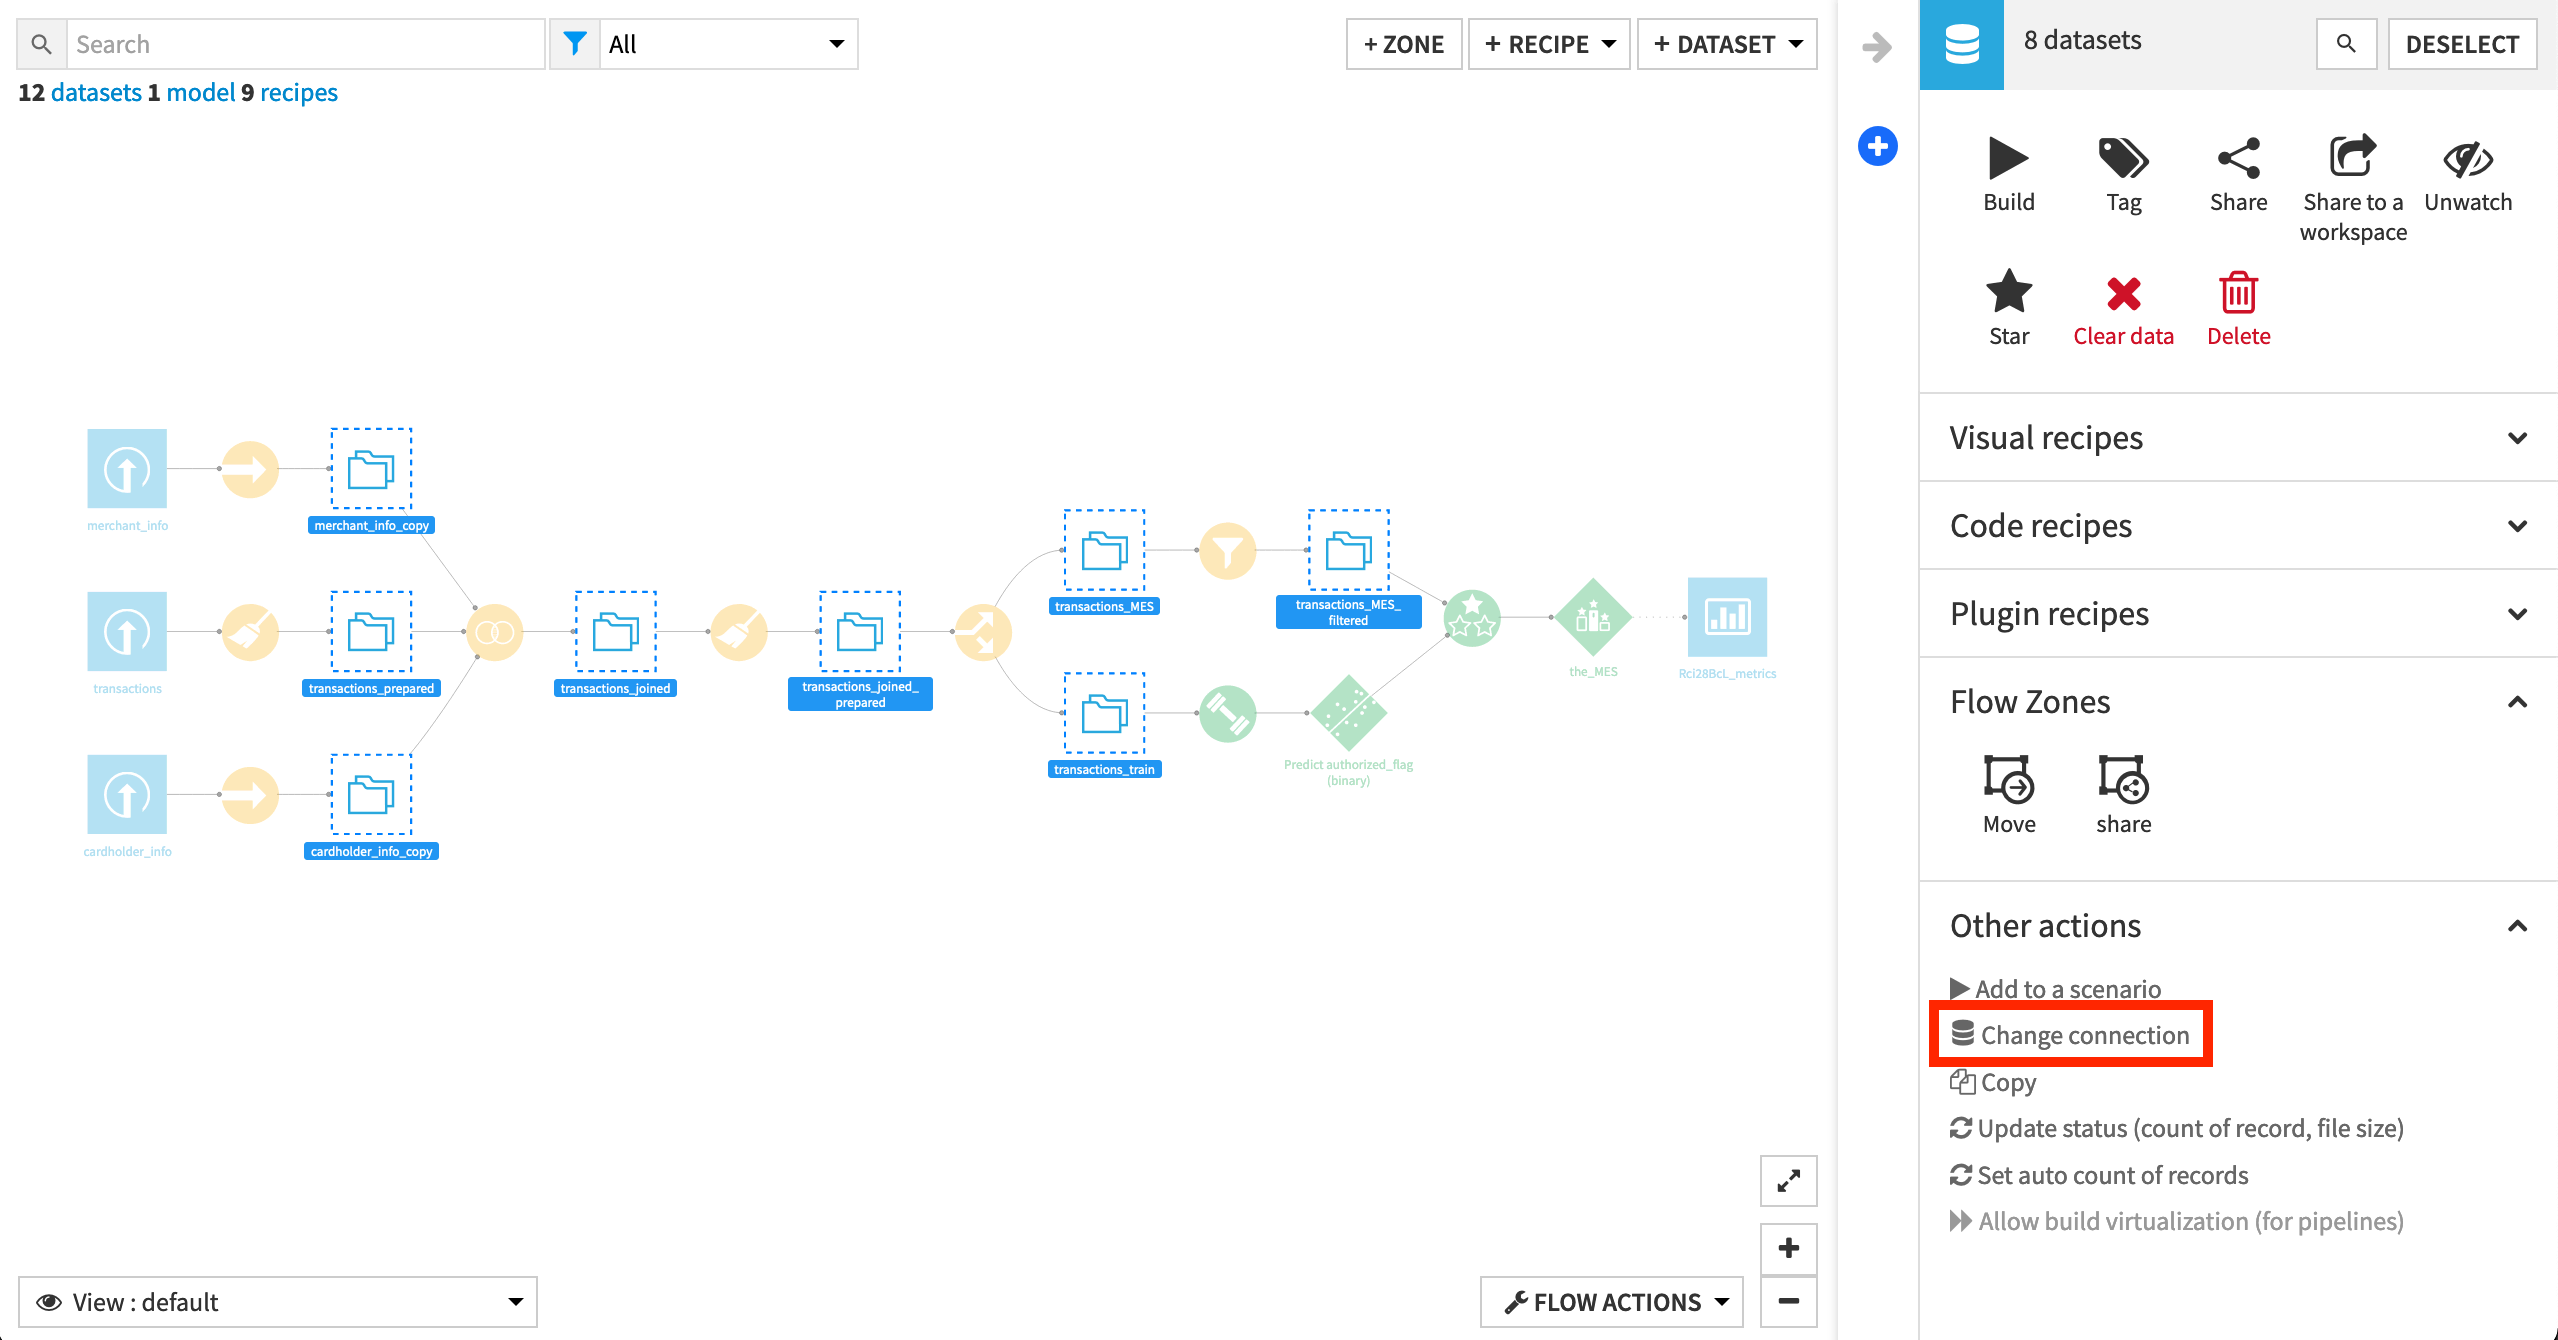
Remap Connections
To simplify the import process, the starter project contains only filesystem connections. However, the walkthrough of this tutorial has synced the eight intermediate datasets to a PostgreSQL database. To change the filesystem connections to a SQL connection, review the remap connections article in the Knowledge Base.
Note
While we recommended that you remap filesystem connections to a SQL database, it is not required for completing this hands-on tutorial.
Also, note that if you use a SQL connection on the Design node, you’ll need to create the same SQL connection on the Automation node or remap the SQL connection to another SQL connection on the Automation node.
Build the Flow with a Scenario
After creating the project, you’ll notice that the intermediate datasets in the Flow are empty. Instead of building it from the Flow, there’s a scenario ready to do this job!
Navigate to the Scenarios page from the Jobs menu of the top navigation bar.
Click to open the “Build Flow” scenario.
Note what the steps accomplish, and click the green Run button to manually launch the scenario.
Note
Be sure to actually open the scenario to assume the role of the scenario’s “last author” rather than running it from the right actions panel.
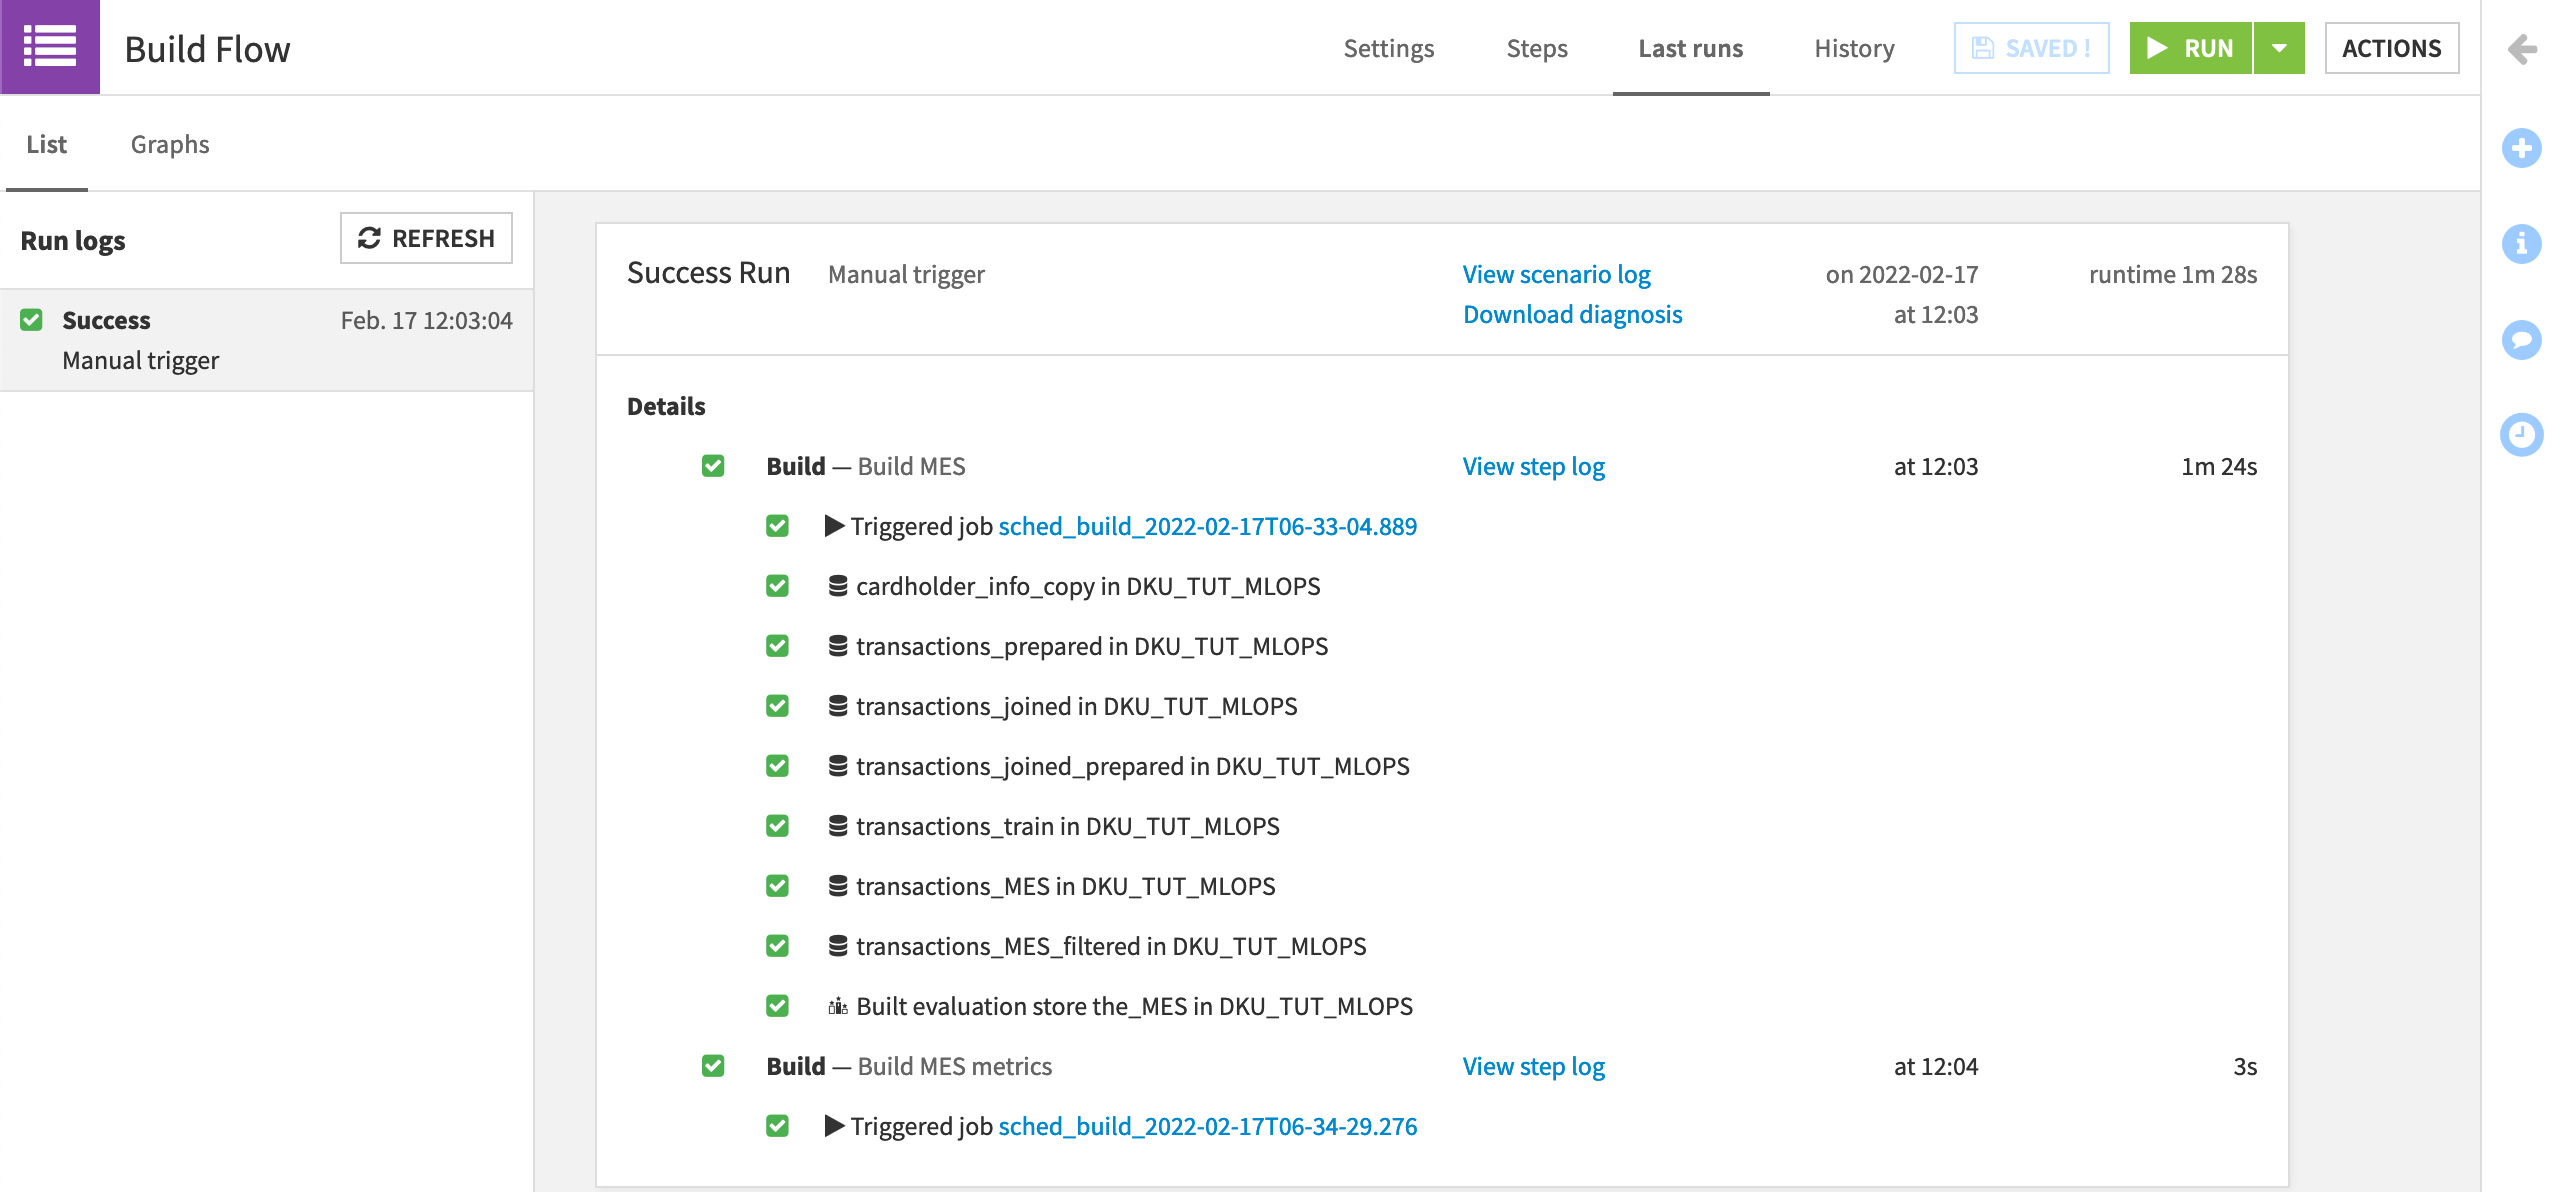
On the “Last Runs” tab, view the progress of the scenario. For each run, we can see the status of each step and its runtime.
Note
Users of Dataiku 10.0.4 and above should expect a diagnostic warning on the Evaluate recipe step. For our purposes, we can ignore the warning as we are not concerned here with the actual performance of the model at hand.
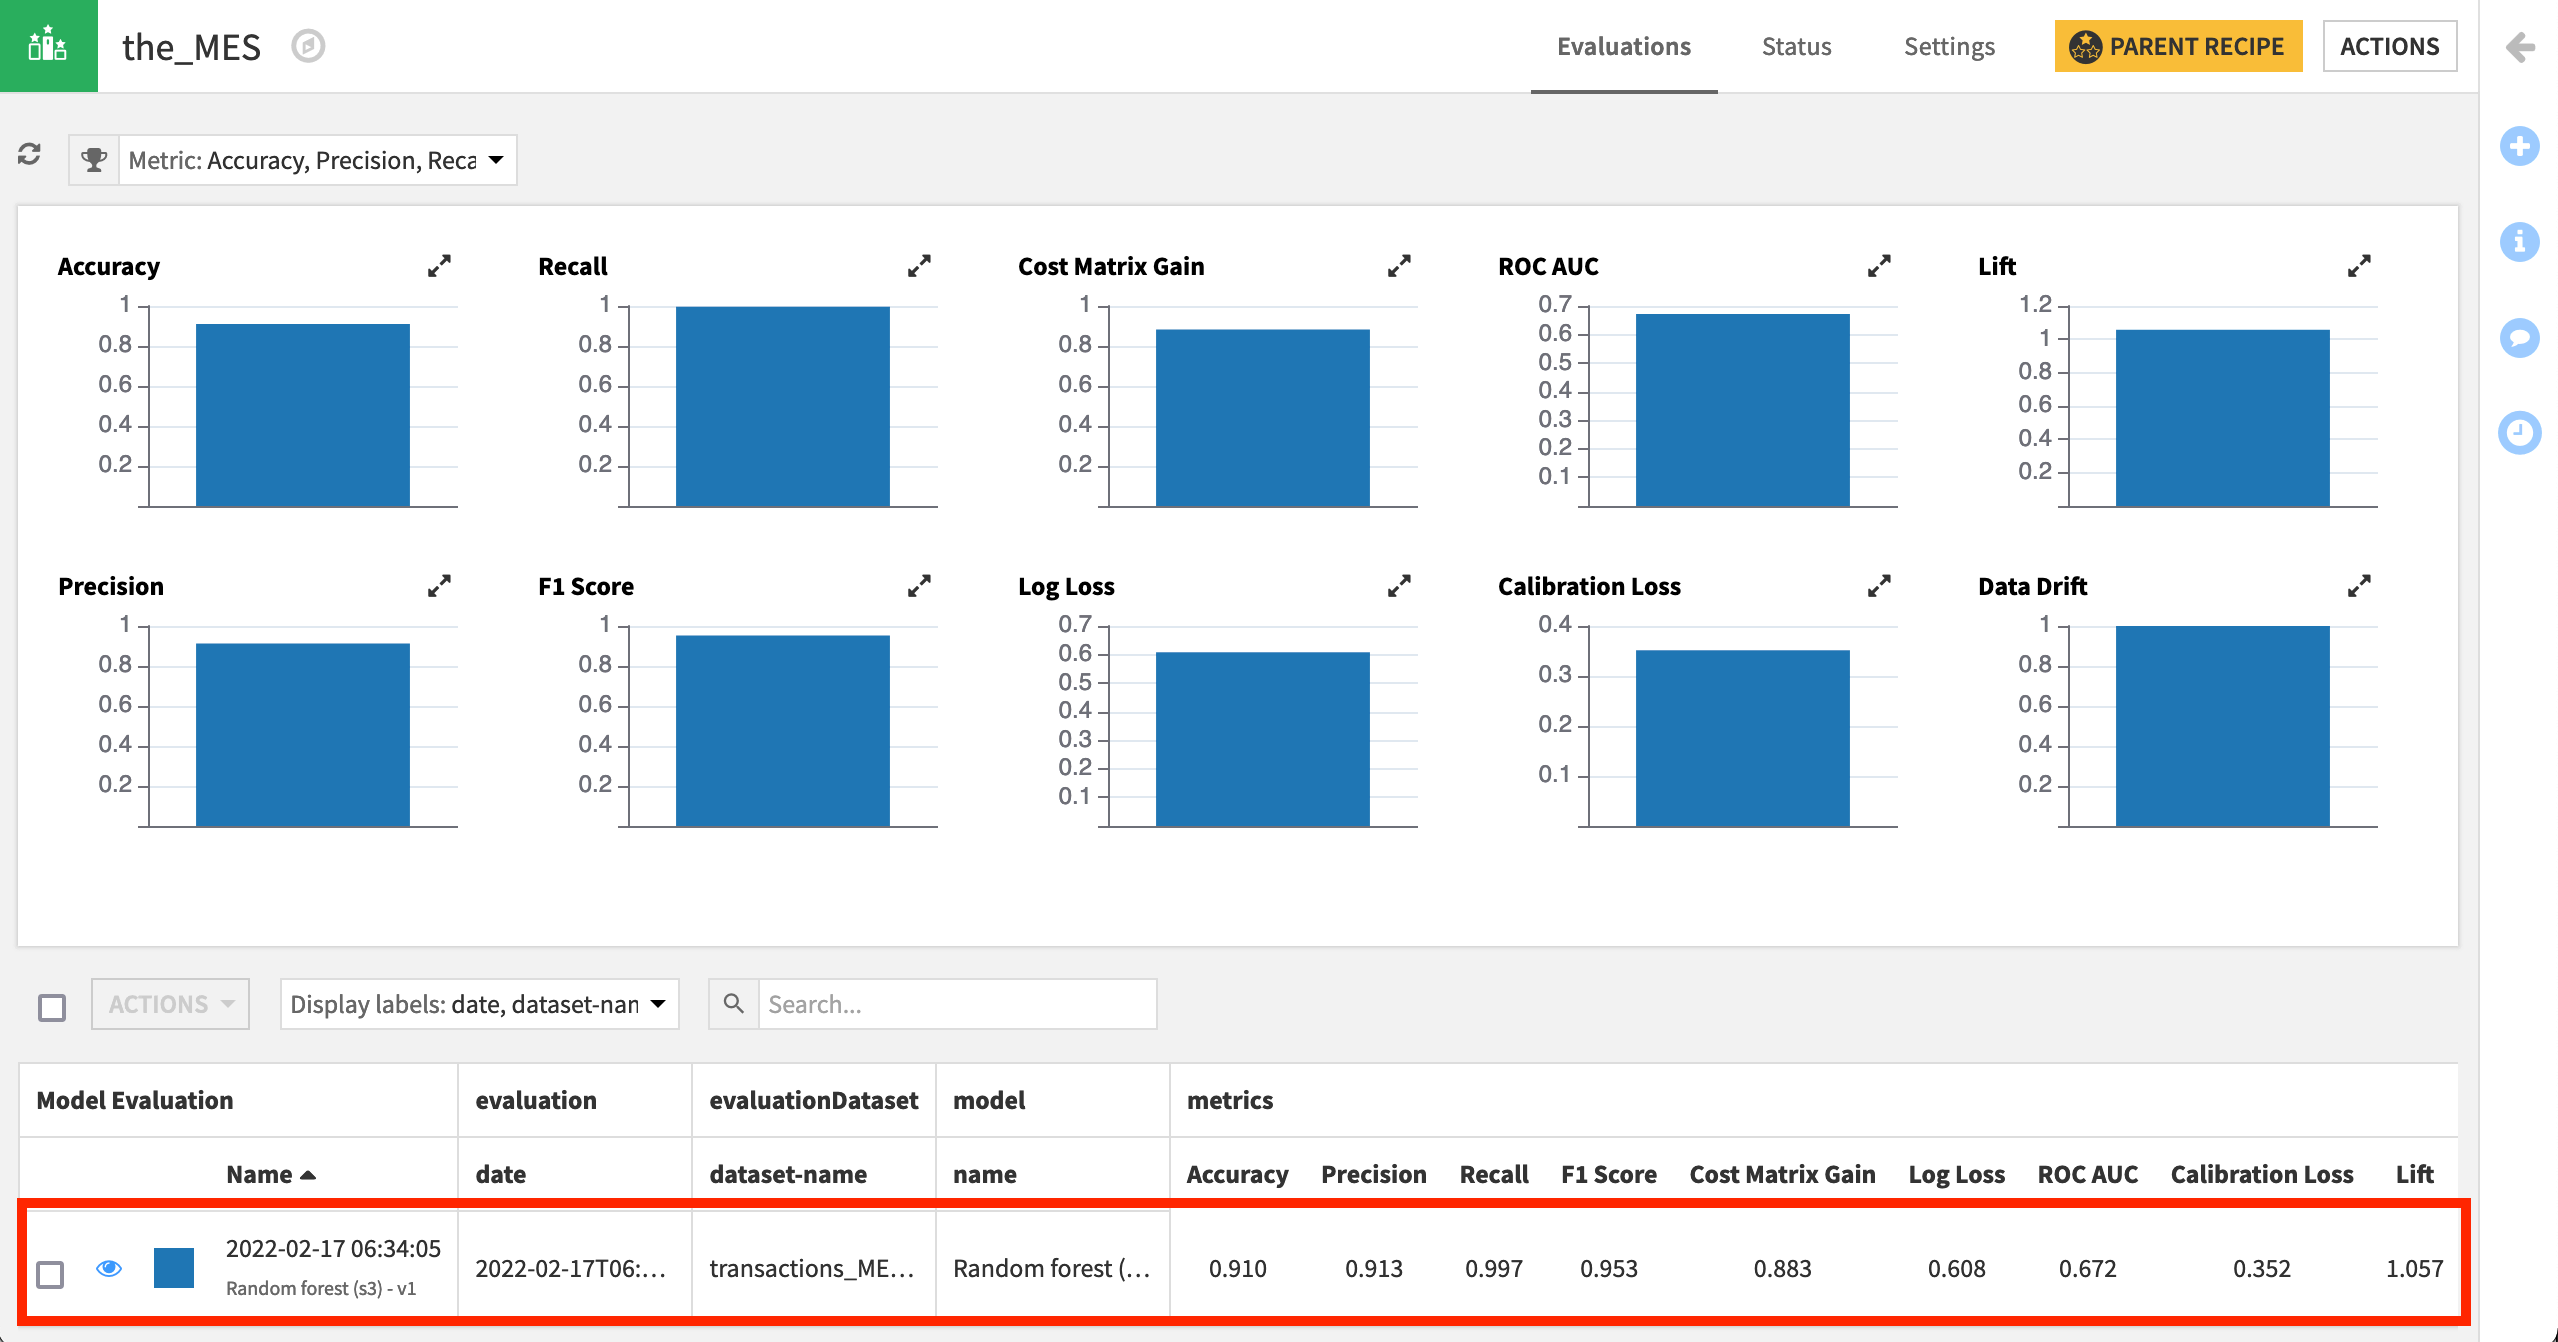
Although the model evaluation store and its metrics dataset were previously empty, now these objects should be filled with the result of one build run.
Tip
If the metrics dataset is empty, try refreshing the sample to see the new records.
Note
For an introduction to model evaluation stores, please see this section of the product documentation or this article in the Knowledge Base.
Review the Initial Scenario
Is this scenario ready to be run in a production environment? Although functionally it could, it would most likely be a bad idea to do so.
The existing scenario has no safeguards as the project ingests new production data into the pipeline. For example, a schema change in an input dataset could easily break the pipeline. The project could also ingest poor quality data, or data very different from what we expect.
If there are schema changes to an input dataset, we want to identify them as soon as possible, and pinpoint why our Flow is broken. Similarly, if a new input dataset has significantly different qualities than what we expect, we want to know as soon as possible and avoid wasting time and computational resources on bad data.
We can add these safeguards by including in the scenario steps that compute metrics and run checks. We’ll demonstrate two examples:
a schema integrity check at the very beginning of the Flow.
a data quality check to determine if the new batch of data meets our expectations.
Add Schema Integrity Checks
This tutorial begins from uploaded datasets to simplify the import process. However, in most cases (especially if moving to a production environment), it’s likely that our data will be coming from a source external to Dataiku DSS, such as a database.
Before attempting to build the Flow, we should check that the new batch of input data has arrived exactly as we expect. Let’s demonstrate how this could be done on the transactions dataset by checking to see it has a certain number of columns and a certain minimum number of records (which is more of a data quality check but works here too).
Create Schema Integrity Metrics
To create these checks, we have to start by defining metrics.
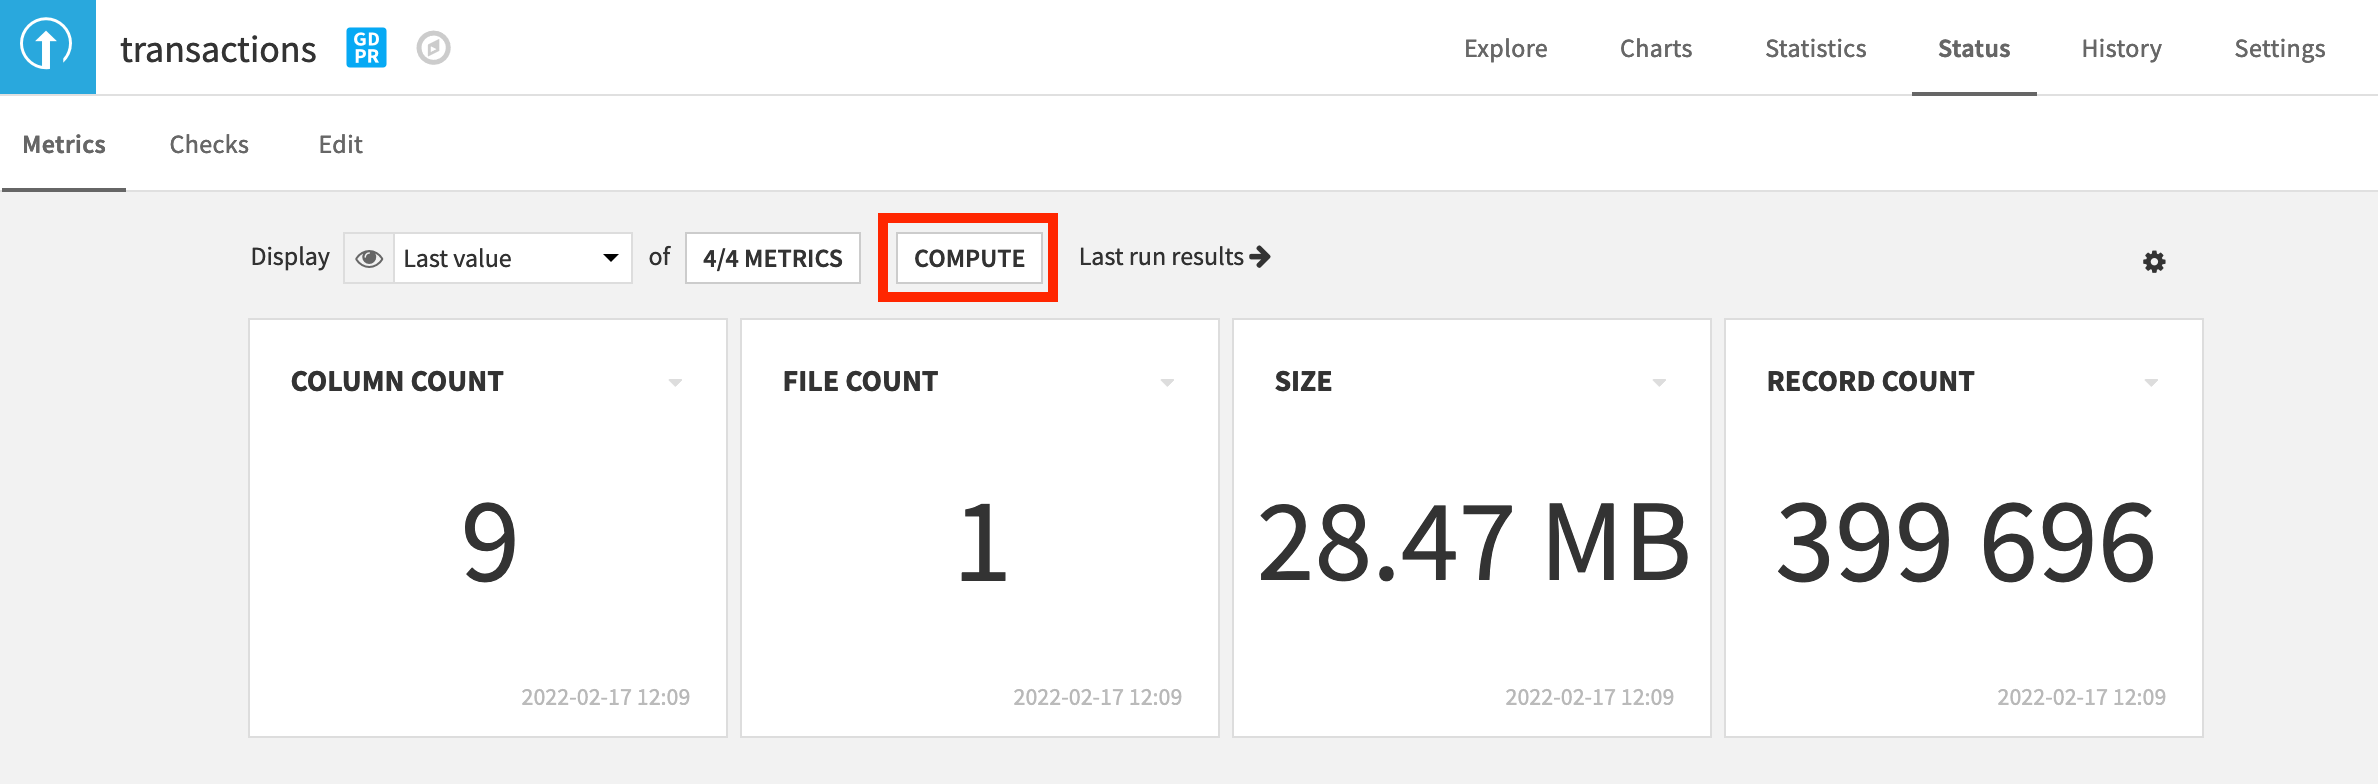
Navigate to the Status tab of the transactions dataset, and click Compute to calculate the default metrics, such as column count.
Create Schema Integrity Checks
Once we have dataset metrics, we can use them as the basis for our checks. Let’s start by generating an error if the dataset has a different number of columns from what we expect.
Navigate to the Edit Checks tab of the transactions dataset.
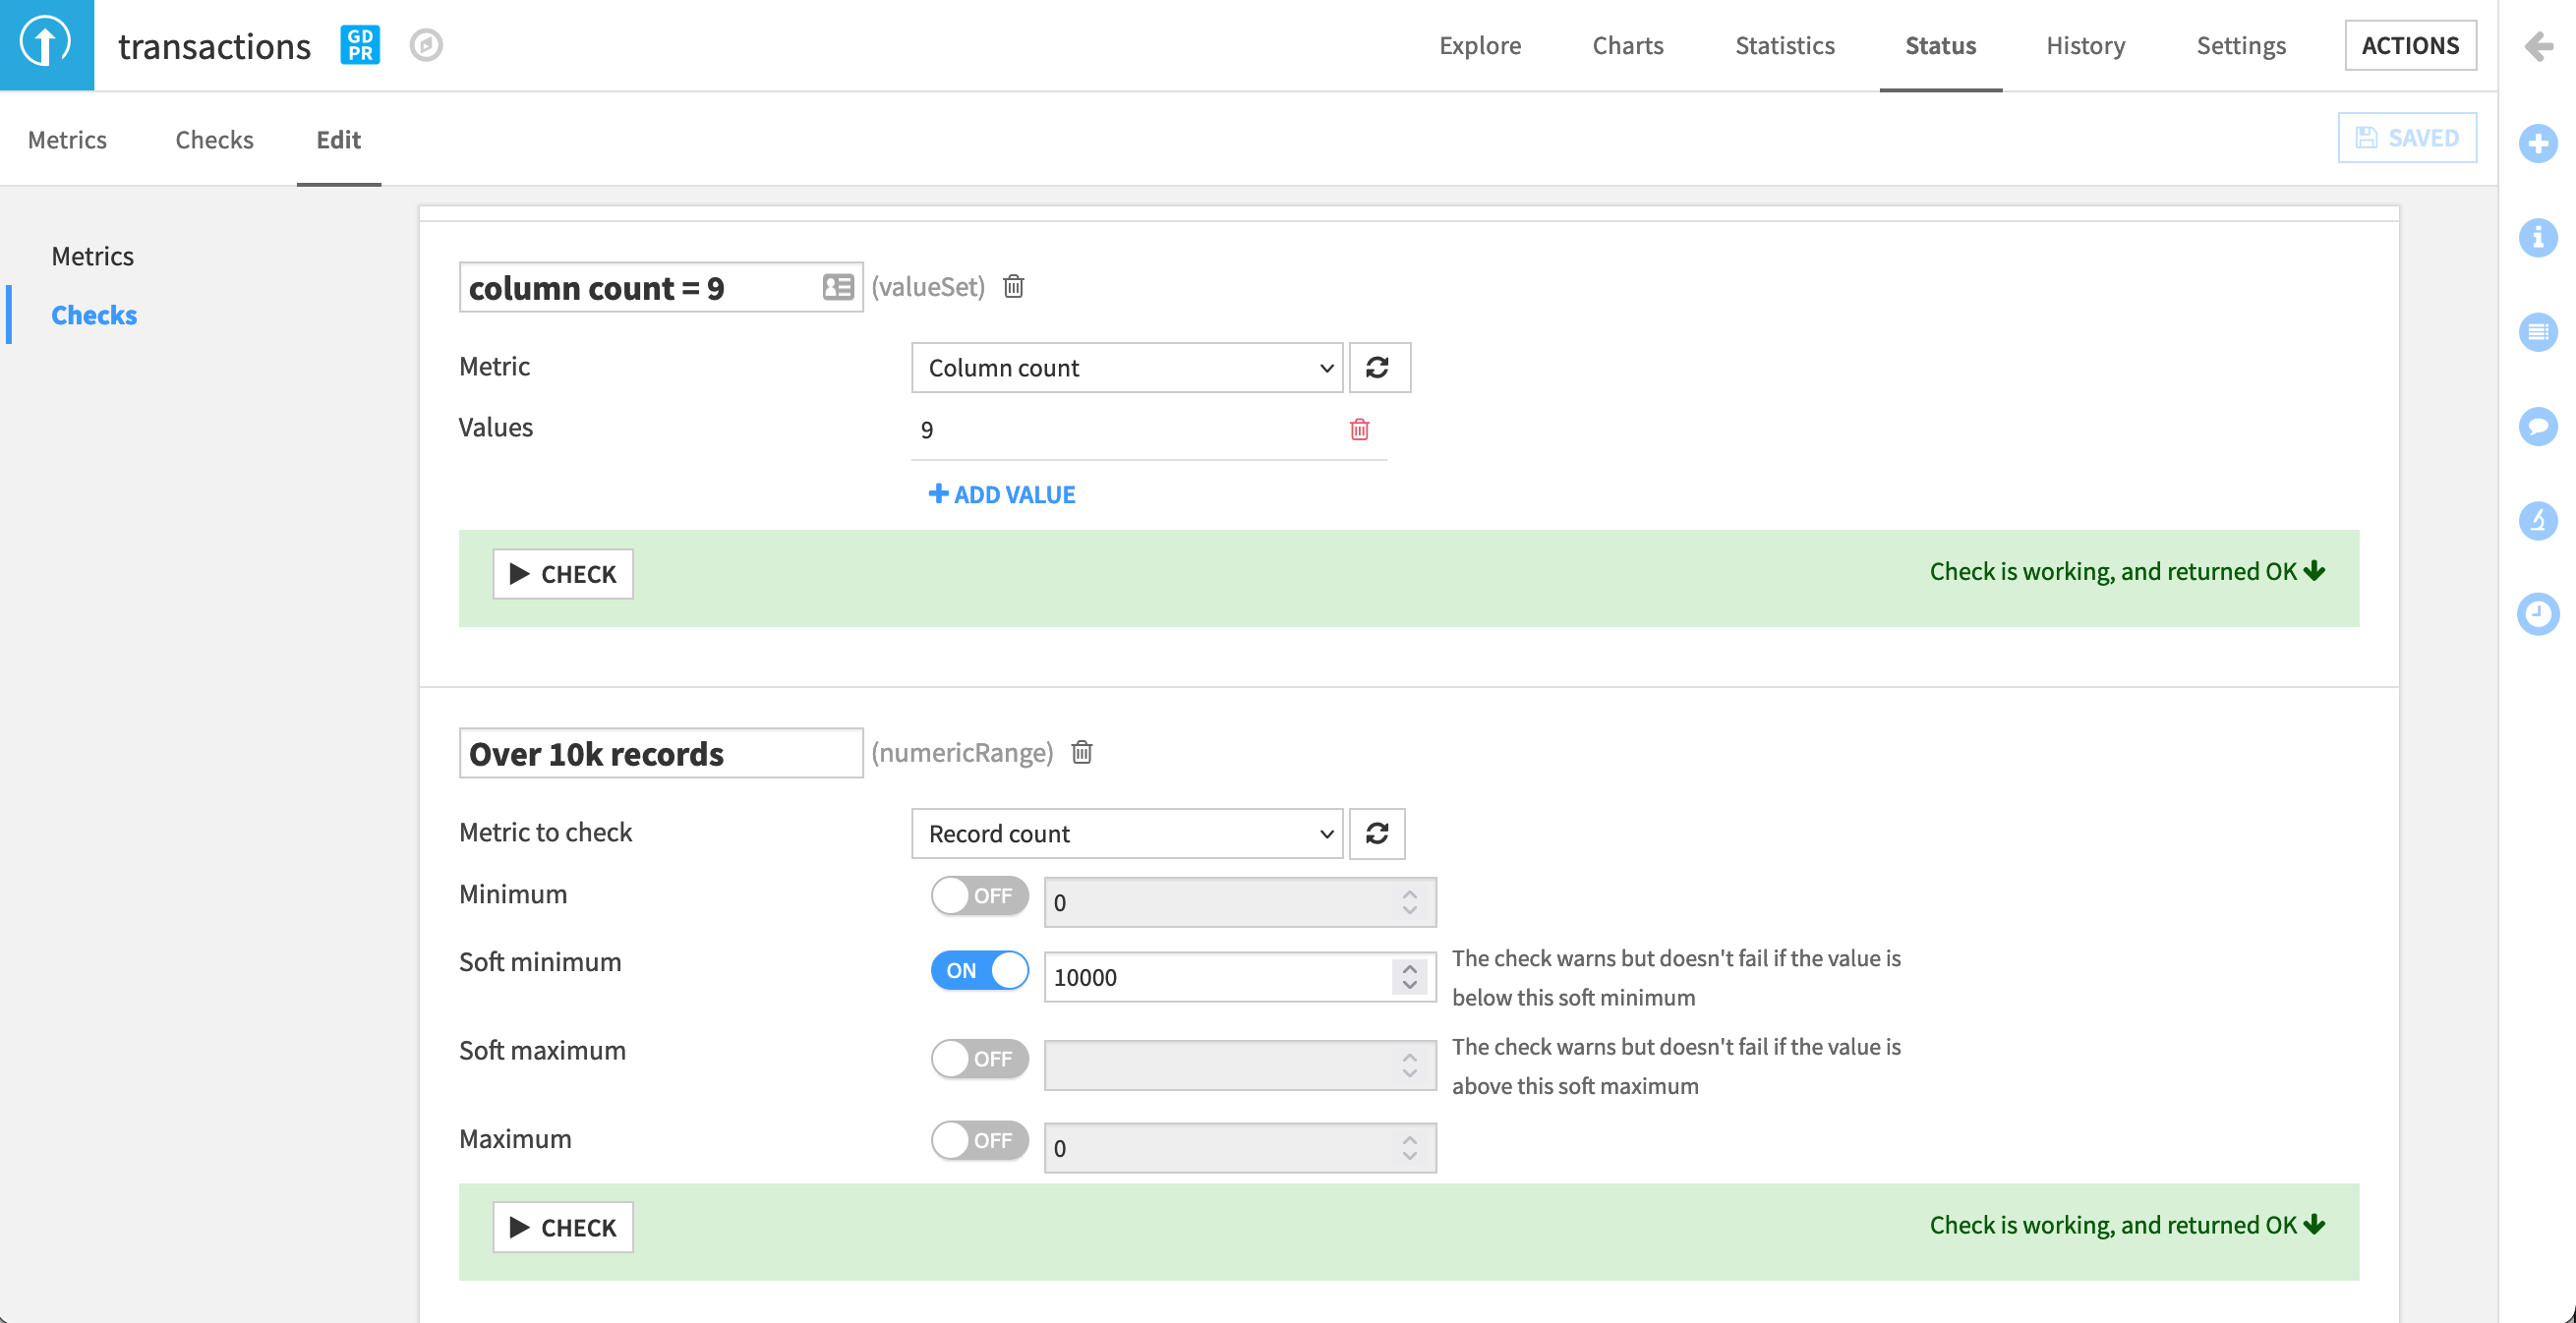
Click “Metric Value is in a Set of Values”.
Name the check
column count = 9, with the metric being “Column count”, and value being9.
Now let’s ensure we get a warning (instead of an error) if the dataset has fewer than 10,000 records—a very odd result for this use case that we’d want to investigate.
Click “Metric Value is in a Numeric Range”.
Name the check
Over 10k records, with the metric being “Record count”, and the soft minimum being10000.For both metrics, click the Check button to ensure it returns “OK”, and then Save the new checks.
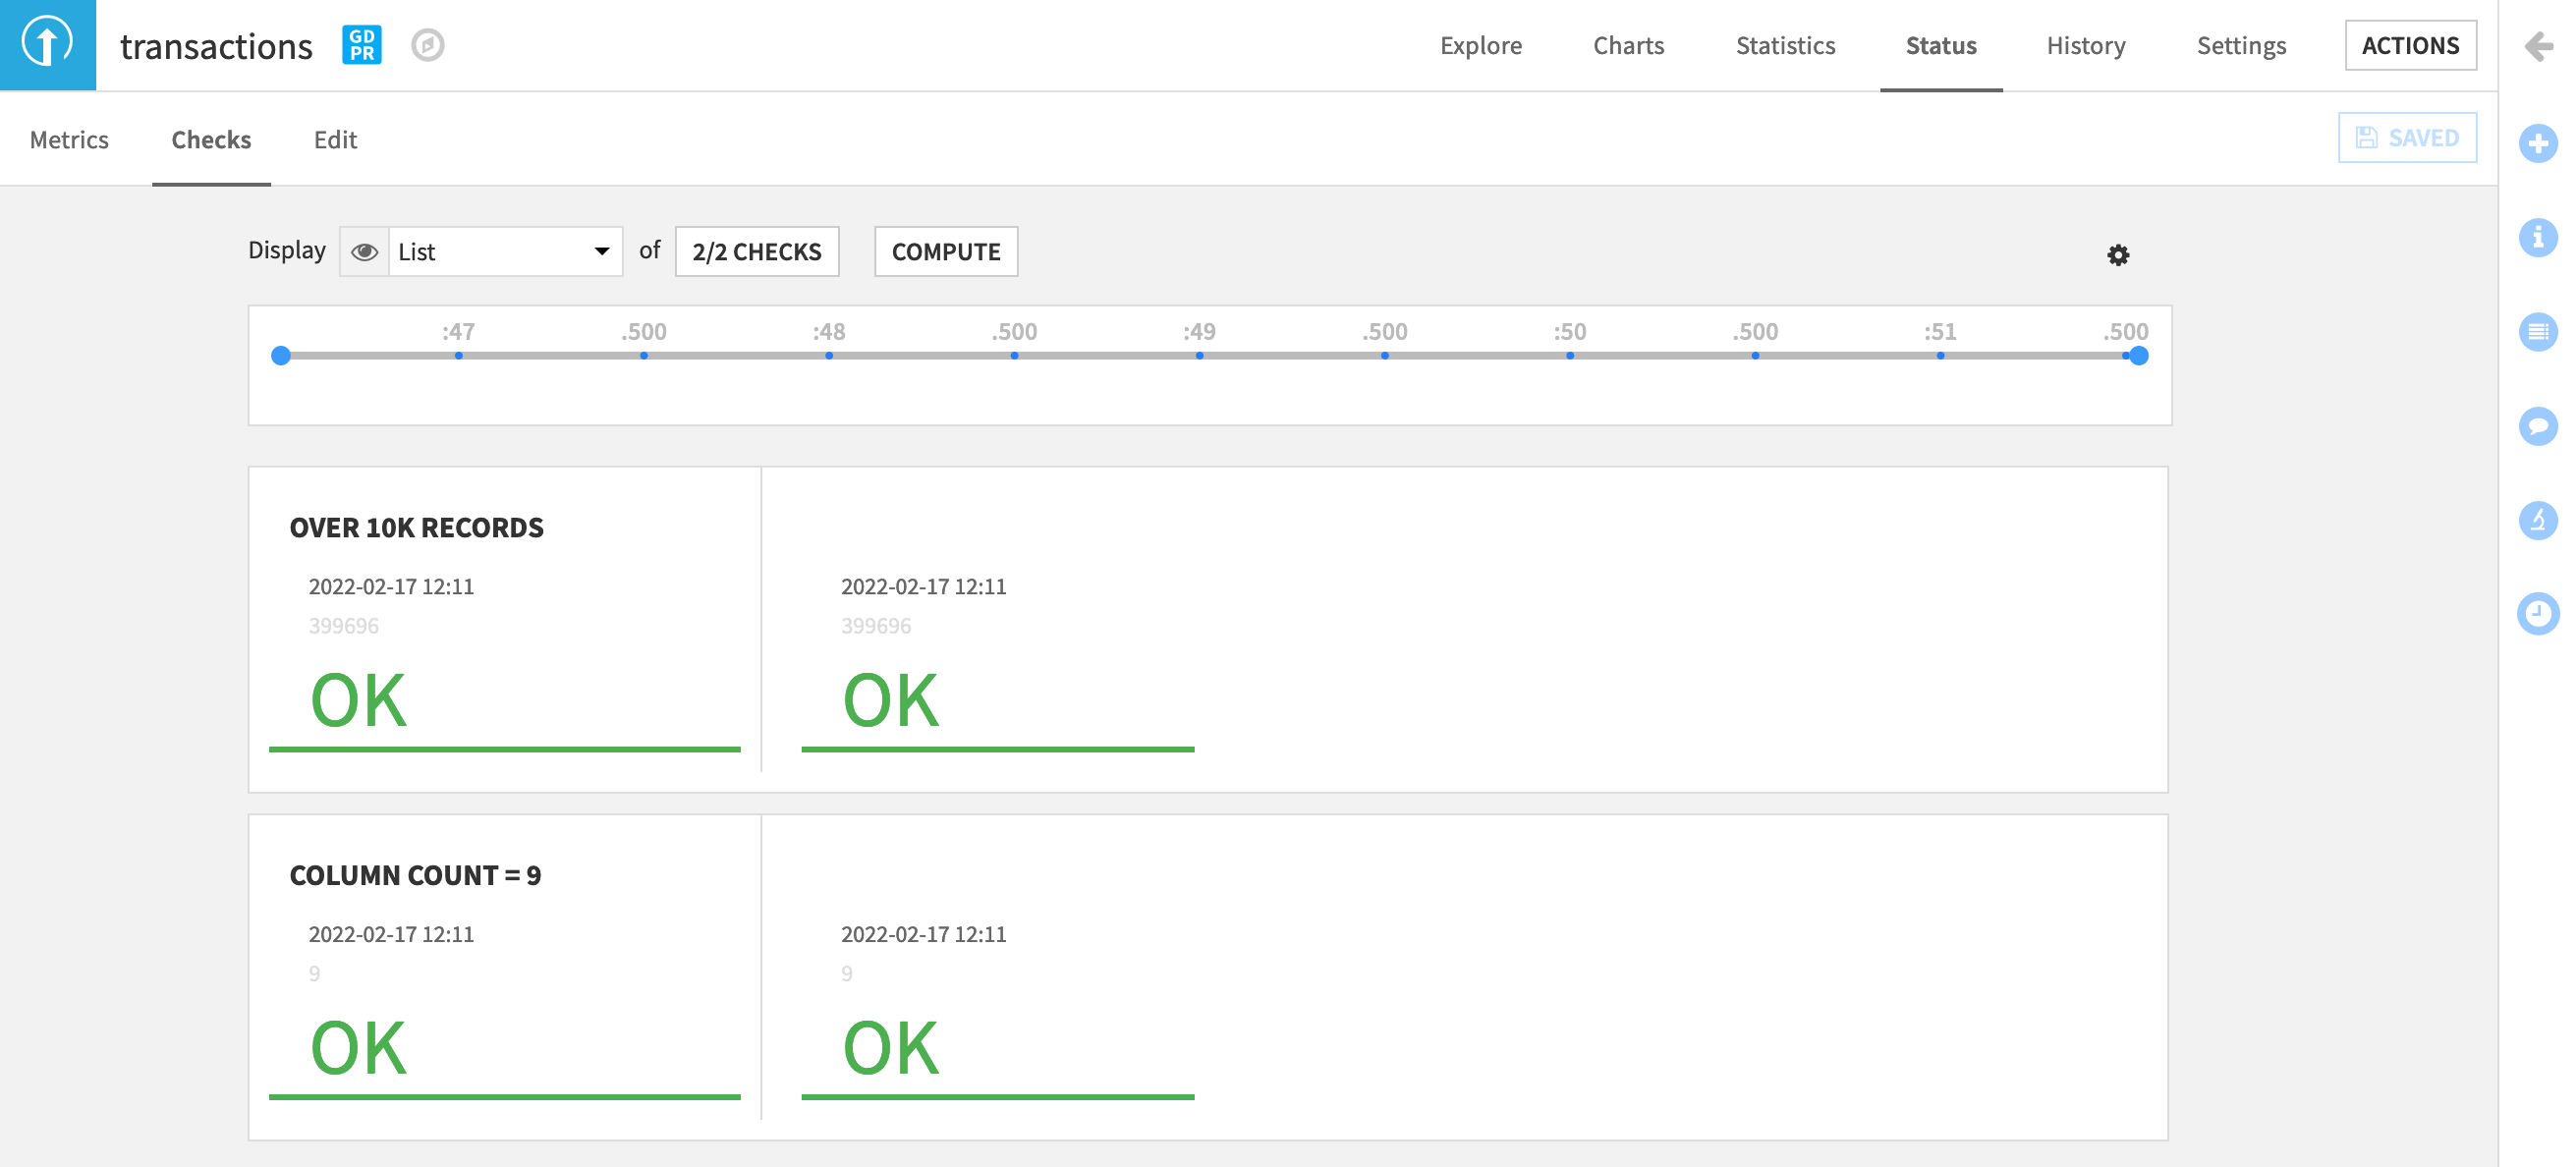
Navigate to the Checks subtab, and display the new checks. Both should return “OK”. If they are empty, click Compute to calculate them.
Tip
If unfamiliar with this process, adjust the values of these metrics on your own to simulate warnings and errors. Then switch back to the correct values that return “OK”. If you find creating these metrics and checks difficult, return to other tutorials in the Academy course on automation.
Add Data Quality Checks
Although these initial schema integrity checks may pass, new batches of data may still significantly differ in other ways from what we expect. Let’s add data quality checks further down the pipeline.
Create Data Quality Metrics
This time, we’ll need to create our own metrics instead of using the default metrics.
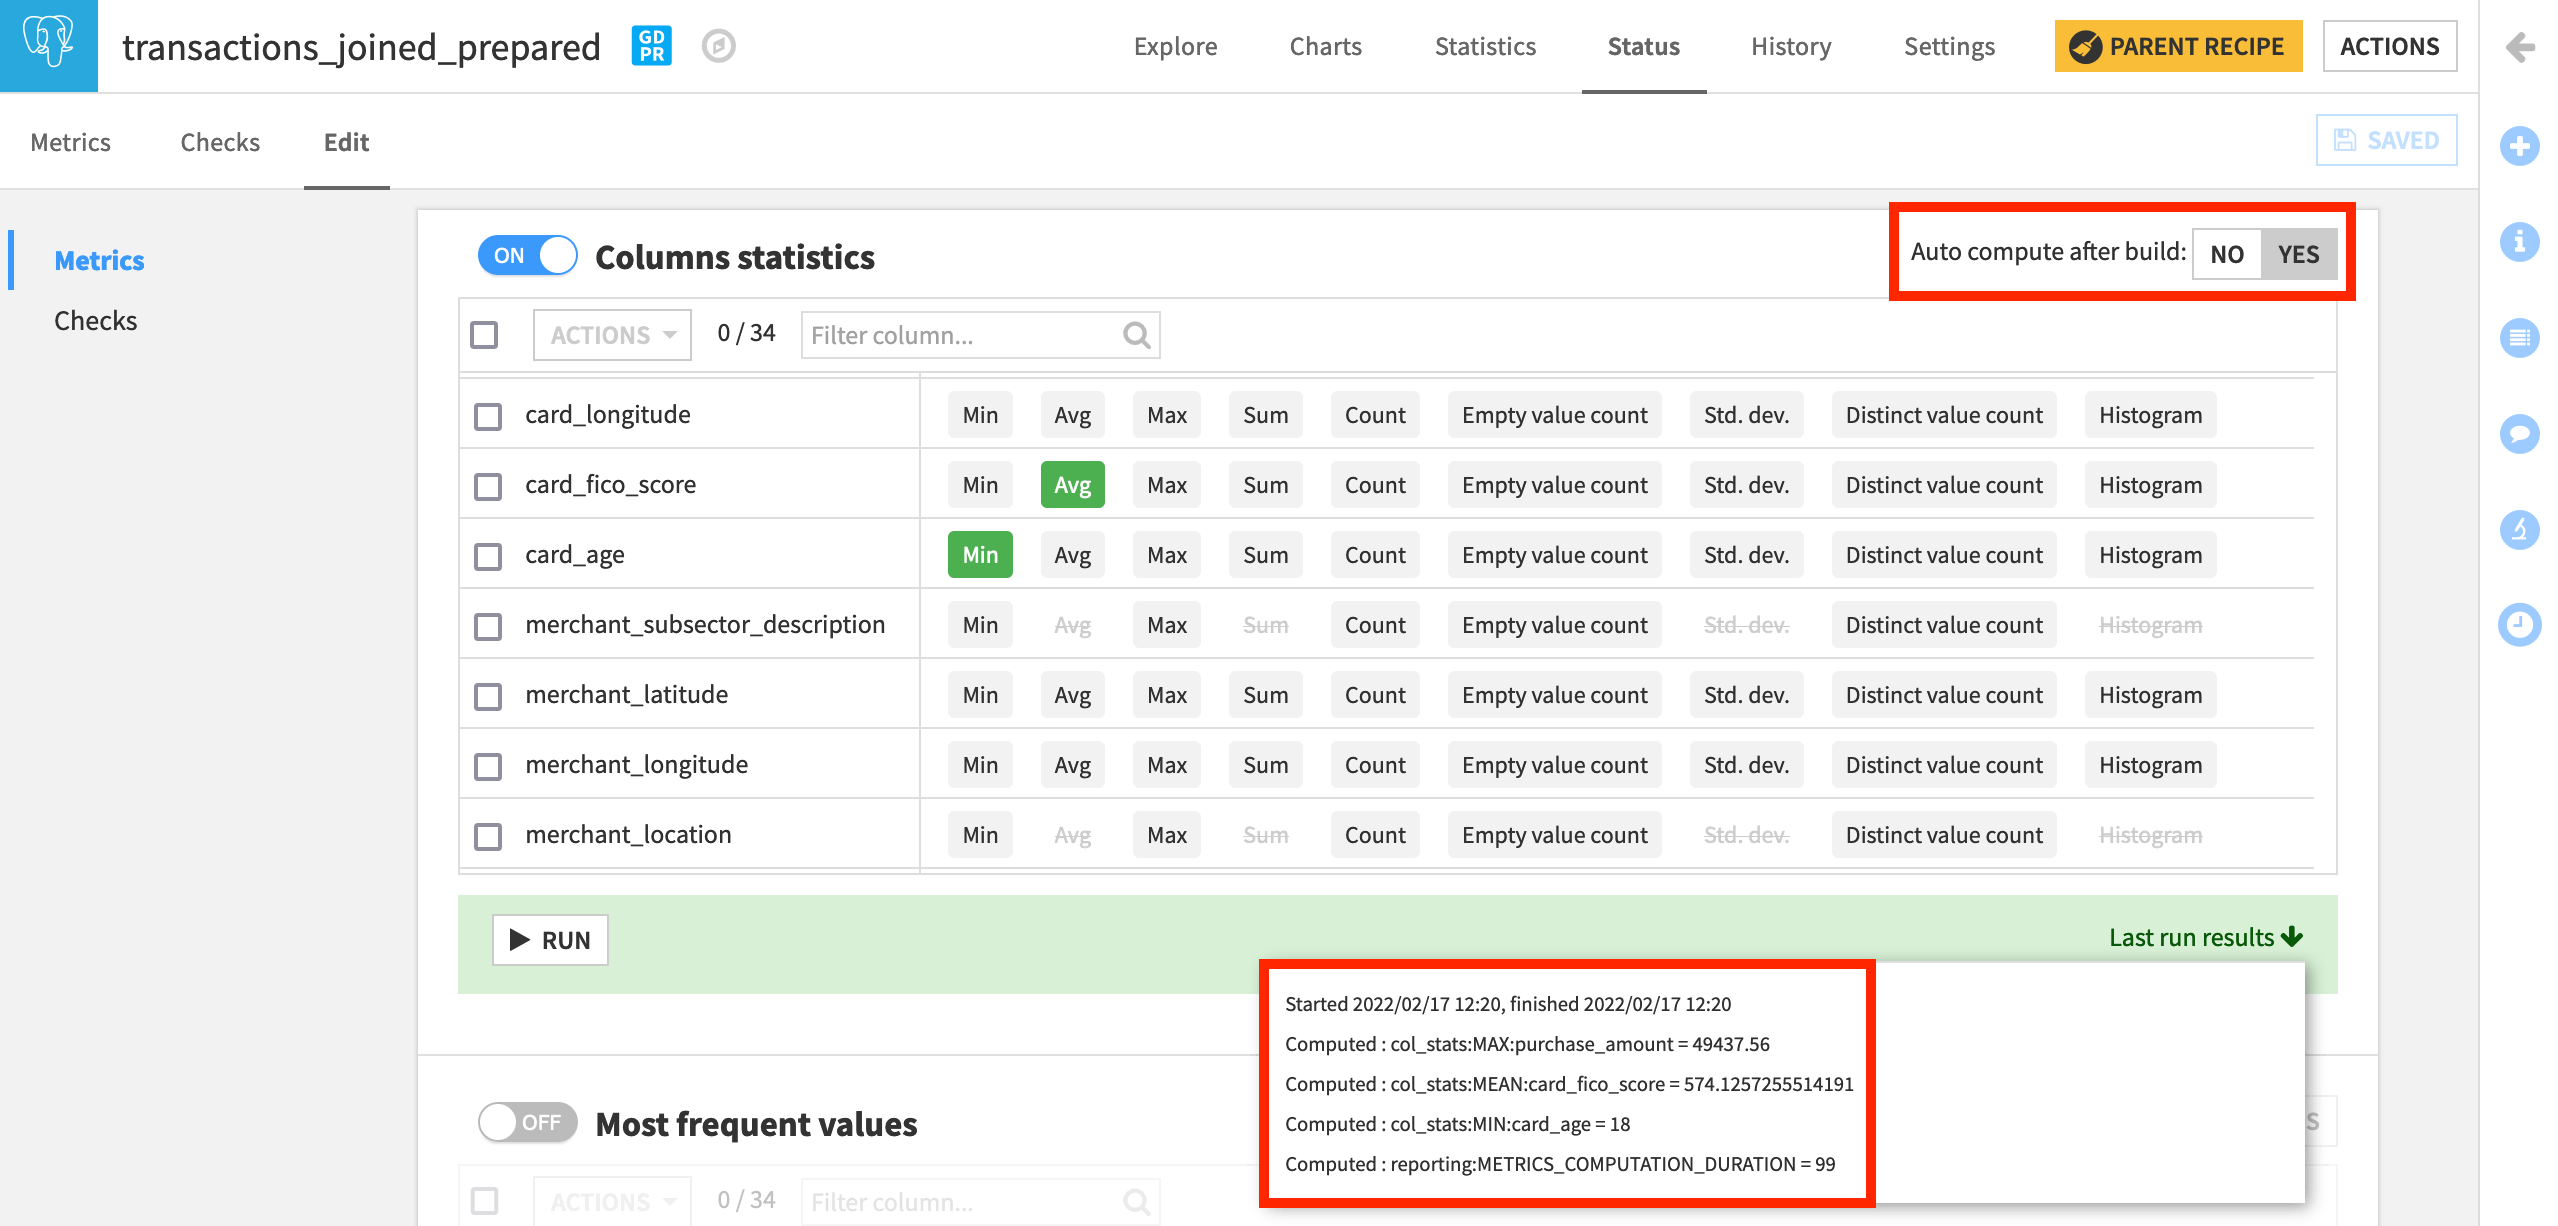
Navigate to the Status tab of the transactions_joined_prepared dataset.
Within the “Edit Metrics” subtab, turn on the Column Statistics section, and add:
“Min” of card_age,
“Max” of purchase_amount, and
“Avg” of card_fico_score.
Click to run them now.
Dataiku also provides the option to auto-compute metrics after a build. To demonstrate the consequence of this action, let’s turn this on.
For the section of metrics called “Column Statistics”, turn “Auto compute after build” to Yes, and save the result.
Although you’ve computed these metrics, to use them in checks, you need to display them first.
Return to the Metrics subtab, and display the three new checks. Compute them if not already having done so.
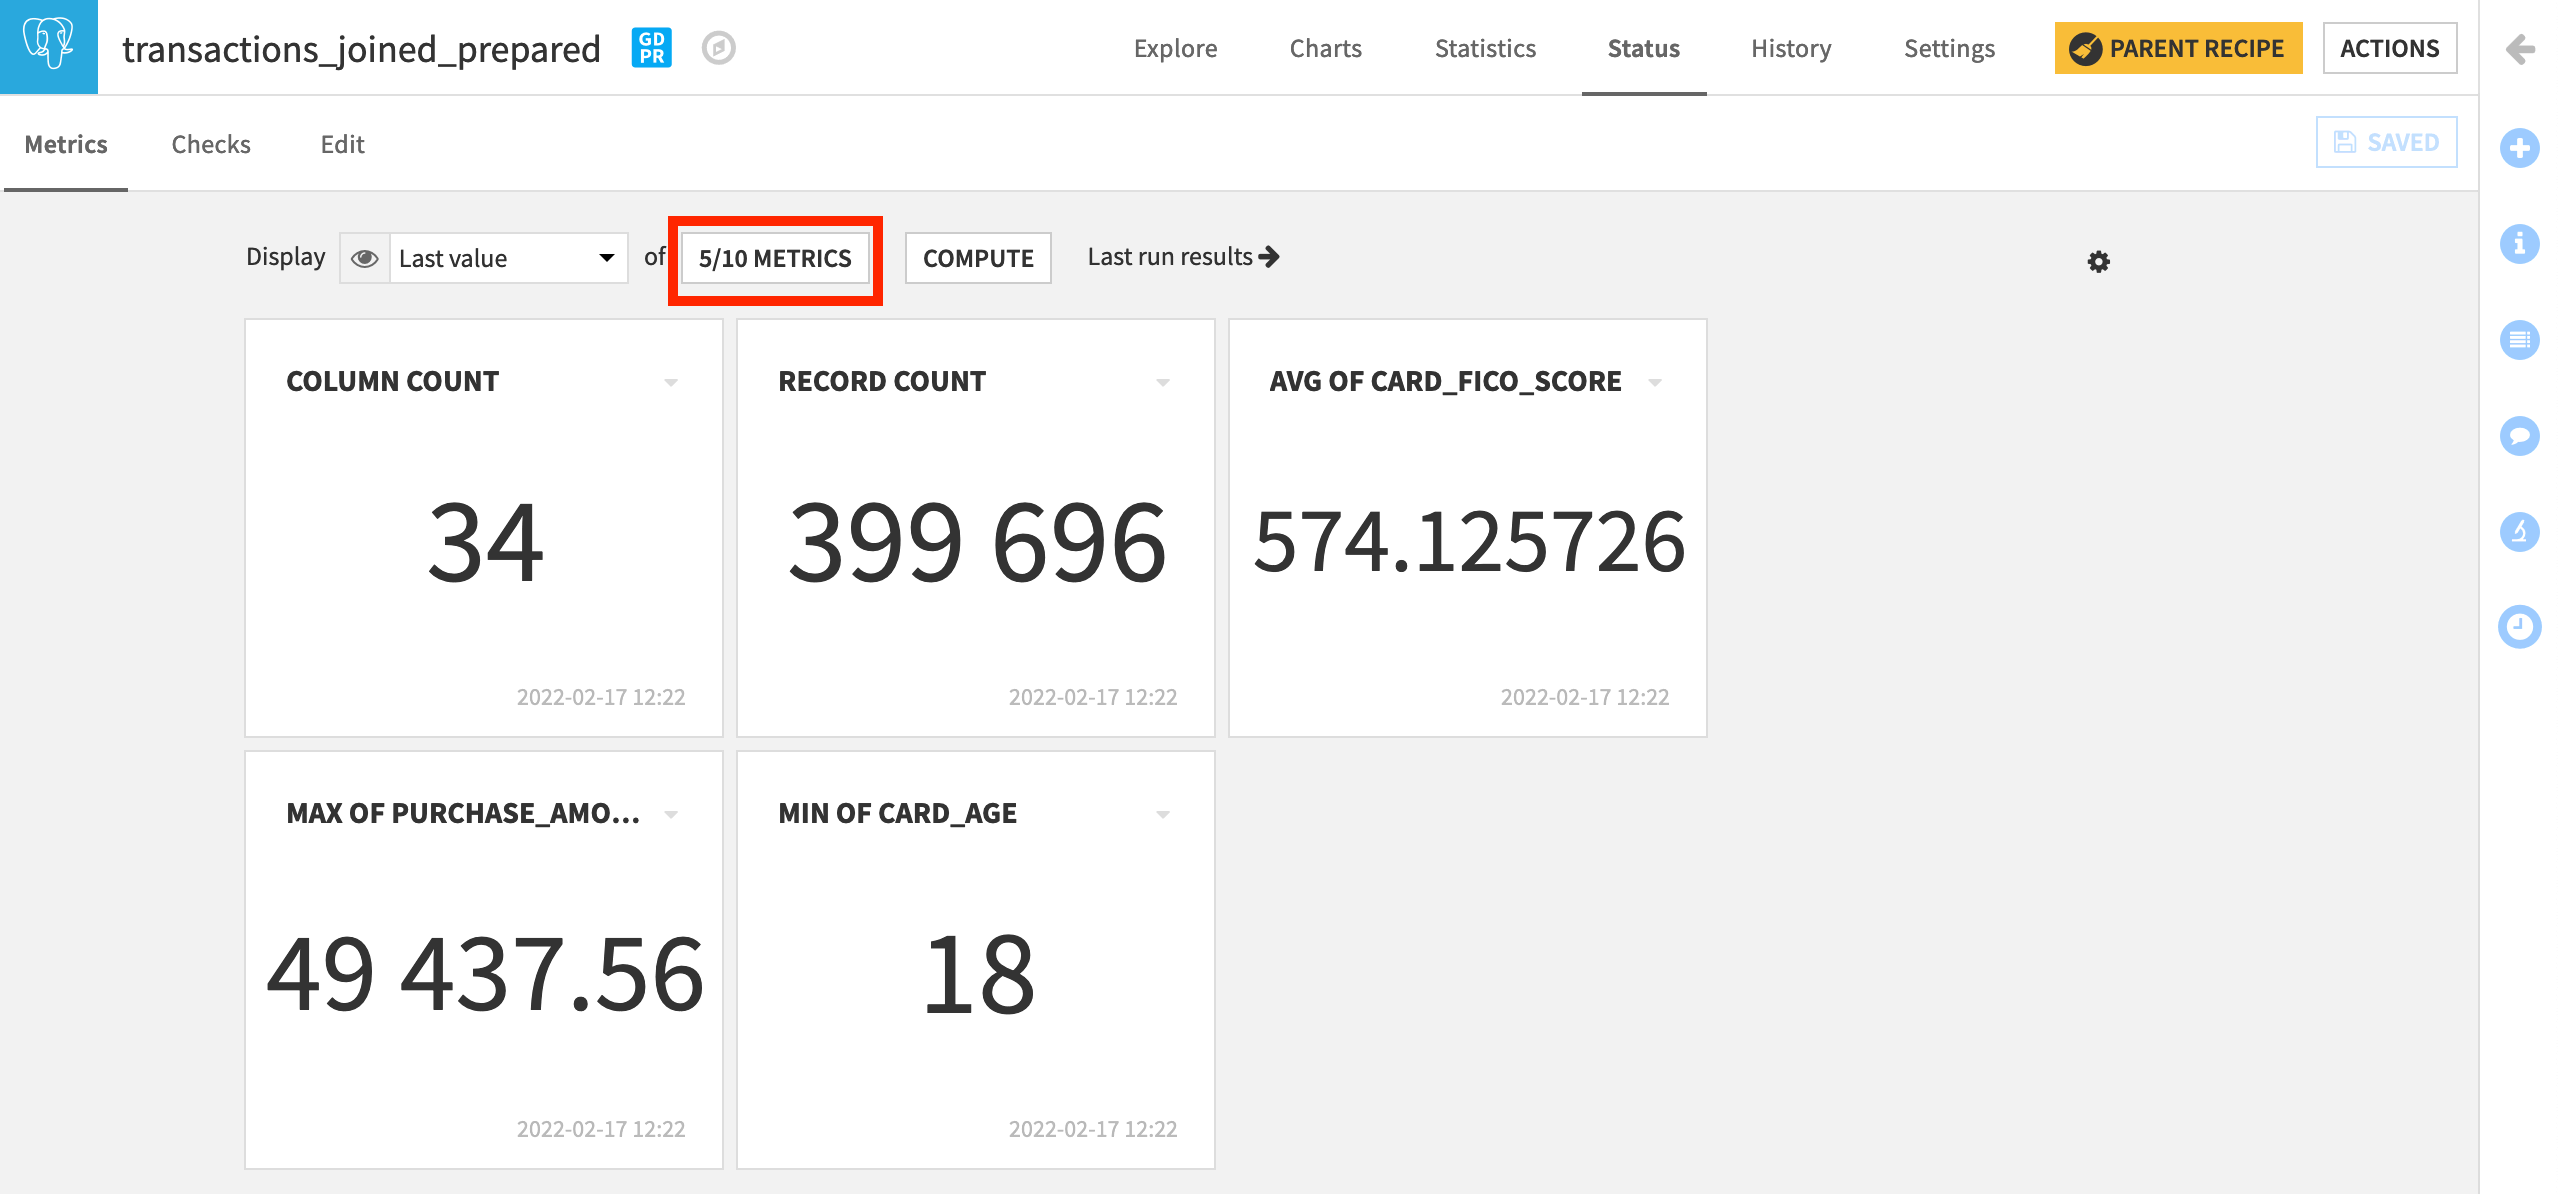
Create Data Quality Checks
In this current dataset, the maximum card purchase, for example, is close to $50,000. As before, the next step is to turn these metrics into checks based on our expectations about the data.
A non-positive card_age would be nonsensical.
Navigate to the Edit Checks panel.
Click “Metric Value is in a Numeric Range”.
Name the check
min card age > 0, with the metric being “Min of card_age”, and the minimum being0.
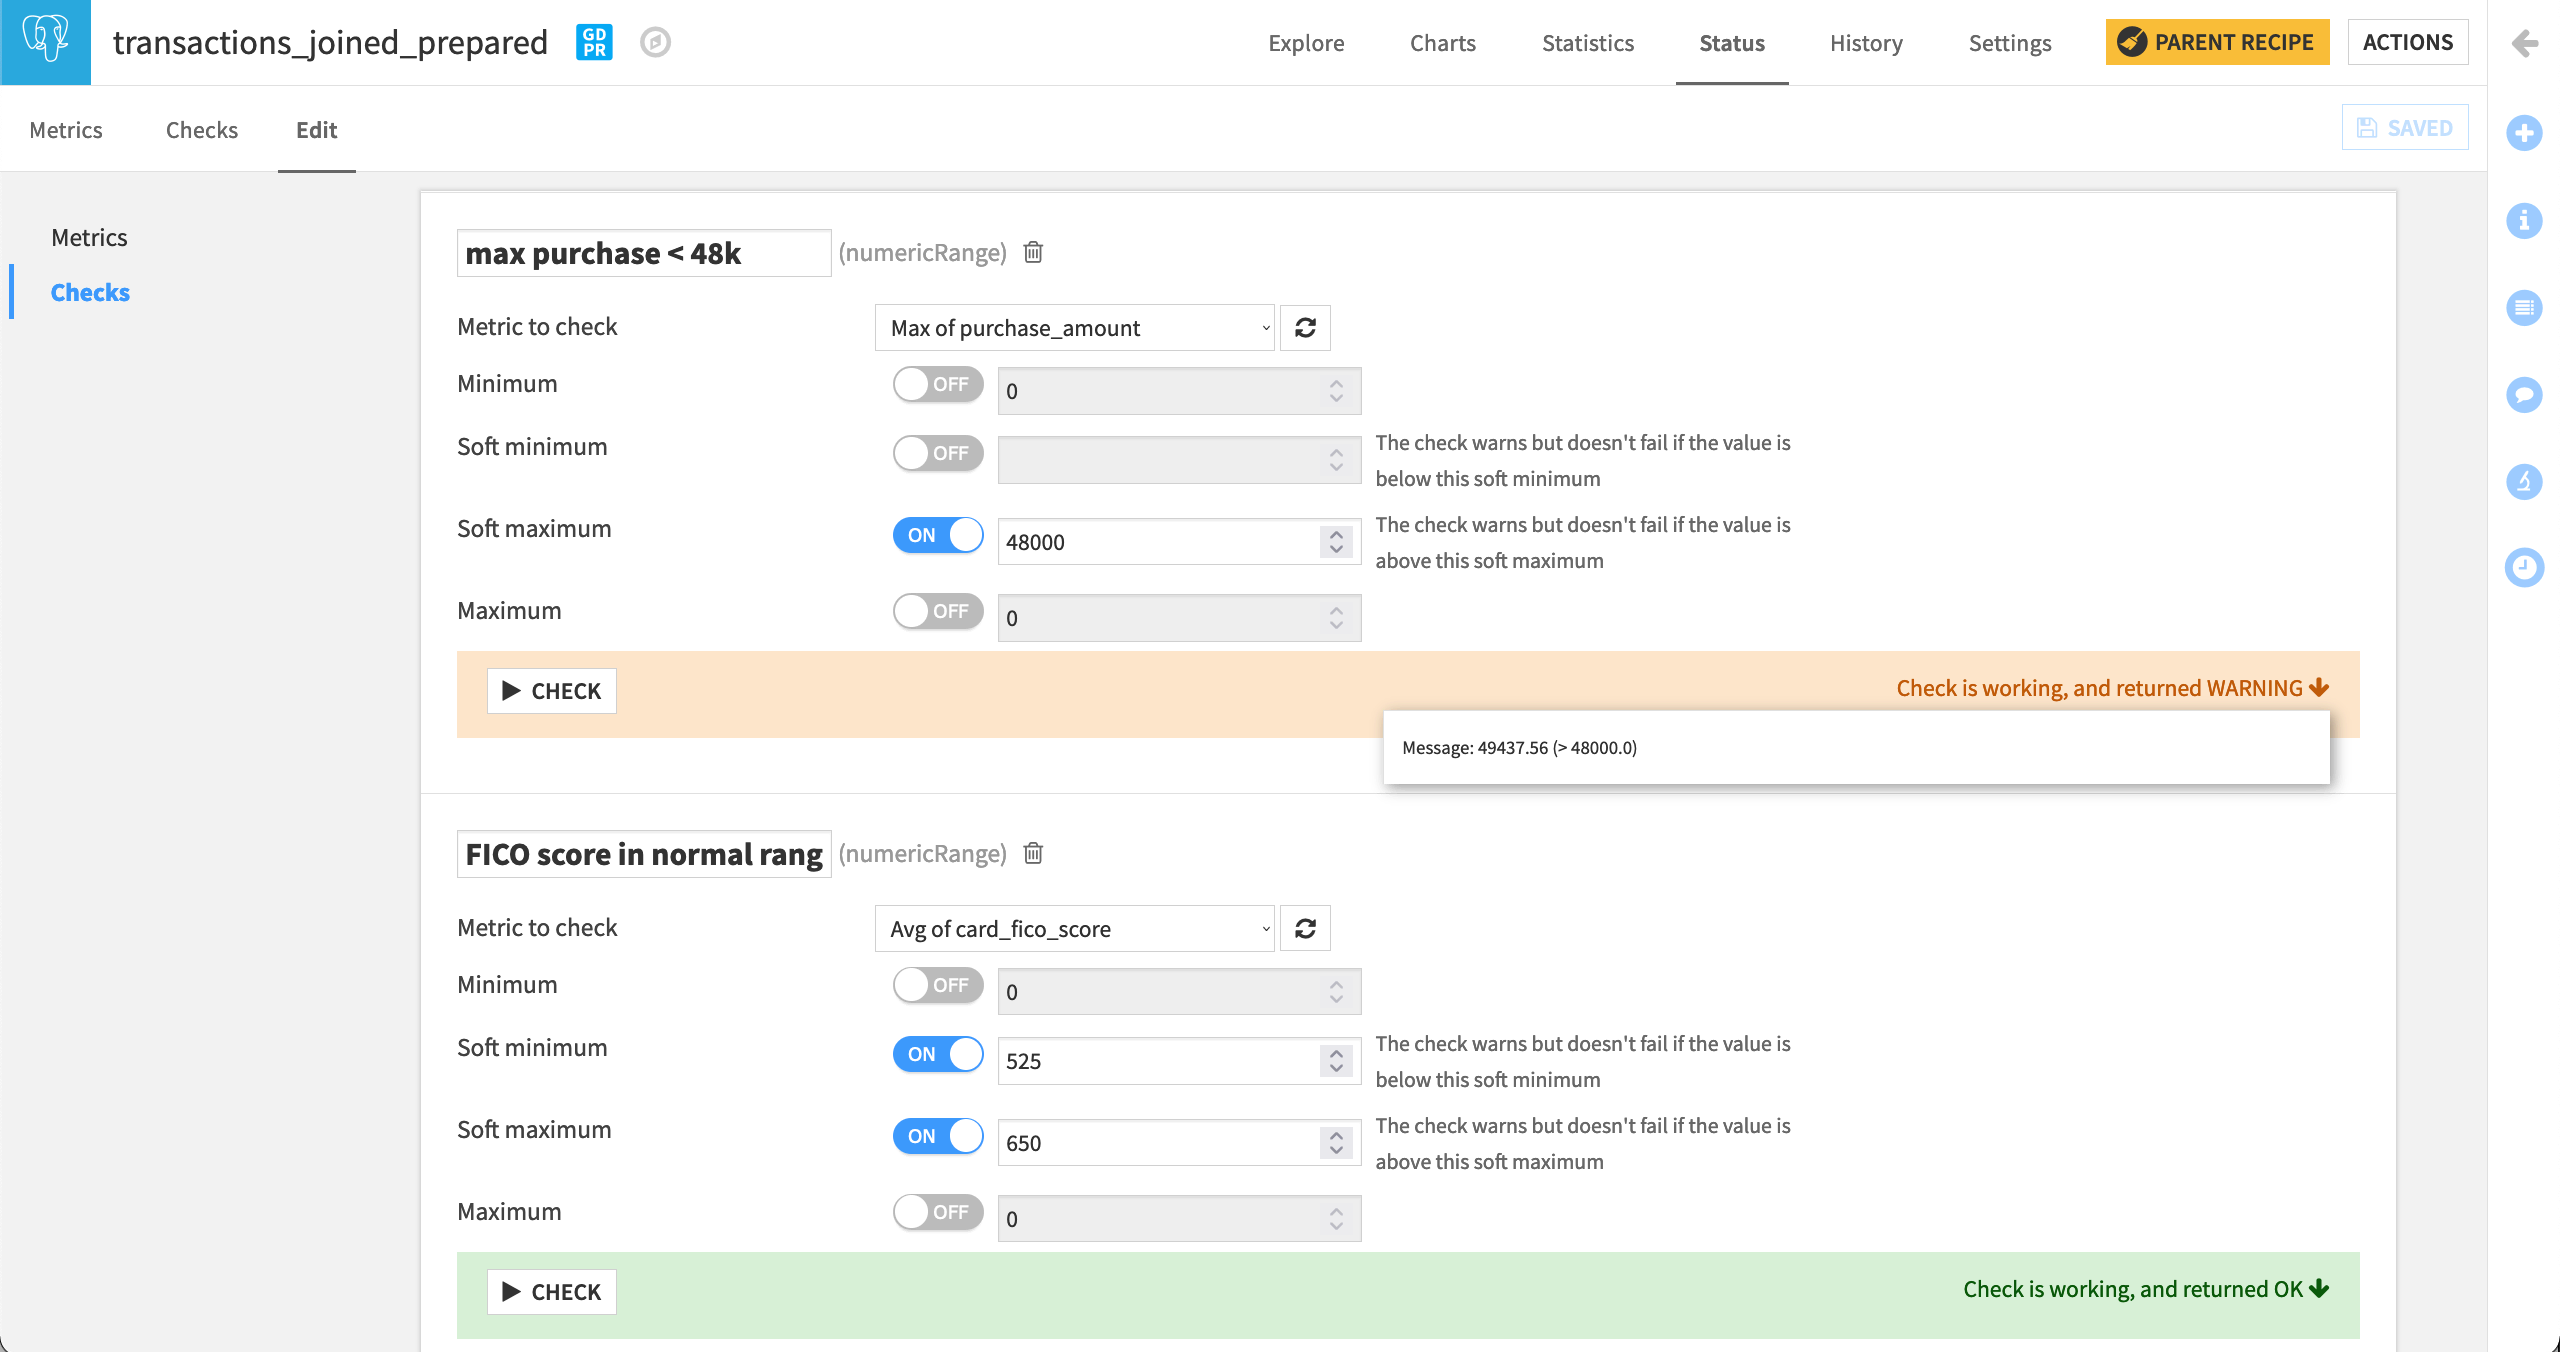
We also have certain expectations about what the maximum purchase_amount should be. Maybe the current maximum value is suspiciously high.
Click “Metric Value is in a Numeric Range”.
Name the check
max purchase < 48k, with the metric being “Max of purchase_amount”, and the soft maximum being48000.
Finally, since FICO scores range from 300 to 850, and applying our domain knowledge, we have a clear knowledge of this distribution. We can check that the average FICO score for the entire batch of data is within a certain range.
Click “Metric Value is in a Numeric Range”.
Name the check
FICO score in normal range, with the metric being “Avg of card_fico_score”, and the soft minimum being525and the soft maximum being650.
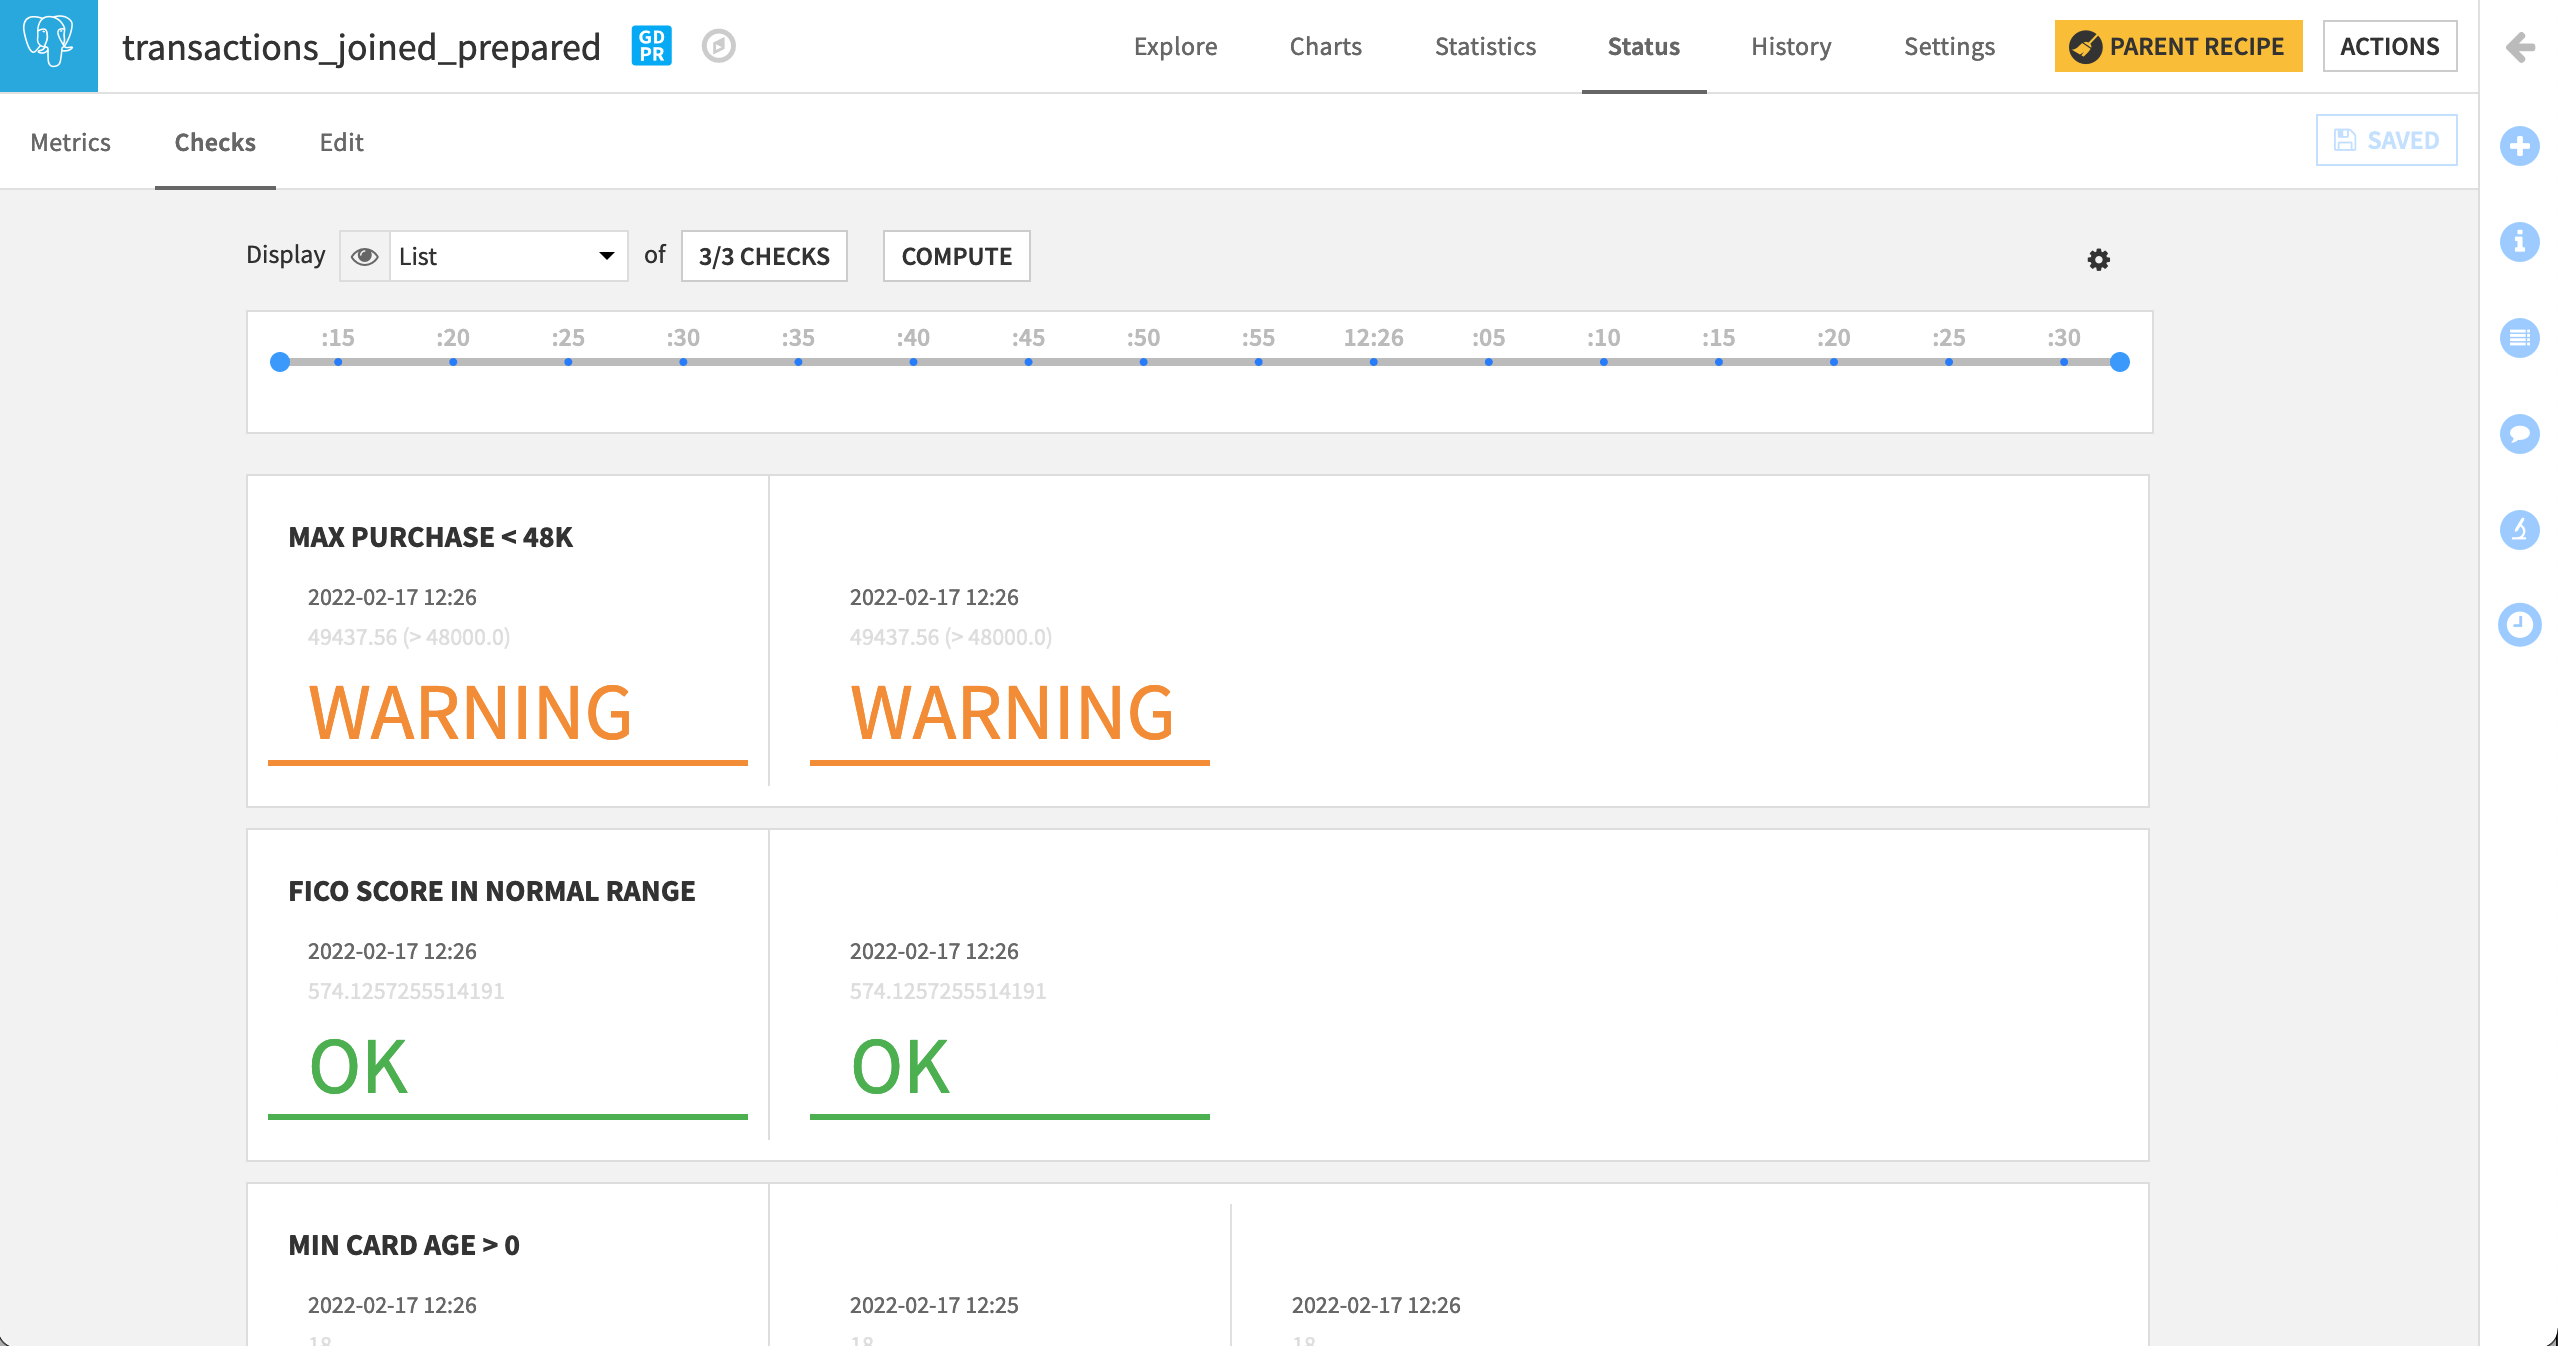
For all three checks, click the Check button to ensure it returns “OK” or “WARNING” in the case of the maximum purchase_amount, and Save the changes.
Once again, return to the Checks subtab to display all of the new checks.
Add Computation of Metrics and Checks to the Scenario
Remember our goal is to automatically run this Flow every quarter (three months) in a production environment. Although we have created metrics and checks based on our expectations of the data, we haven’t yet operationalized them. To do that, let’s incorporate their computation into the “Build Flow” scenario.
Add Scenario Steps
Scenarios allow for considerable flexibility to achieve your goals. Although there’s a number of different ways we could design this particular scenario, let’s try the following.
Add the Schema Integrity Steps
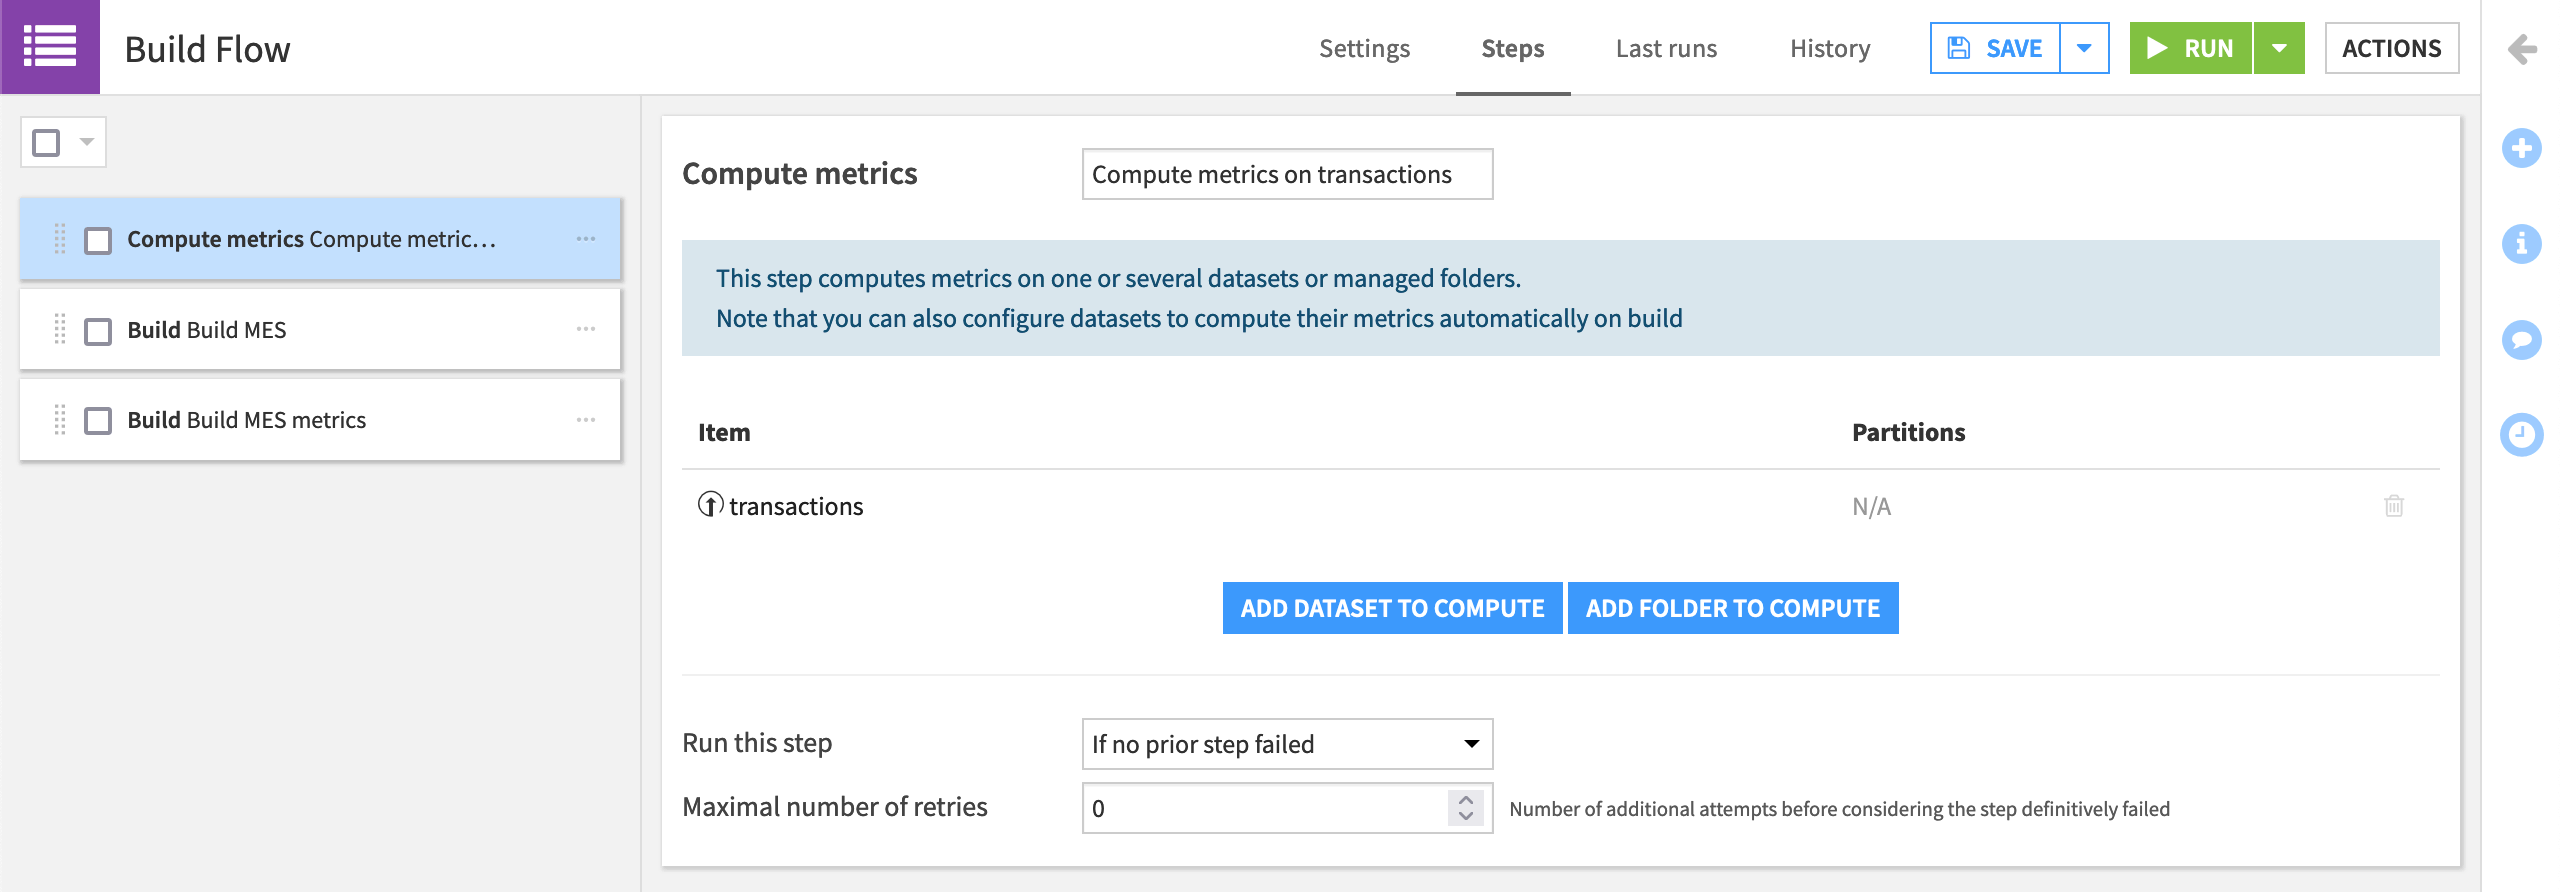
Return to the Steps tab of the “Build Flow” scenario.
Add a “Compute Metrics” step, and drag it to be the first in the scenario.
Select transactions, the dataset on which we added schema integrity checks, as the dataset on which to compute.
Rename the step
Compute metrics on transactions.
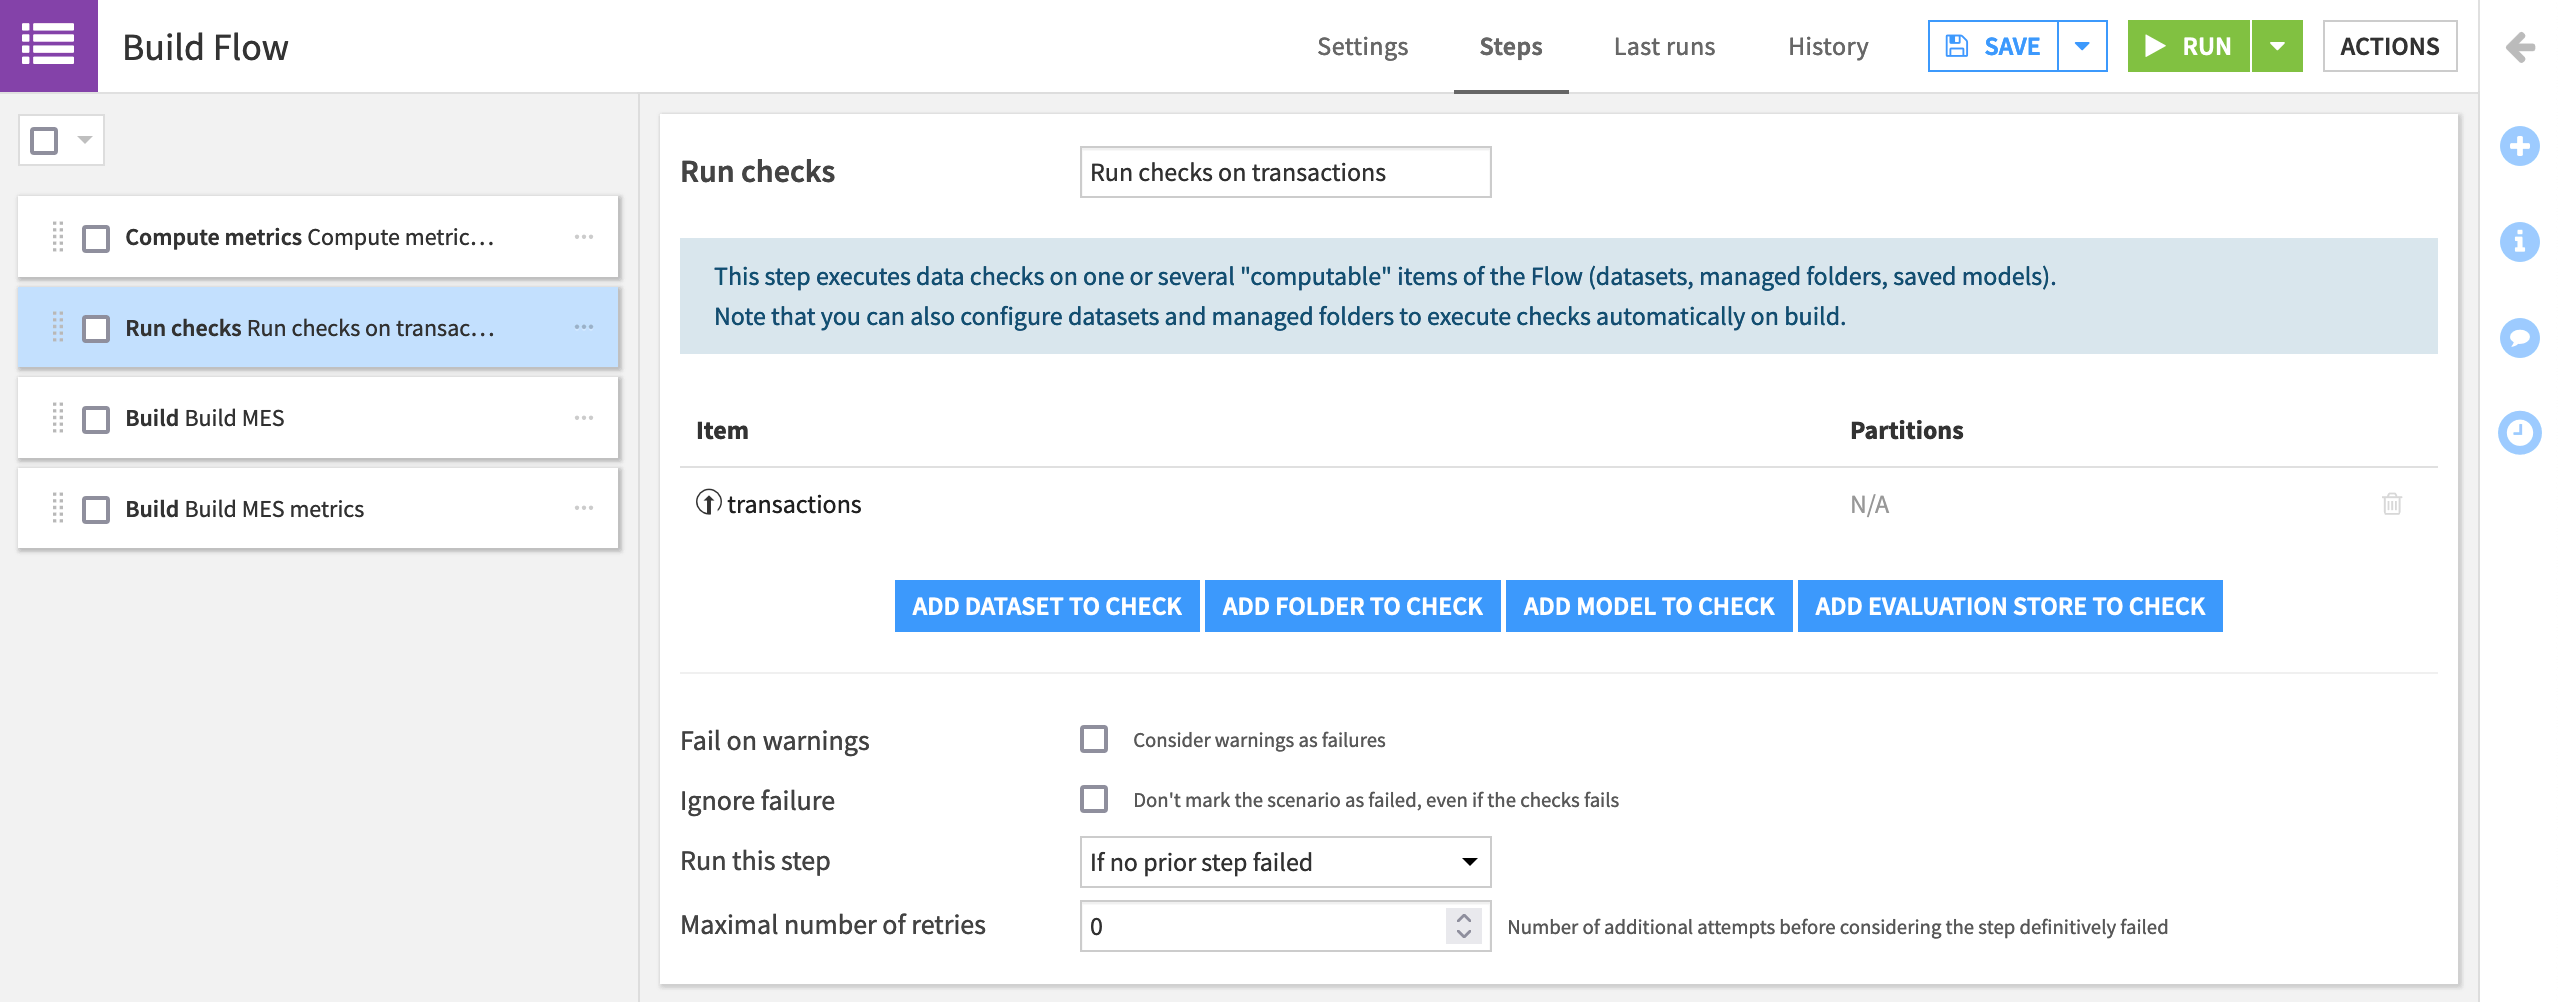
Once fresh metrics are computed, we want to run the checks on the same dataset.
Add a “Run checks” step that checks the transactions dataset.
Drag it to the second position, and name it
Run checks on transactions.
Add the Data Quality Steps
Assuming these checks pass, we’ll want to continue building the data pipeline up until the next checkpoint. Recall that we set transactions_joined_prepared to auto-compute metrics after build, and so we don’t need an explicit compute metrics step.
Add a “Build/Train” step that computes the transactions_joined_prepared dataset.
Drag it to the third position, and name it
Force build transactions_joined_prepared.For simplicity, change the “Build mode” to Force rebuild dataset and dependencies.
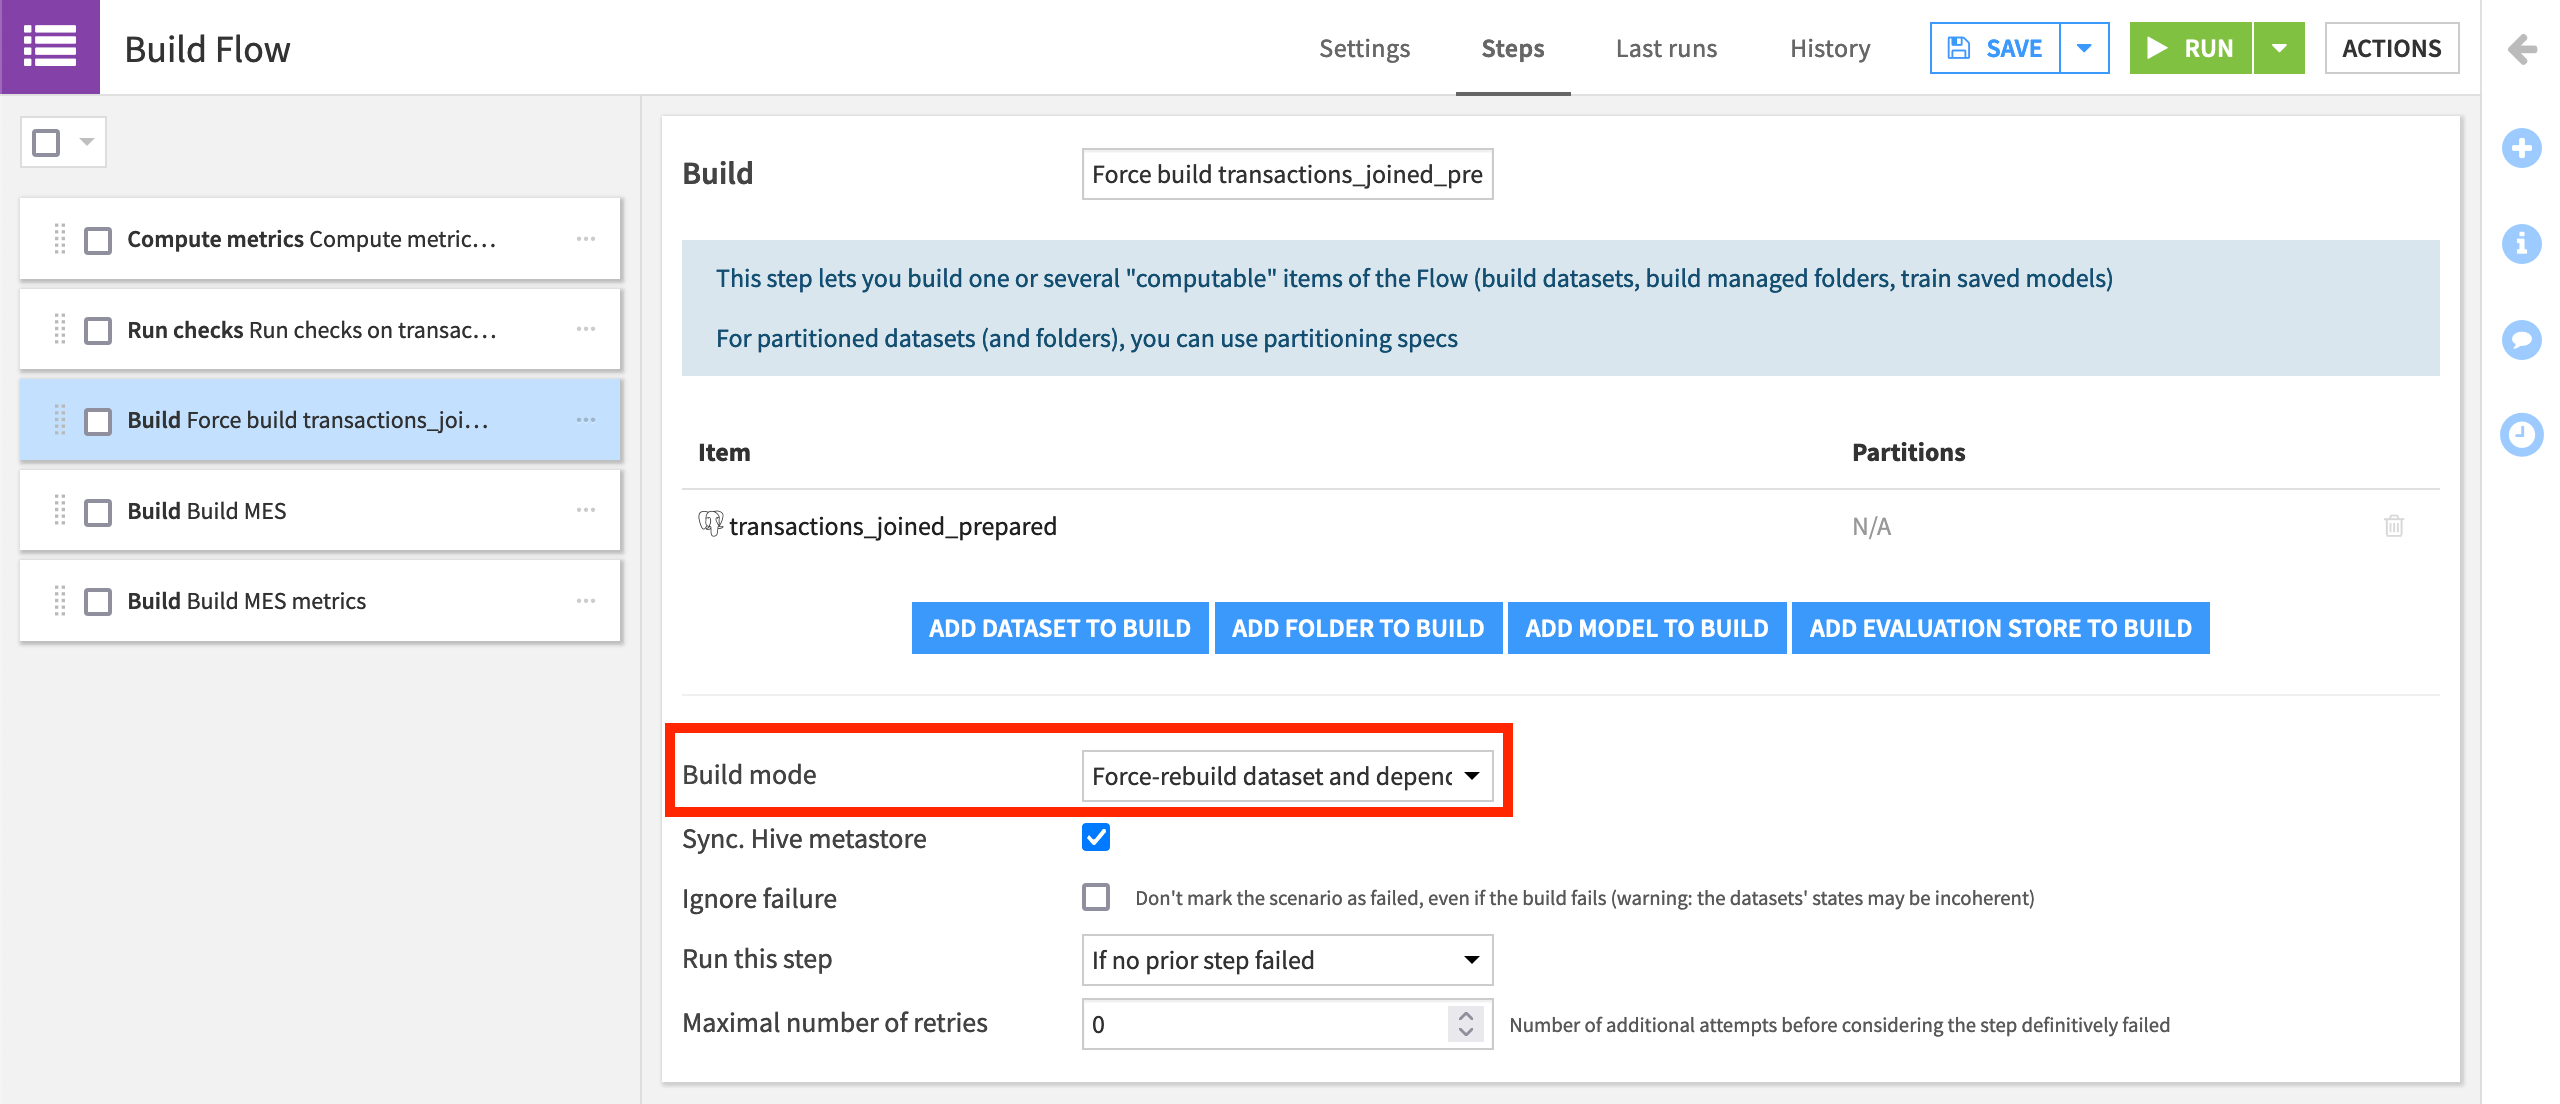
Note
Given that the input data does not change in this simplified tutorial, we need to force Dataiku to rebuild the Flow. In addition to the product documentation, you can learn more about build modes in the Knowledge Base.
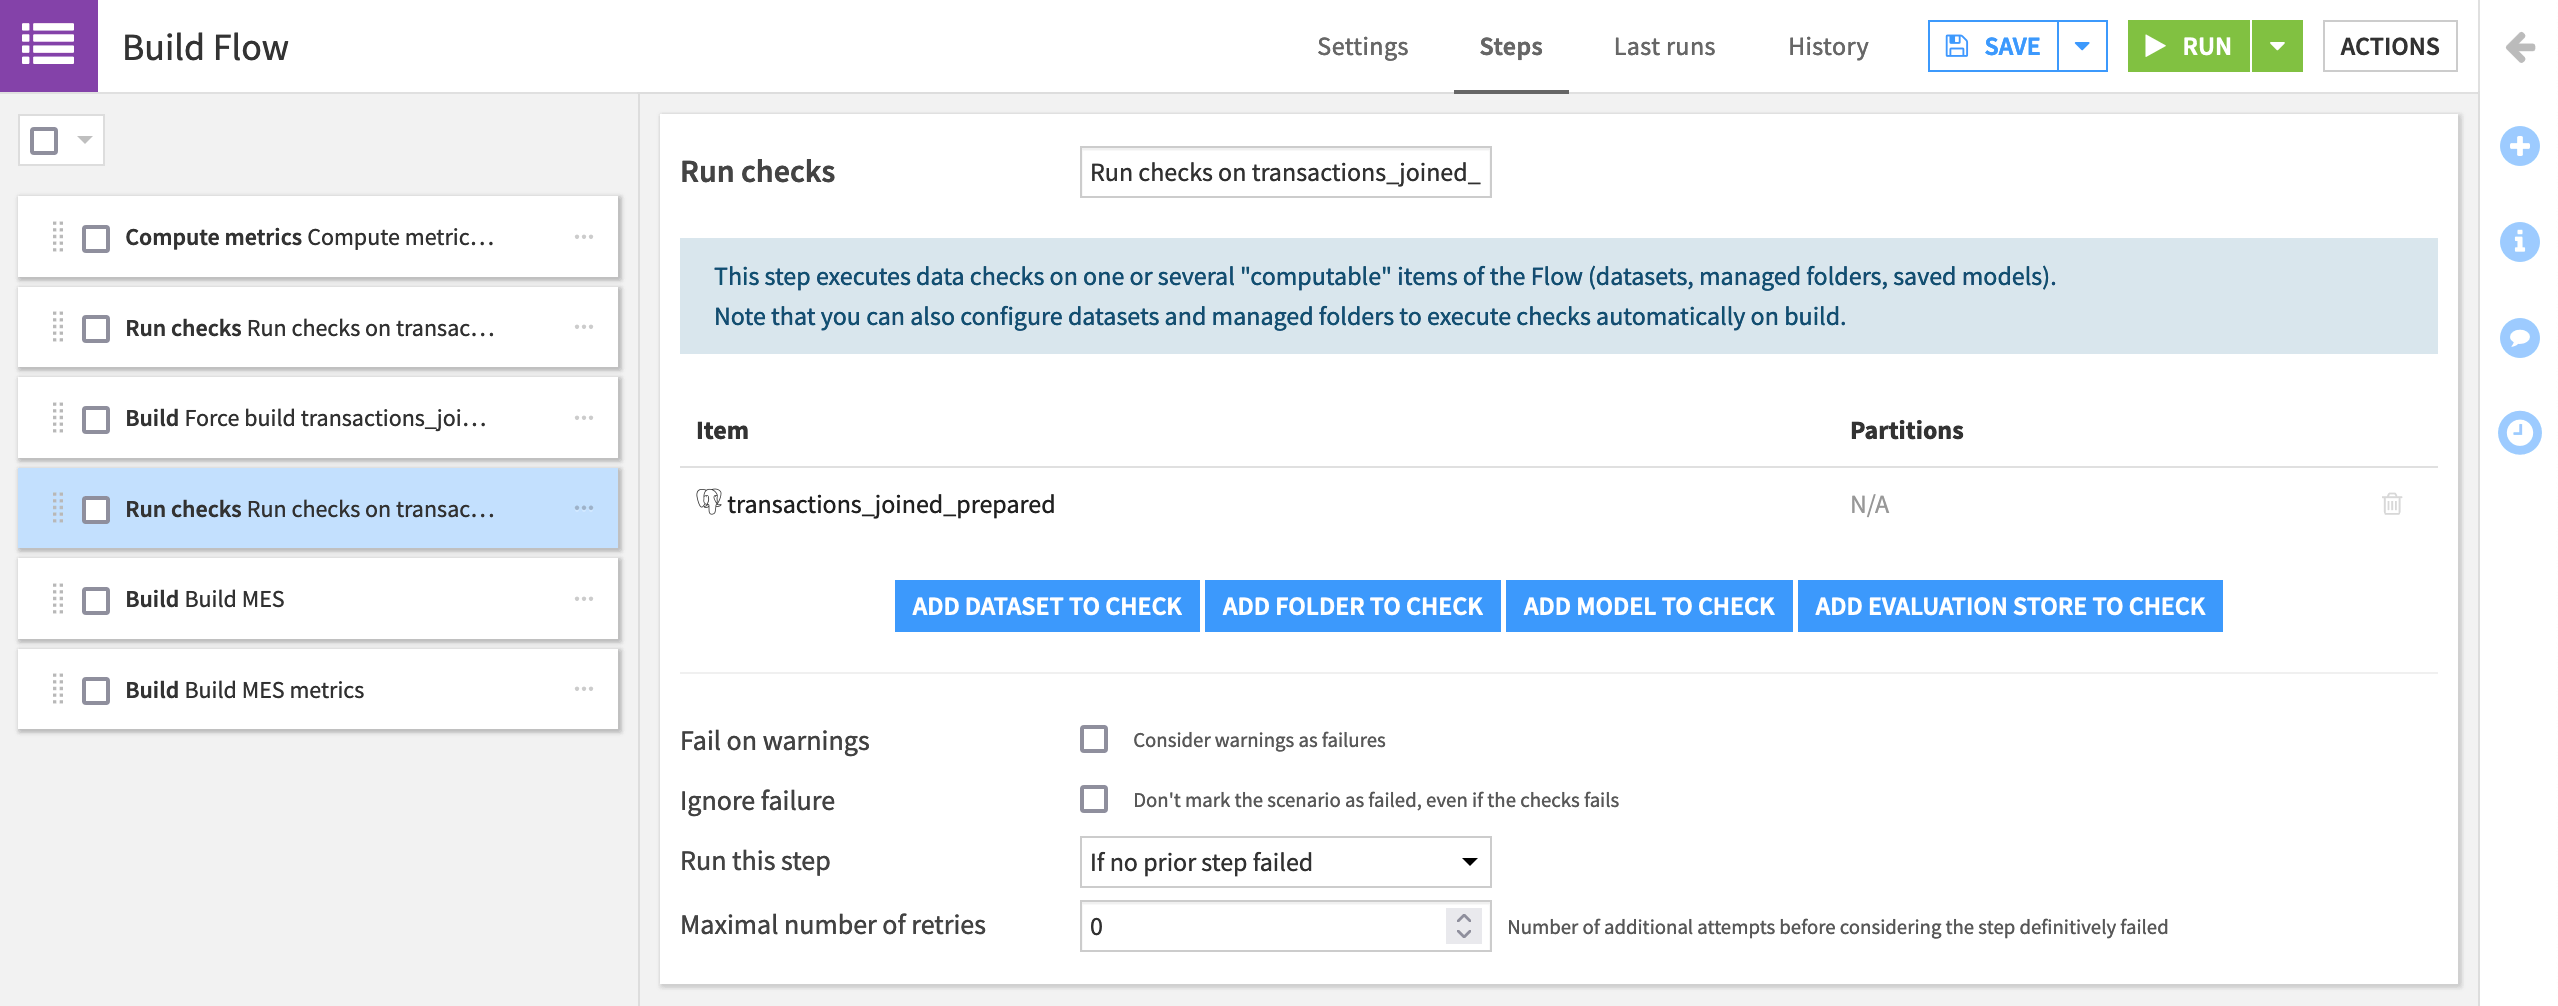
Now that we have computed the dataset (and auto-computed its metrics), we want to run the checks before moving forward in the pipeline.
Add a “Run checks” step that checks transactions_joined_prepared.
Drag it to the fourth position in the scenario, and name it
Run checks on transactions_joined_prepared.Click Save.
Now whenever our scenario runs, before building the model evaluation store and its metrics dataset, it runs checks for schema integrity and data quality. Depending on their settings, these checks can deliver warnings that allow the scenario to continue or entirely interrupt the pipeline’s progress.
For example, steps 5 and 6 in the scenario, that build the MES and MES metrics dataset, respectively, both have a “Run this step” setting of “If no prior step failed”. This means that these steps will only execute if the previous steps do not fail.
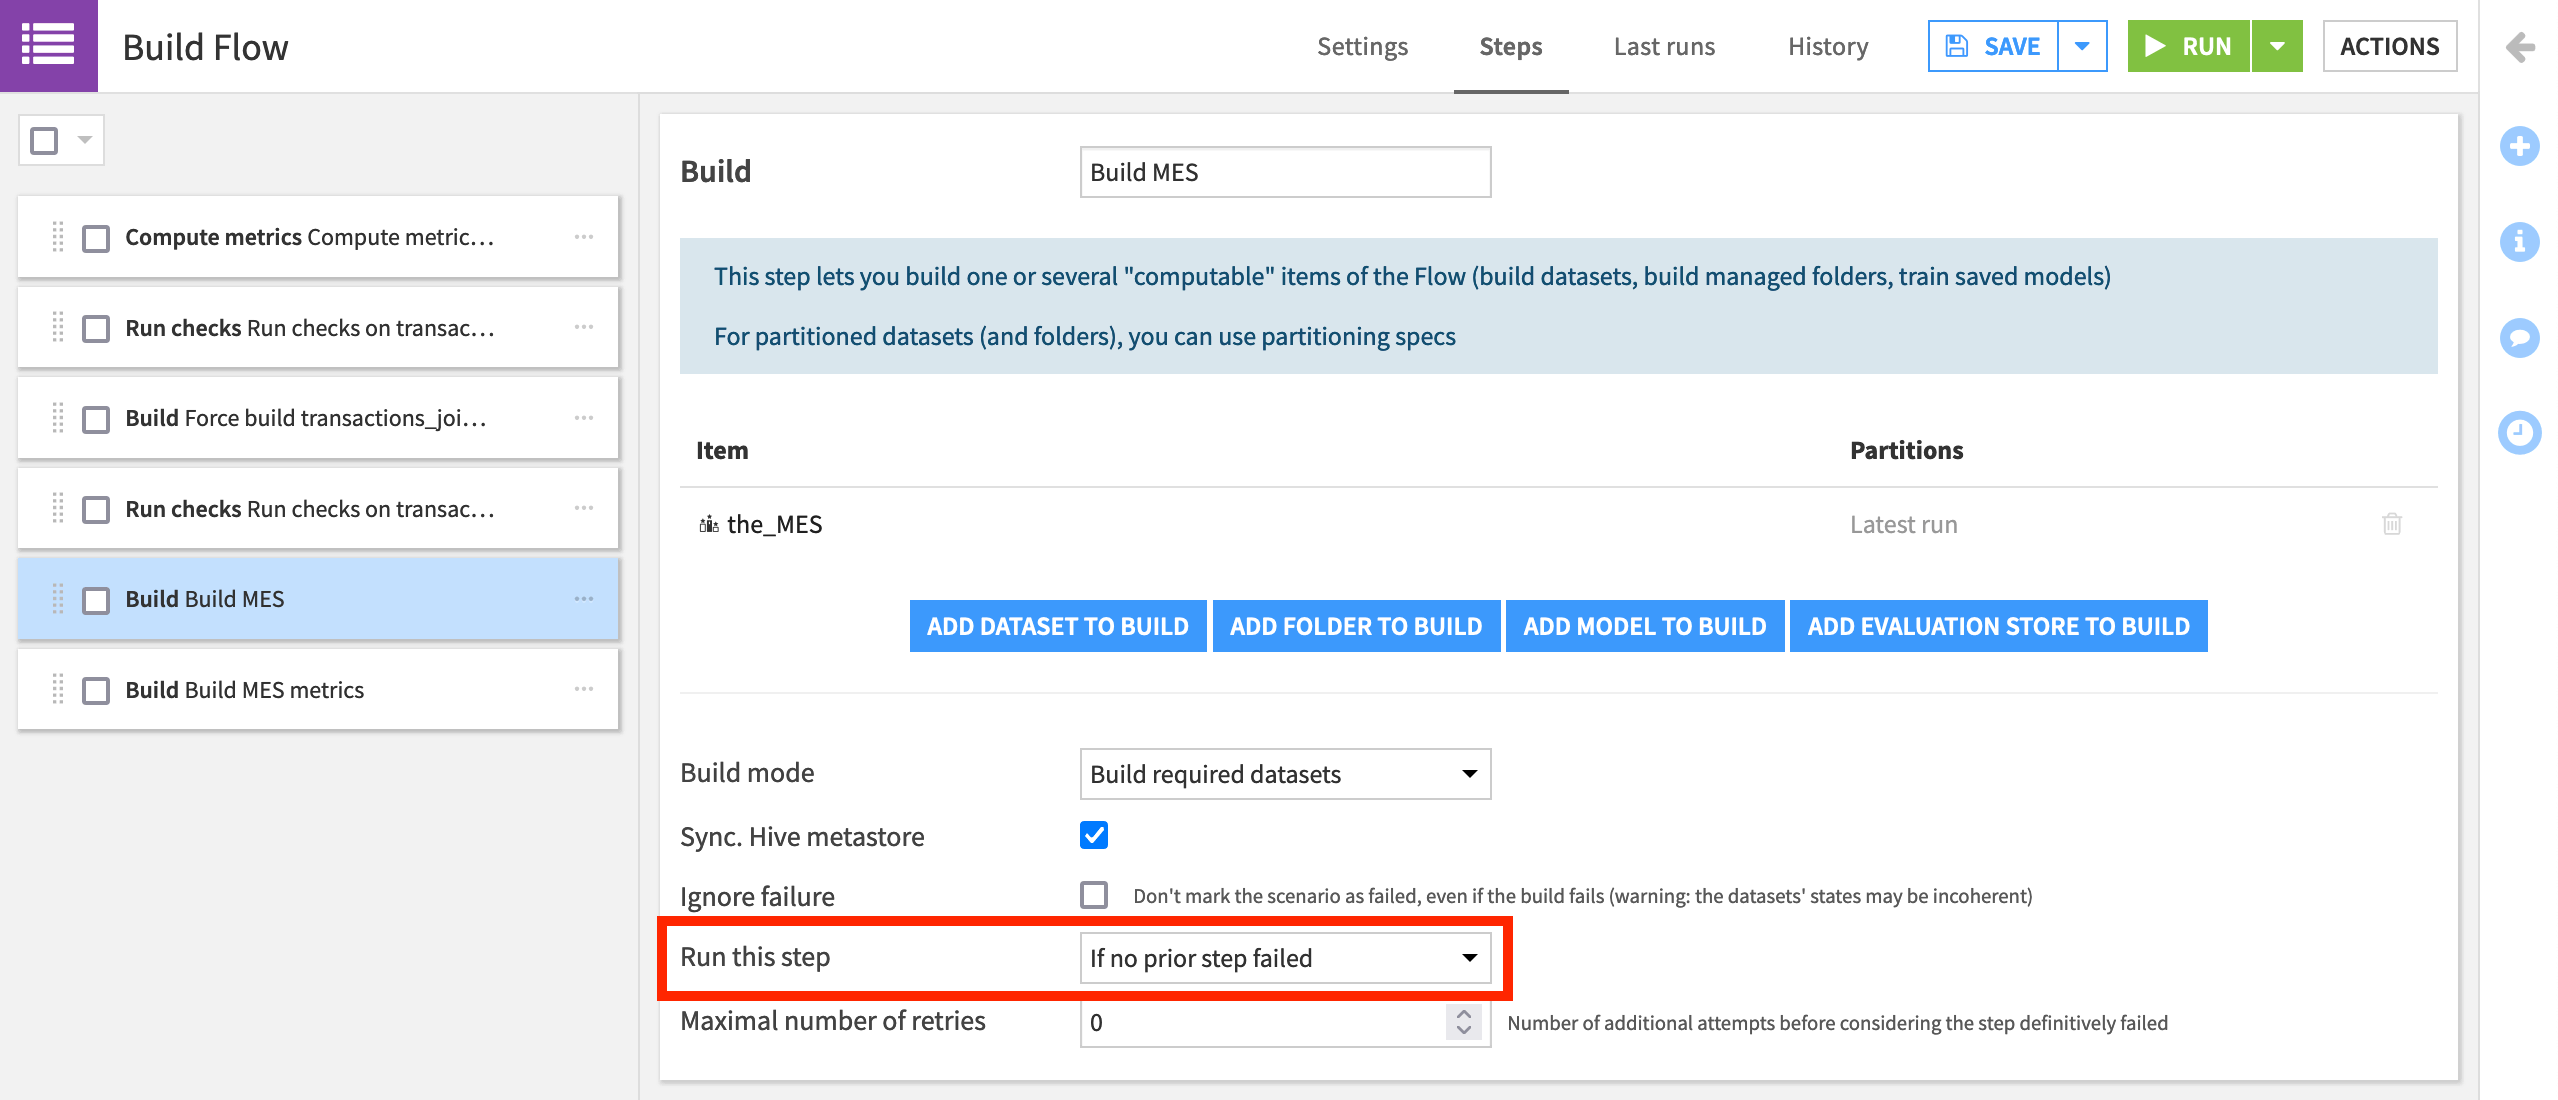
Note
Many more options for controlling the execution of scenario steps are covered in the product documentation.
Add a Trigger
Although for the purposes of these tutorials, we’ll always trigger this scenario manually, for the scenario to be able to run on its own, we’d normally want to define some kind of trigger.
Our use case has a time-based trigger, but many other types of triggers are detailed in the product documentation.
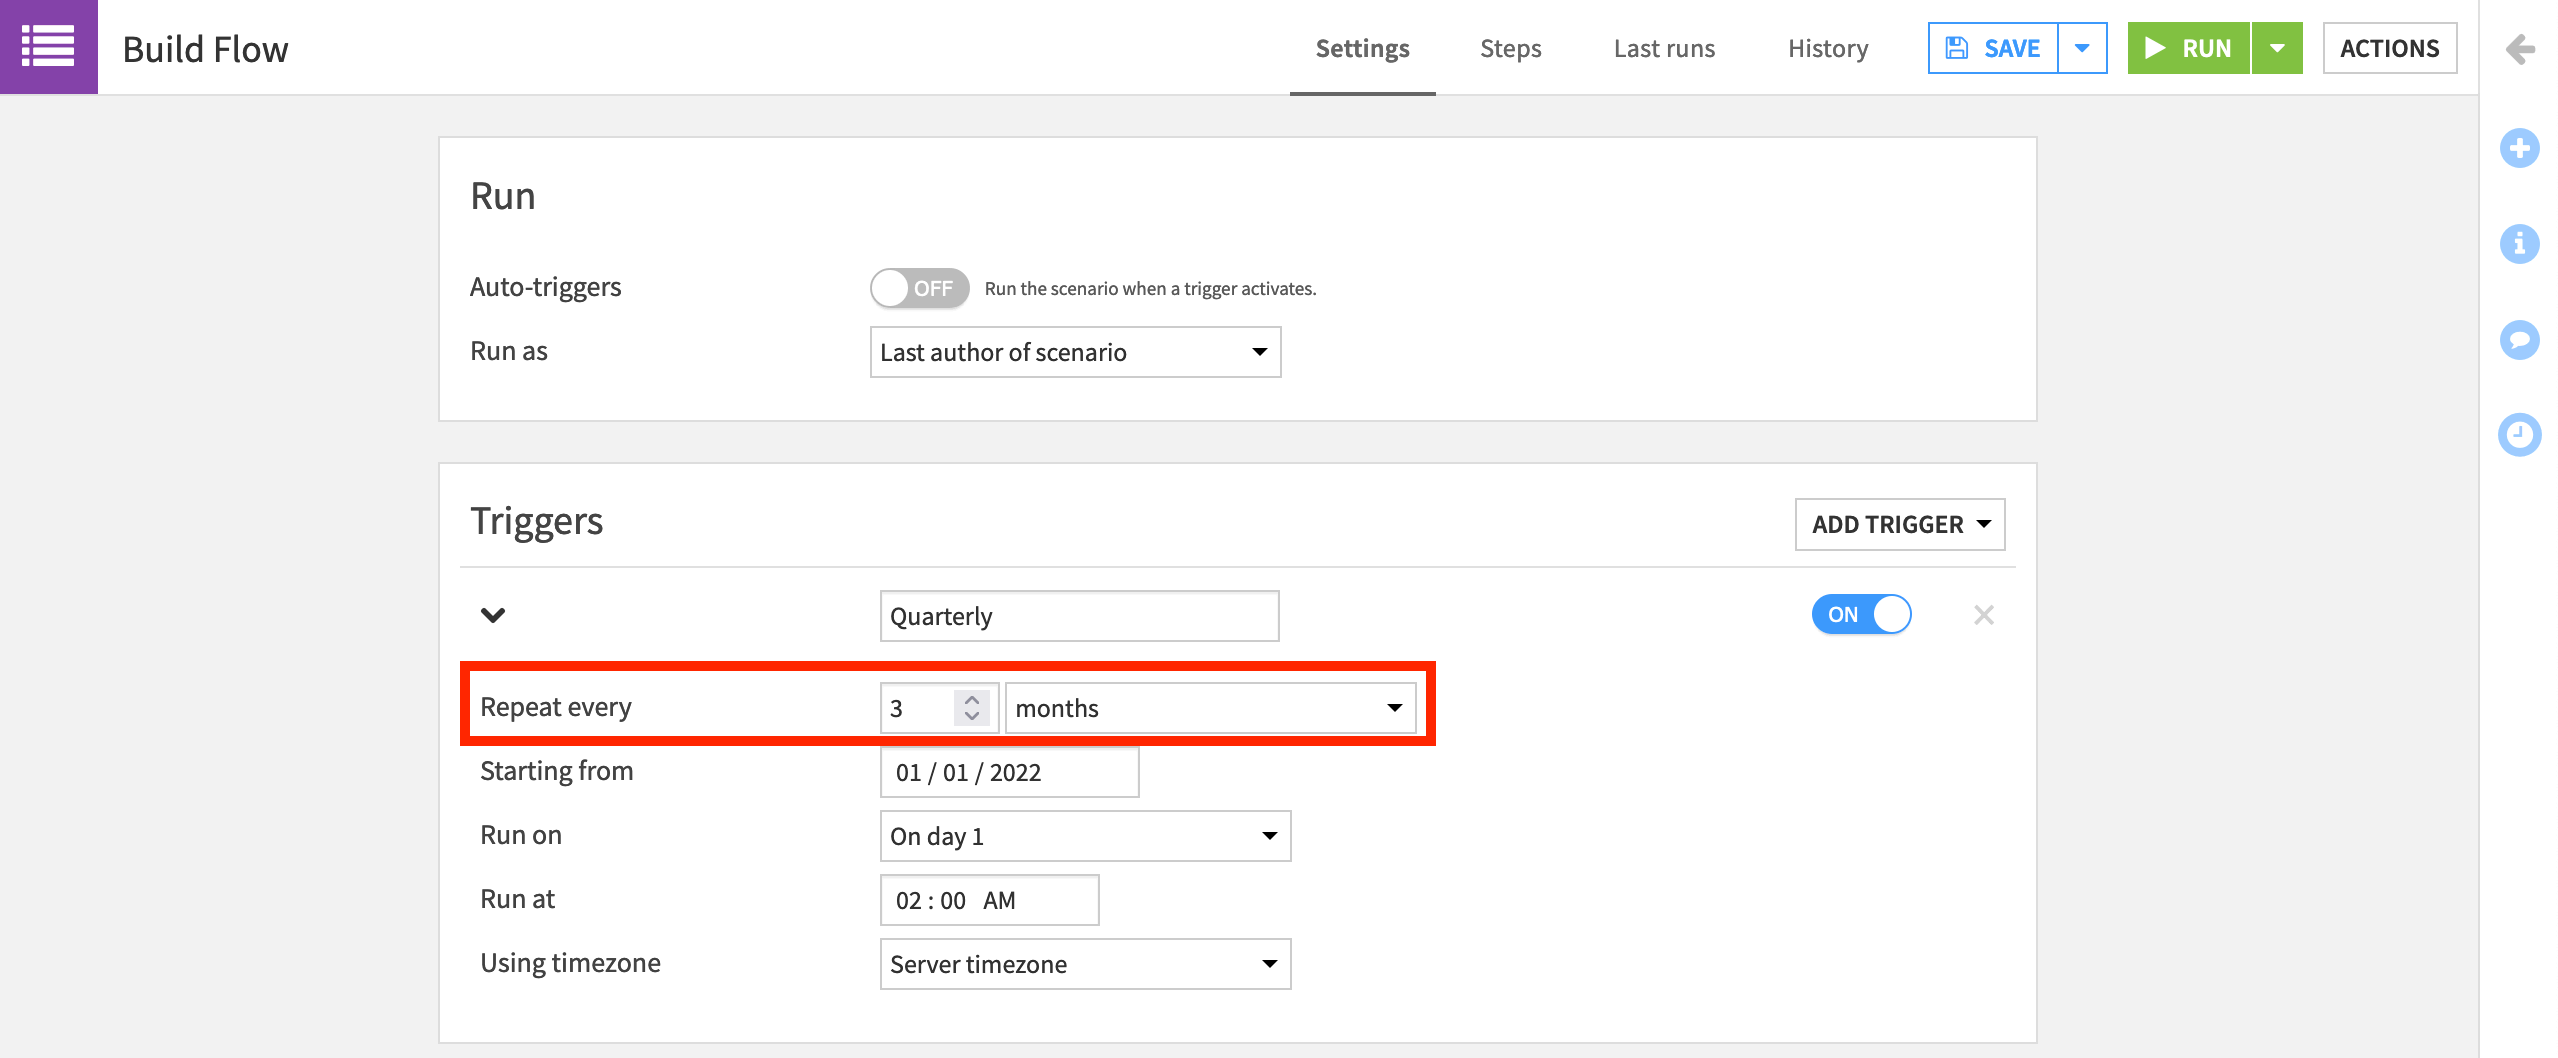
On the Settings tab, click Add Trigger > Time-based trigger.
Set it to repeat every 3 months at 2am, and name it
Quarterly.
Add a Reporter
Since this scenario will run on its own in a production environment, let’s attach a reporter to alert us of its progress.
Warning
If you don’t have a Mail reporter configured, you can skip this step or set one up now.
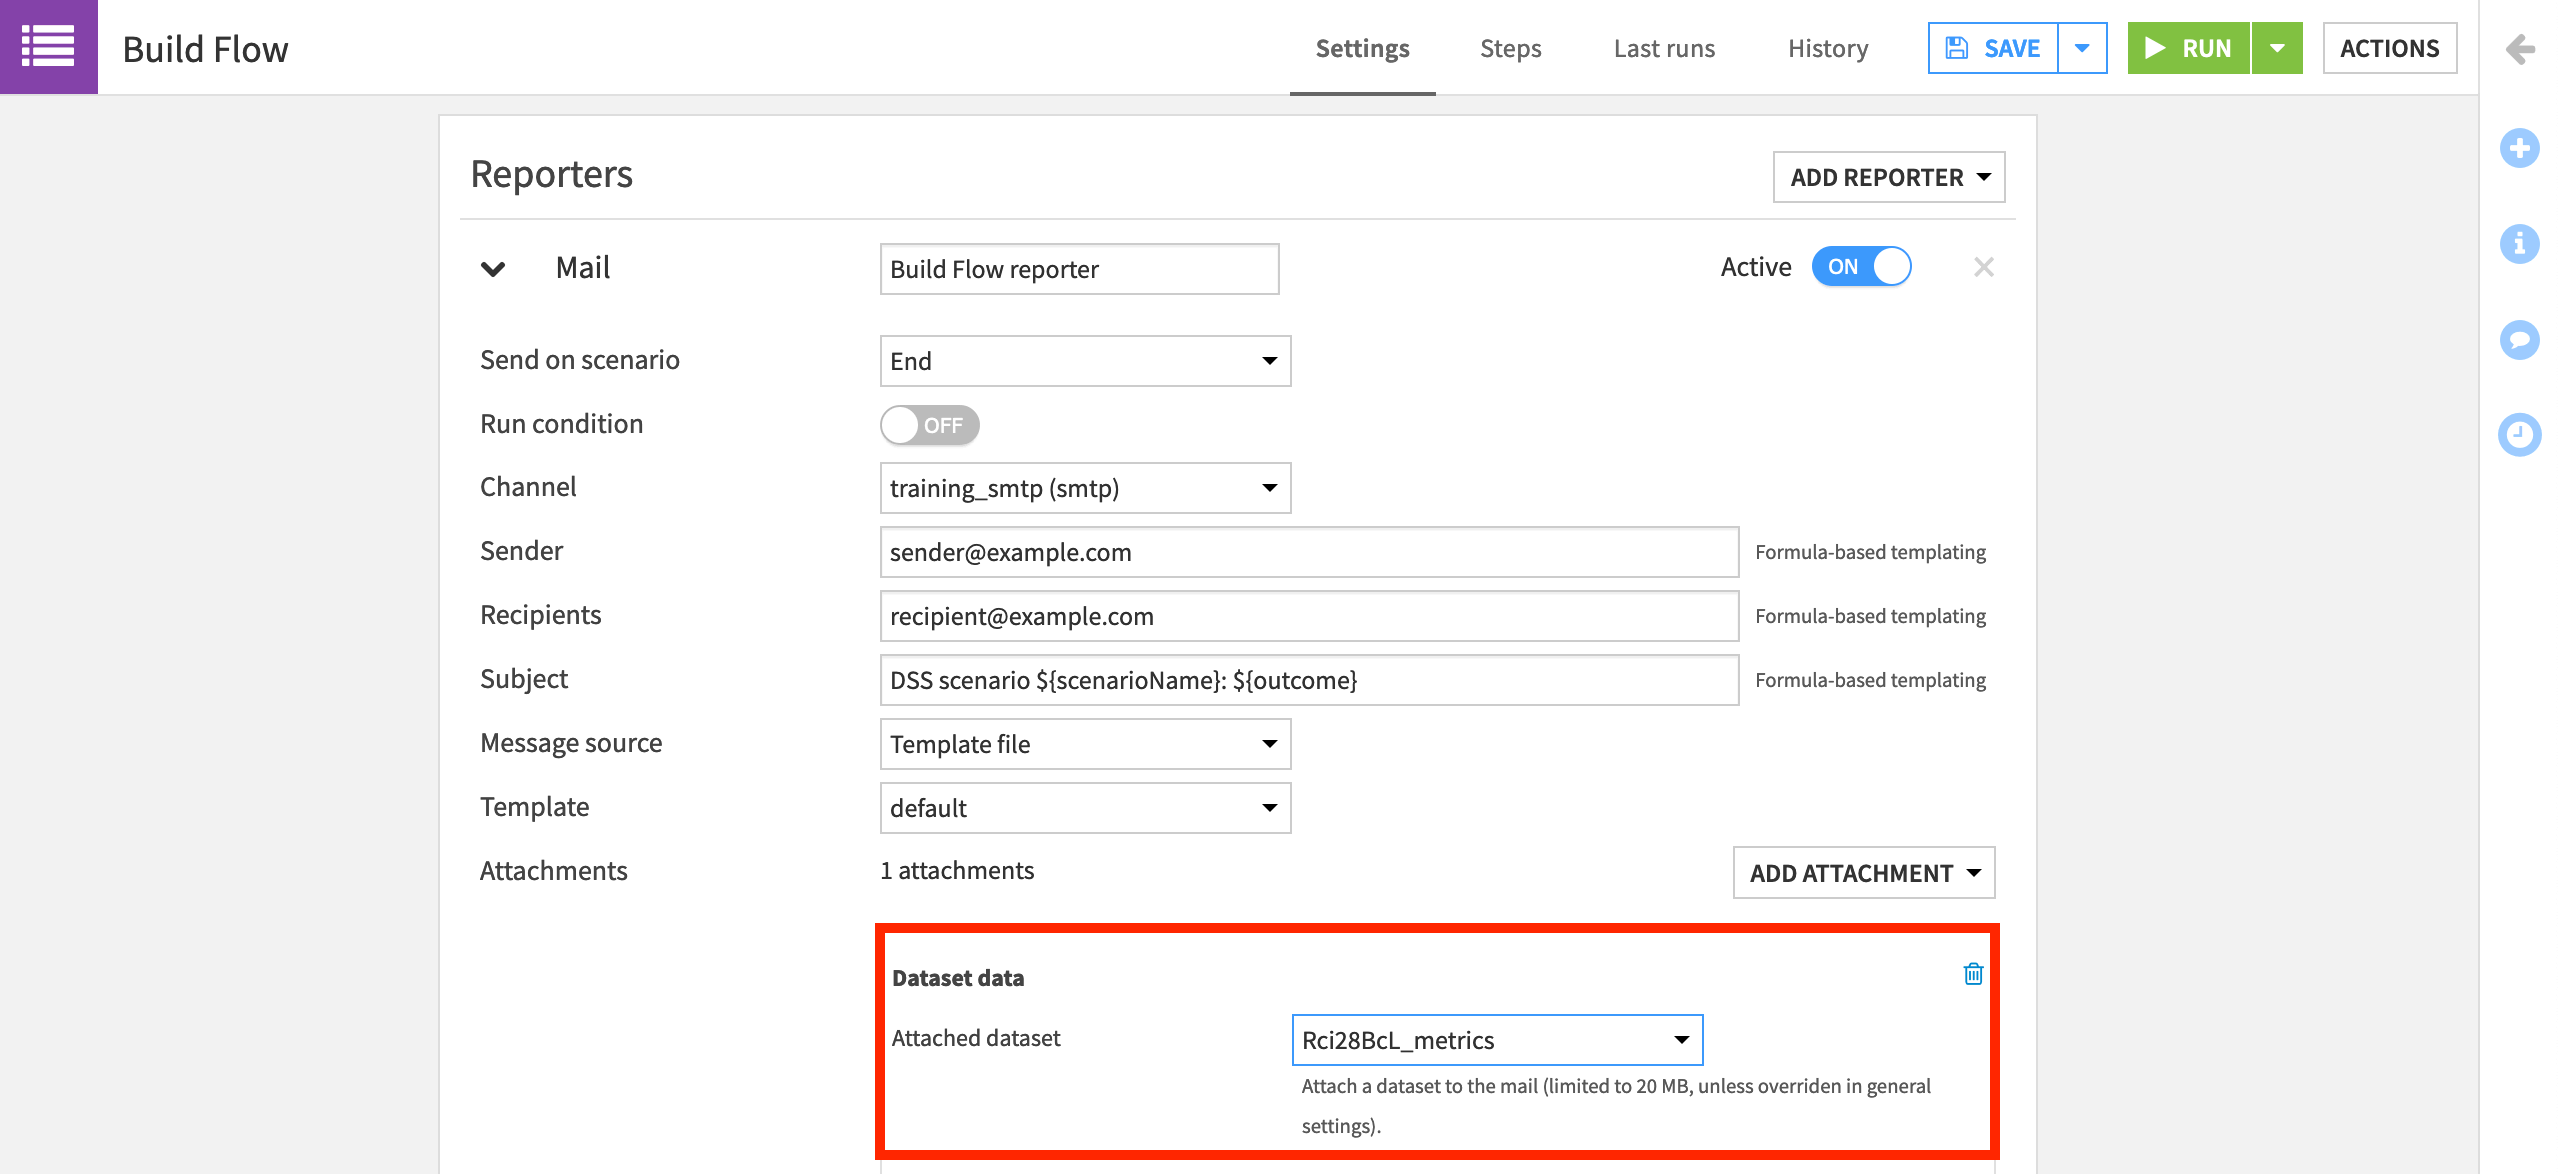
On the Settings tab, click Add Reporter > Mail.
Name it
Build Flow reporter.Turn the “Run condition” off so that we receive it regardless of whether the scenario run is successful.
Select the channel configured for your instance. In the example below, it is called “training_smtp”.
Add your own email address as the sender and recipient.
Click Add Attachment > Dataset data, and then the name of the MES metrics dataset.
Be sure to Save it.
Note
Although we used the default template here, reporter messages can be entirely customized. More detail on reporting on scenario runs and scenario variables can be found in the product documentation.
Run the New Scenario
Now with the added steps and reporter, let’s run the scenario once more, and then compare this run to the first run.
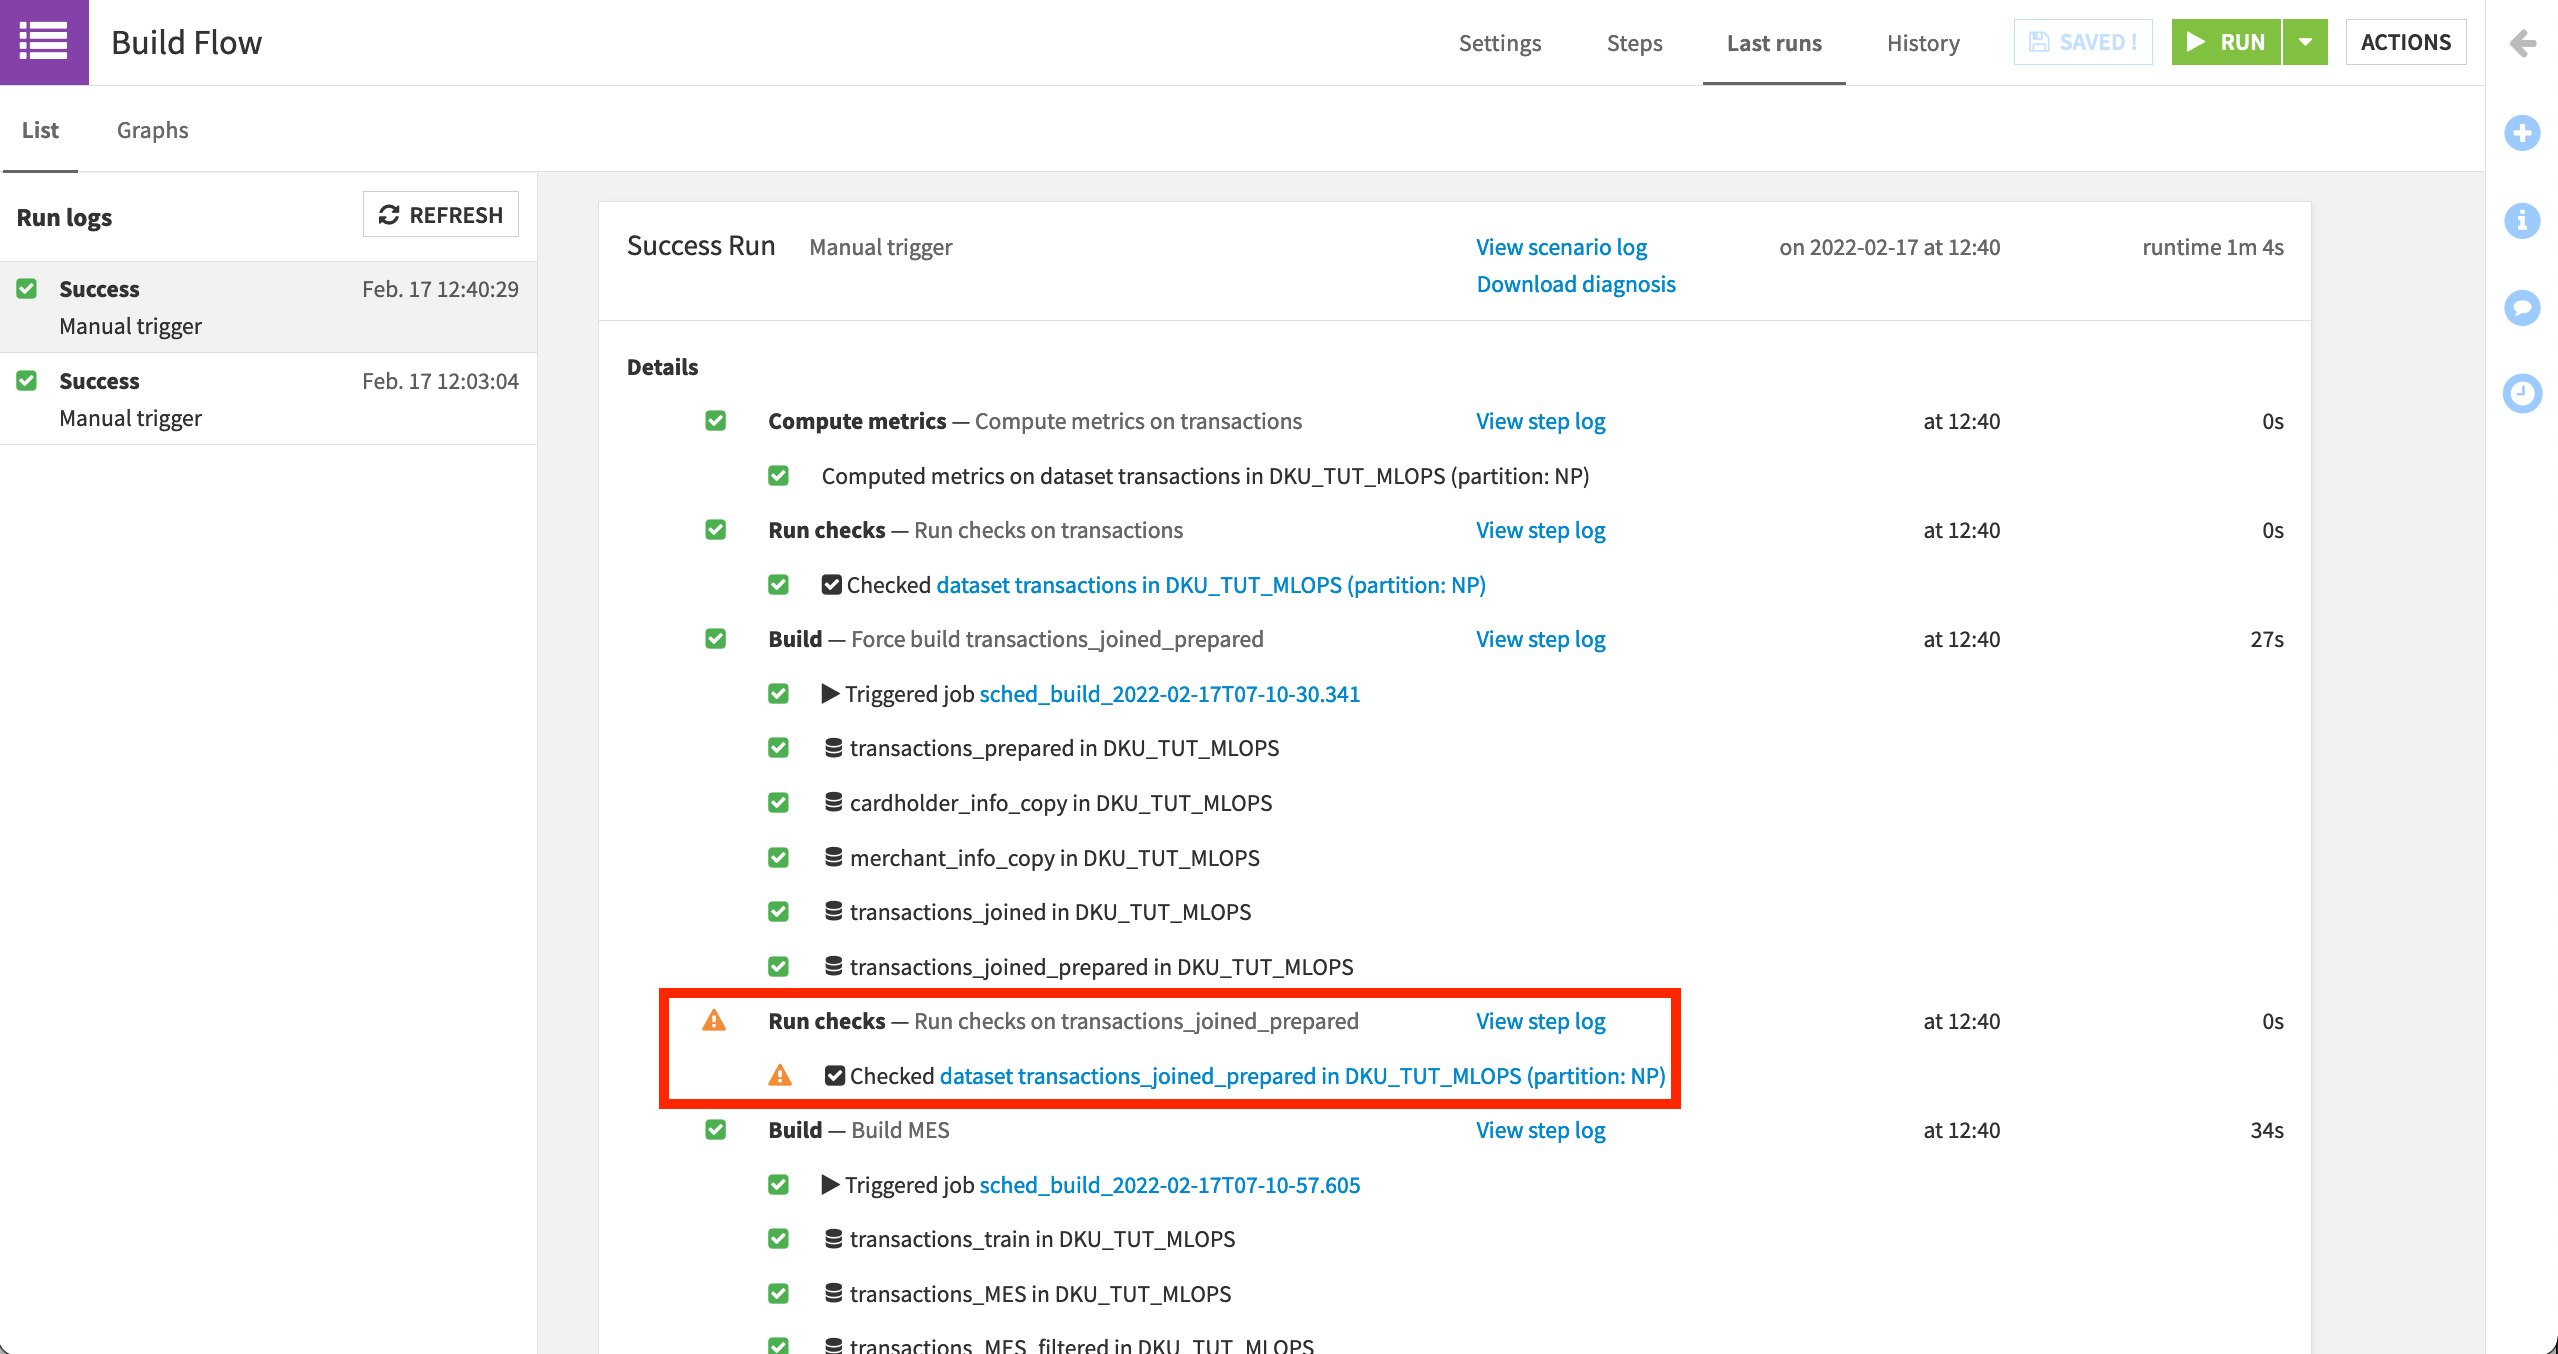
Click the green Run button, and watch its progression in the “Last Runs” tab.
Recall that we expect a warning for the maximum purchase check, and so should be able to see that warning in the log.
Note
On the Settings tab of the scenario, you’ll find a “Run as” setting listed as “Last author of scenario”. After deploying to an Automation node though, this setting will be changed to the individual user profile.
Deploying a recurrent scenario attached to a specific user can introduce challenges. For example, if that user leaves the company, their profile will be deleted, and scenarios attached to their profile will not function.
Although you can use the scenario API to reassign scenarios to another user, some organizations create a generic user specifically for running scenarios to avoid this situation. For this tutorial though, changing this setting is not required.
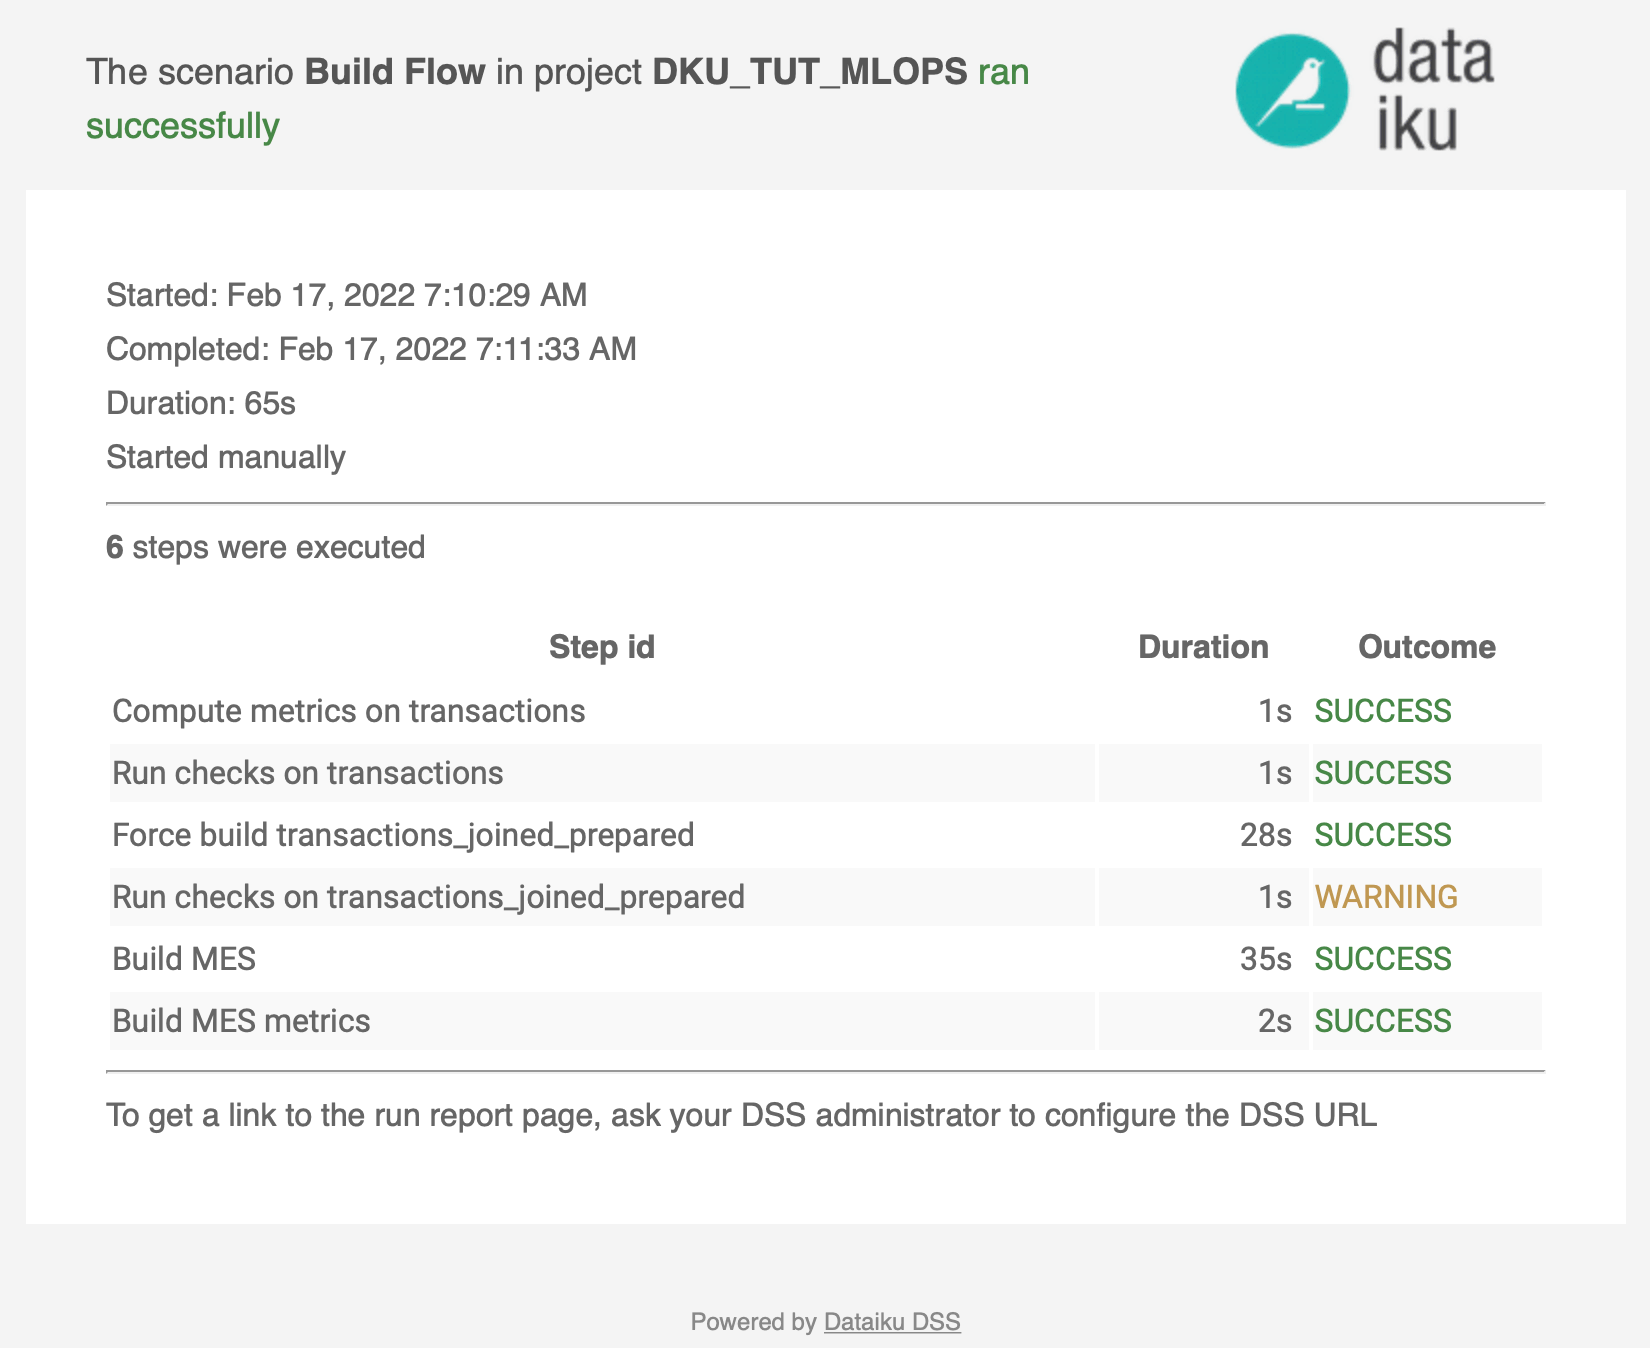
Check your email for the reporter, including the attached metrics dataset.
Tip
You may find it helpful to adjust many of the settings used here to trigger additional warnings and/or failures. For continuity with later tutorials though, adjust the settings back to those here before moving on.
What’s Next?
Congratulations! You have taken a very simple scenario and made it more robust by including steps to compute sensible schema and data quality checks, as well as a reporter to inform you about scenario runs.
Assuming this project is indeed ready for production, the next step is to batch deploy it! After learning about the batch deployment process in Dataiku, try batch deploying this same project in the hands-on tutorial.