Process Mining
Overview
Business Case
Process optimization as a means of reducing costs and improving efficiency is a perennial priority for companies. During economic periods in which cost pressures are especially pressing, a focus on process optimization becomes all the more so critical to ensure continuing business success and resilience. The ever-increasing use of technology systems to manage key processes provides previously inaccessible opportunities for process analysis and optimization. These systems generate timestamped workflow logs as a byproduct of their primary task (e.g., case management, process execution). This in turn enables a shift from time-consuming and potentially erratic process evaluation techniques (e.g., spot checks, time-in-motion studies) to modern, comprehensive, rapid, and statistically-driven analytics via process mining. This plug-and-play solution enables operations, strategy, and transformation teams to understand how Dataiku can be used to understand and explain patterns within a loan application workflow via automated and interactive process mining techniques.
Technical Requirements
To leverage this solution, you must meet the following requirements:
Have access to a Dataiku 9.0+ instance.
A Python 3.6 code environment named
solution_process-miningwith the following required packages:
pm4py==2.2.11.1
graphviz==0.17
dash==2.3.1
dash_table==5.0
dash_interactive_graphviz==0.3
dash_bootstrap_components==1.0
dash_daq==0.5
The open-source graph visualization software Graphviz must also be installed on the same system running Dataiku.
Installation
If the technical requirements are met, this solution can be installed in one of two ways:
On your Dataiku instance click + New Project > Industry solutions > Financial Services > Process Mining.
Download the .zip project file and upload it directly to your Dataiku instance as a new project.
Data Requirements
The Dataiku flow was initially built using real-world loan application event logs contained in an XES file. The data was sourced from the BPIC Challenge 2012 and represents a loan application process within a Dutch Financial Institution. This data will come pre-loaded into every instantiation of the Dataiku Application packaged in the solution but can be overwritten with your own event logs. The Solution accepts XES or CSV files for parsing. Logs that are taken as input for the process mining analysis must contain the following columns:
Case Id: the unique identifier of a trace
Activity: a step in the process. Depending on the use case, it can be interpreted as an action or a state, or a mix of both.
Timestamp: the timestamp for the activity. It could be the timestamp of an event or the start time/end time of an activity.
Optional columns can be added to enrich the analysis, including:
Resource: the person or cost center that executed the action. It could be defined at a case level or at an activity level
Numerical Attribute: any external numerical information about the case. Examples of numerical attributes are the claim amount for a claim process, a loan amount for a loan application process, or an invoice amount for an accounts payable process.
Categorical Attribute: any external categorical information about the case. Examples of categorical attributes are a type of claim for a claim process, a type of loan for a loan application process, or a type of supplier for an accounts payable process.
Workflow Overview
You can follow along with the solution in the Dataiku gallery.

The project has the following high-level steps:
Input audit logs and parse the data
Analyze data and precompute statistics
Interactively explore processes and create insights with a visual pre-built tool
Run Conformance checks and explore Individual Traces
Walkthrough
Note
Process Mining can be a complex topic to understand and use. This article serves as a very brief overview of the solution and is intentionally sparse in its technical details. In-depth technical details, summaries of the research that was involved in the building of this solution, a walk-through case study, and suggested next steps can be found in the wiki of the project. It is highly recommended you read the wiki before using this solution.
Input and Analyze our Audit Logs
We can either configure this solution via the accompanying Dataiku Application or by editing the flow directly. It’s recommended to use the Dataiku Application in order to support the upgrading of the Solution in the future. After creating a new instance of the Dataiku App, we begin by uploading our audit logs into the workflow_data managed folder from our local system. The file should be in XES or CSV format and contain the mandatory columns defined above. We will remap the columns soon so they do not need to be exactly named as described above. Once uploaded we click Parse in order to trigger a scenario that will build the workflow_parsed dataset. Once this scenario successfully completes we should press the refresh button to update the column names for identification.

Column identification allows us to Link the three mandatory columns to the appropriate columns in the input dataset. Then we select either to include all other columns as attributes, or select attribute columns manually. For improved user experience, try selecting only those columns you think will be of most value as large numbers of columns selected here will make the visual interface more cluttered. It is possible to select the columns used for case and activity as additional attributes, this will allow you to use them as Filters later. These Dataiku Application steps correspond to the recipes in the Workflow Cleaning flow zone.
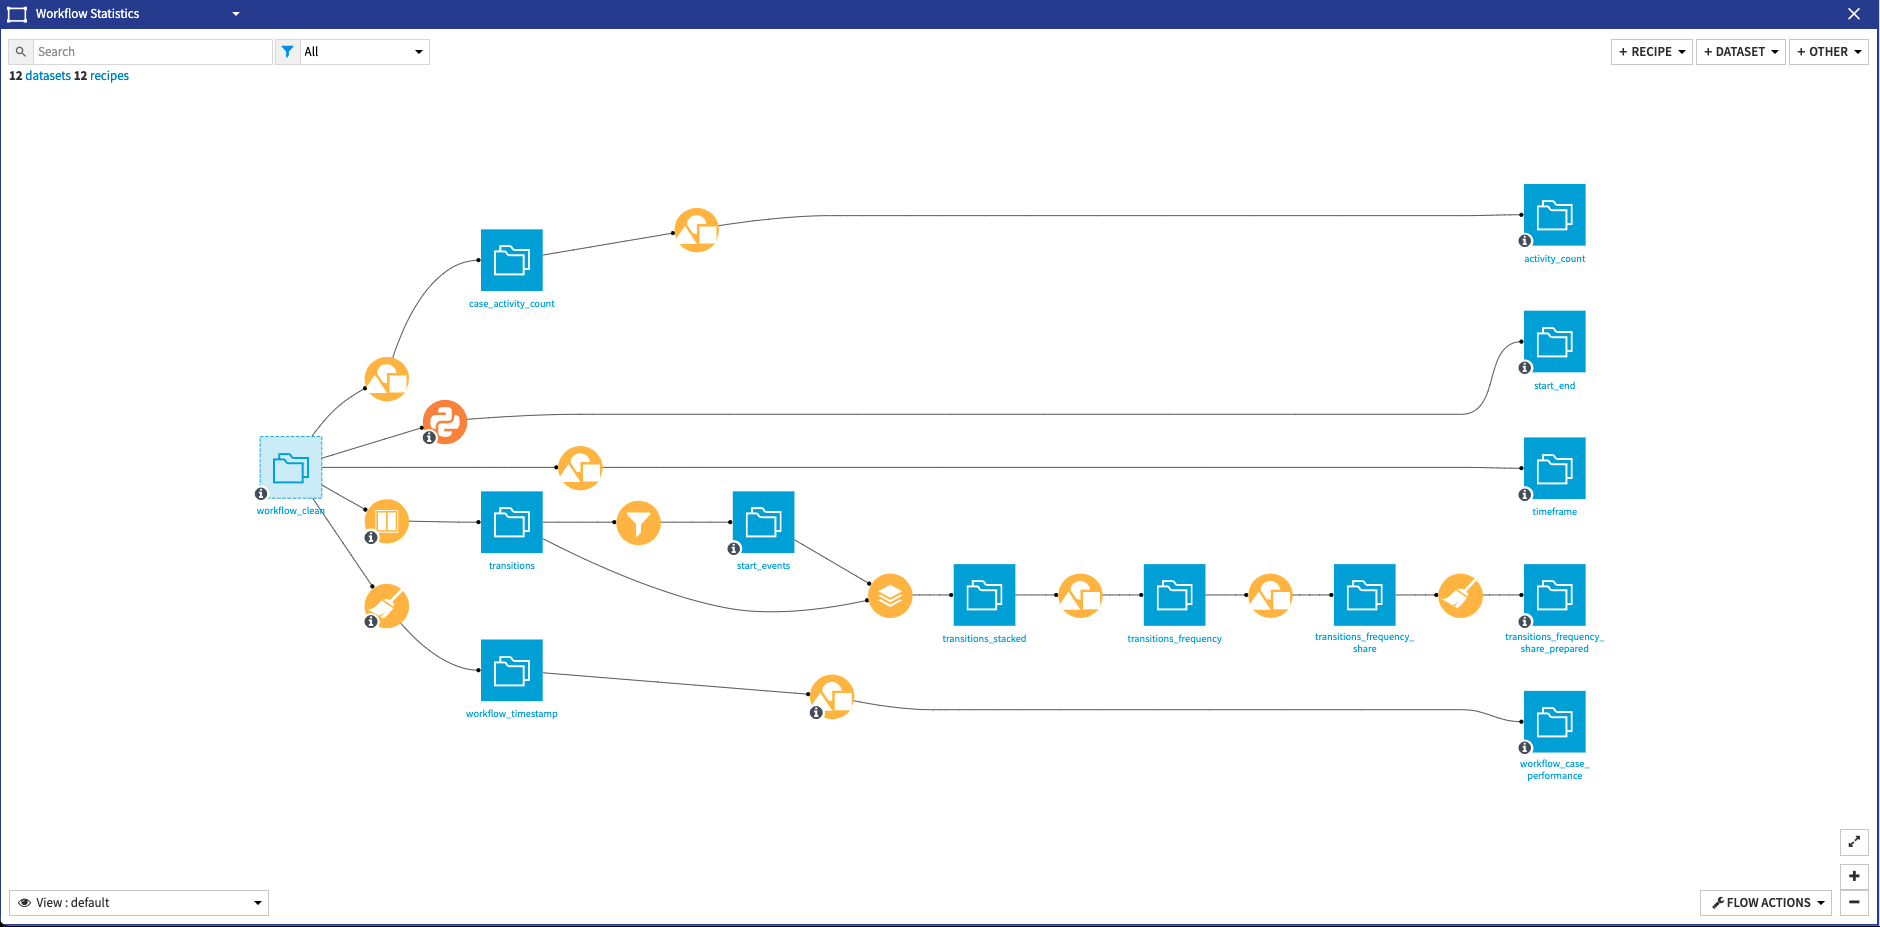
Finally, we can Build our Flow which will run the recipes contained in the Workflow Statistics flow zone in order to output the final datasets needed to start the Webapp. Within this flow zone, a few things happen. In the first branch, we compute the share of traces where each activity is present, group by activity and case to remove duplicates, and group again but just by activity this time in order to get the number of traces where an activity is present. The second branch uses a python recipe to mine the workflow and output the start and end activities in a process. A simple group recipe outputs the minimum and maximum dates to define the bounds of the webapp time selectors in the 3rd branch of the flow zone. The fourth branch is a bit more complicated than the rest but very simply it generates statistics (min, max, average, and count) about the transitions. Lastly, the fifth branch computes the performance per case to enable the usage of a performance filter in the webapp. Once the Flow is done building, we can directly access the Process Mining webapp by clicking the Open Webapp button. The webapp is also accessible via the Dashboard.
From Logs to Process Discovery: Using the Webapp
Process Mining often starts with very large log files that can seem at first glance inextricably jumbled and too complex to parse. The process of discovery is the complex task of making sense of the data. Achieving this is done using manual filters and selections to discriminate signal from noise, alongside algorithms that build a synthetic representation of a process. The Process Discovery tab is the entry point to the webapp. It consists of a visualization screen where the process is displayed and a menu where filters and selectors can be used to configure the visualization. More details on each selector and filter can be found in the Solution wiki. At a high level, the graph represents an aggregation of all the traces which match the set Filters. Each node represents an activity with its name written inside and a shape to represent its ‘type’:
Diamond nodes are Starting activities
House-shaped nodes are Ending activities
Rectangle nodes are all other activities
Activities are also color-coded according to their frequency in the process graph and a legend at the top of the graph will explain the color-coding. Nodes are linked together with directed arrows, with each arrow having a number associated with it that indicates the number of transitions from the source node to the target, or the average time spent on the transition. This number can be tottled between Frequency and Time in the top-right corner. Clicking on the nodes or edges will result in pop-up windows appearing which will contain details and statistics about the nodes/edges.
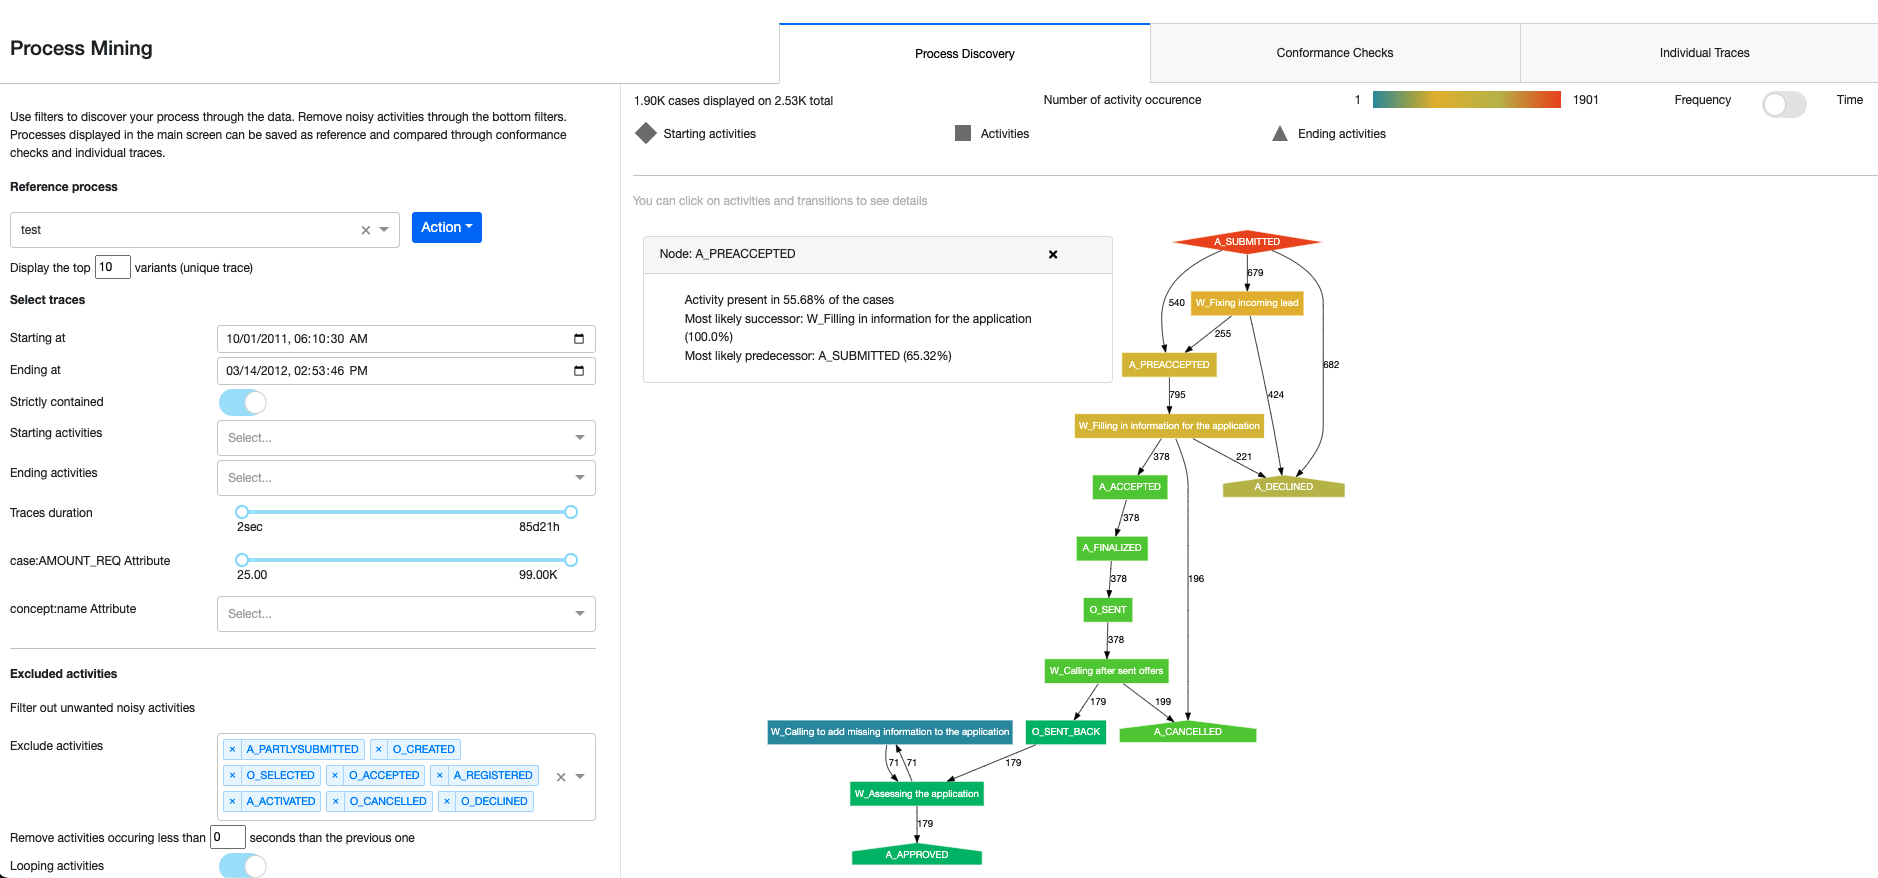
Within the menu of the webapp, we can do a few different things. The Process Selector allows you to define and adjust the reference process from a list of processes that have been previously saved (by clicking ‘Save current process’ in the dropdown). We can either apply the filters saved in a previously defined process or delete a previously saved one. In the menu, we also have access to a variety of Selectors that will always select full traces, never only parts of them. The webapp comes with default preset selectors for every analysis but optional selectors can be included by selecting additional columns from the workflow dataset through the Dataiku Application. We can also select the maximum number of variants that will visualize. Please note that plotting too many variants will fail as the graph will get too large. Lastly, we can Filter the traces by excluding specific activities, activities taking place before a set time, and/or looping activities. These filters are useful for cleaning the data of uninformative steps that might muddy a visual analysis without adding useful information.
Assessing Process Fit to Real-World Data: Conformance Checks
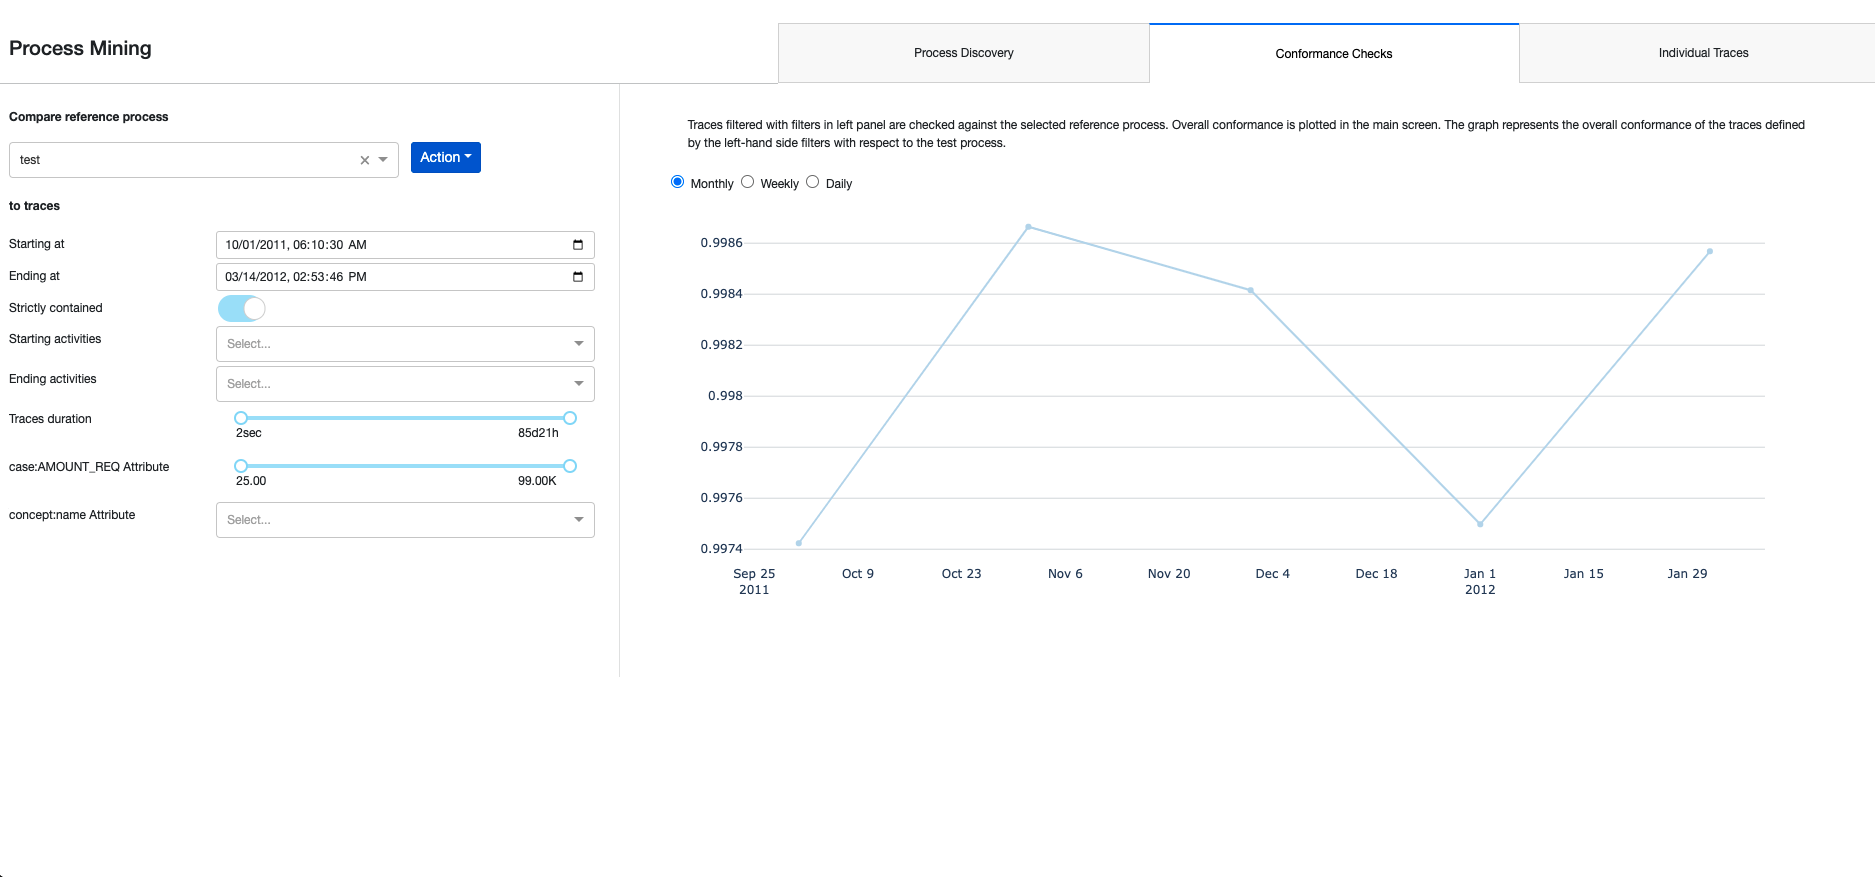
Conformance checking is the task of comparing a set of traces with a predefined process. It creates insights into how well real-world data conforms to a user-defined process and also monitors continuously how new traces fit the process. Conformance checking can take multiple forms, depending on the format of the saved process and business expectations. This solution uses the standard starting point for conformance checking, Token-Based Replay. Once at least one process has been saved in the Process Discovery tab we can switch to the Conformance Checks tab where we’ll be able to select the saved process from the drop-down menu on the left and click “Run Conformance Checks” from the Action menu. Doing so will run our saved process through the Conformance Checks Flow Zone which computes the conformance checks on the traces via a Python recipe. The output dataset of this Flow Zone also contains columns that are not displayed in the webapp but could be interesting to users. Back in the Webapp, once the Conformance Checks have been completed, an aggregated fitness result will be plotted on the right side. This shows the average fitness of the traces defined by the left-hand side selectors relative to the selected process (as described in the description above the graph). The user can adjust the time granularity of the graph (monthly, weekly, daily). In production, these checks could be run daily or in real-time to monitor the conformity of incoming data to a set process.
Exploring Individual Traces
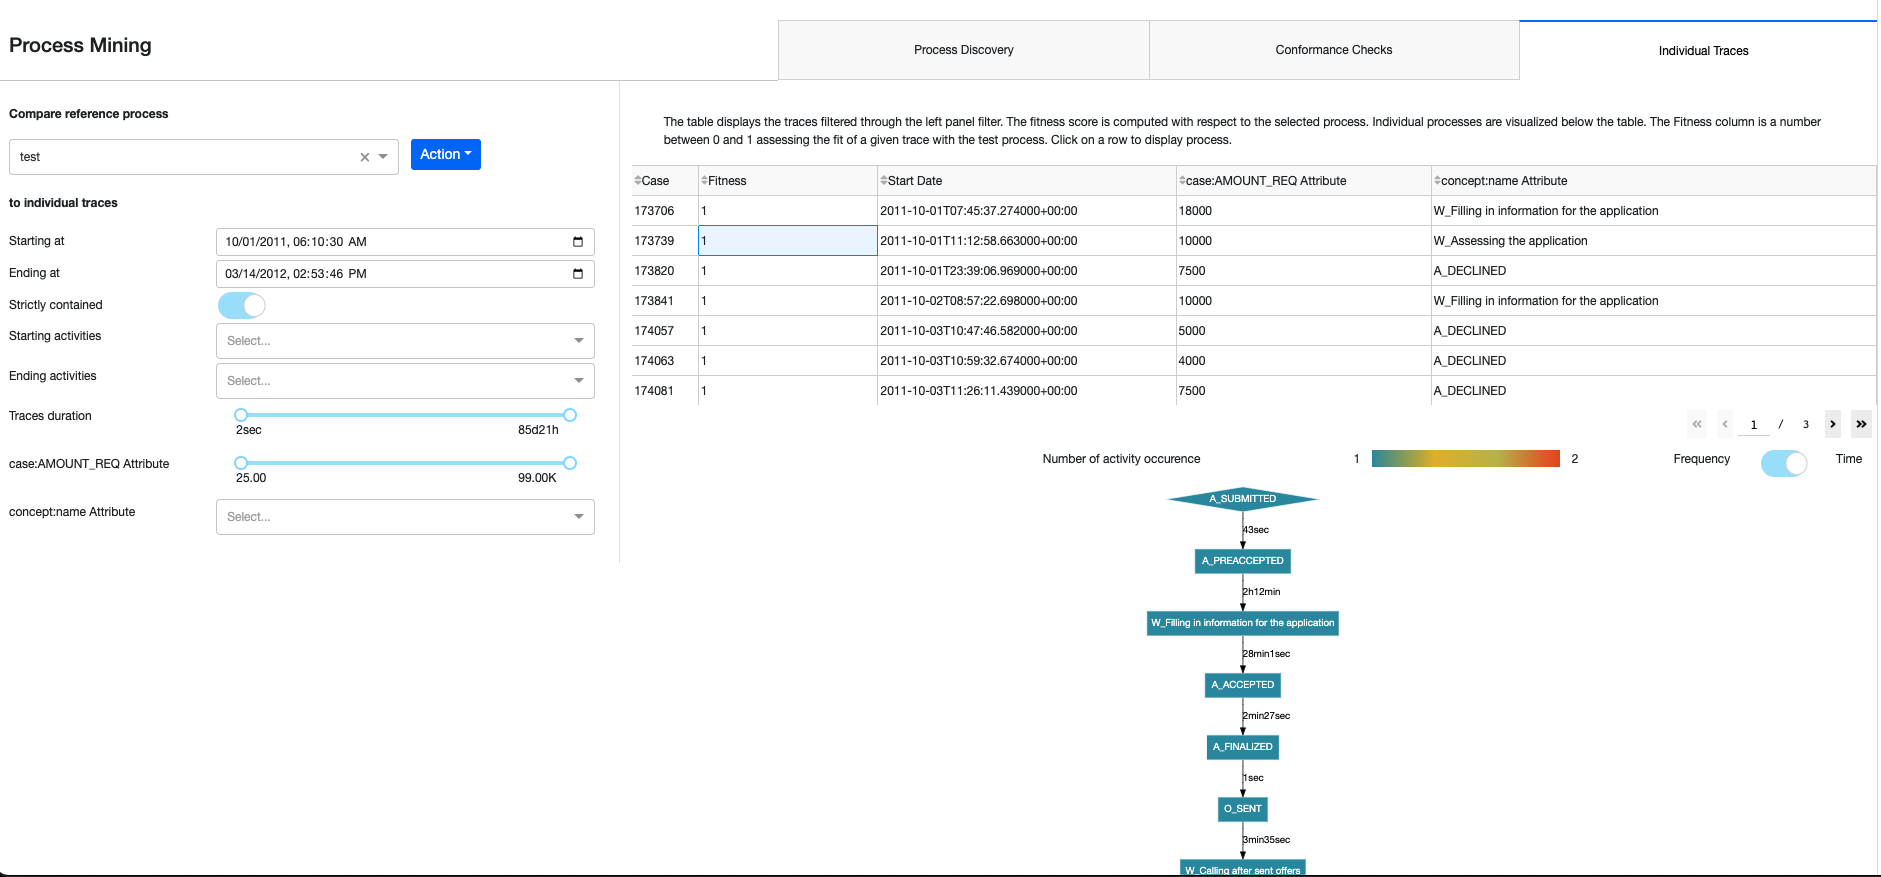
The final tab of the Webapp Individual Traces allows us to get a very detailed understanding of how each trace was executed. Conformance checks must be run before we can use this tab. Selectors on the left-hand side will determine which traces will be displayed. The resulting table will show each trace’s Case ID, Fitness Score from the Conformance Checks, Start Time, and aggregated attributes for all other optional columns. The table can be sorted on each column and when we click on a row from the table, a graph of the specific trace process will appear below with the same functionalities as the Process Discovery visualization.
Automation and Limitations
Four scenarios automate parts of the computation of the flow and are either triggered through the Dataiku Application or the Webapp. Reporters can be created to send messages to Teams, Slack, email, etc. to keep our full organization informed. These scenarios can also be run ad-hoc as needed. Full detail on the scenarios can be found in the wiki.
This project offers a powerful foundation from which to begin your efforts in Process Mining and with the pm4py library. The current implementation of the solution does not support very large datasets (over tens of thousands of traces), it might fail from out of memory error or the webapp will be very slow. It is preferable to start the analysis on a sample of data to have a smoother experience. Process Mining workstreams often integrate additional data science techniques, such as automated anomaly detection or cluster analysis, to enrich process investigations and uncover deeper insights. Dataiku’s platform is ideally positioned to allow your team to pursue these additional paths and integrate the results into this process mining solution.
Reproducing these Processes With Minimal Effort For Your Own Data
The intent of this project is to enable operations, strategy, and transformation teams to understand how Dataiku, can be used to create a visual map of your processes based on readily available process logs. By creating a singular solution that can benefit and influence the decisions of a variety of teams in a single organization, smarter and more holistic strategies can be designed in order to deep-dive into specific processes, analyze outliers, and apply powerful statistical techniques to enable remediation and optimization efforts.
We’ve provided several suggestions on how to use process logs to interactively create processes and industrialize using conformance checks but ultimately the “best” approach will depend on your specific needs and your data. Although we’ve focused on the Financial Services & Insurance industry, Process Mining can be used in a variety of use cases across industries. If you’re interested in adapting this project to the specific goals and needs of your organization, roll-out and customization services can be offered on demand.