Hands-On: Model the Relationship Between Two Variables
Note
This lesson is a continuation of the Interactive Visual Statistics hands-on tutorial.
Let’s now use the Fit Curve card to find the best line or curve that models the relationship between the free sulfur dioxide and total sulfur dioxide variables.
Click the New Card button from the “Worksheet” header, and then select Fit curves & distributions.
Select the Fit Curve card.
Specify free sulfur dioxide as the “X Variable” and total sulfur dioxide as the “Y Variable”.
Select the Polynomial “Curve Type” and specify
1as the polynomial “Degree”.Click Create Card to create the card.
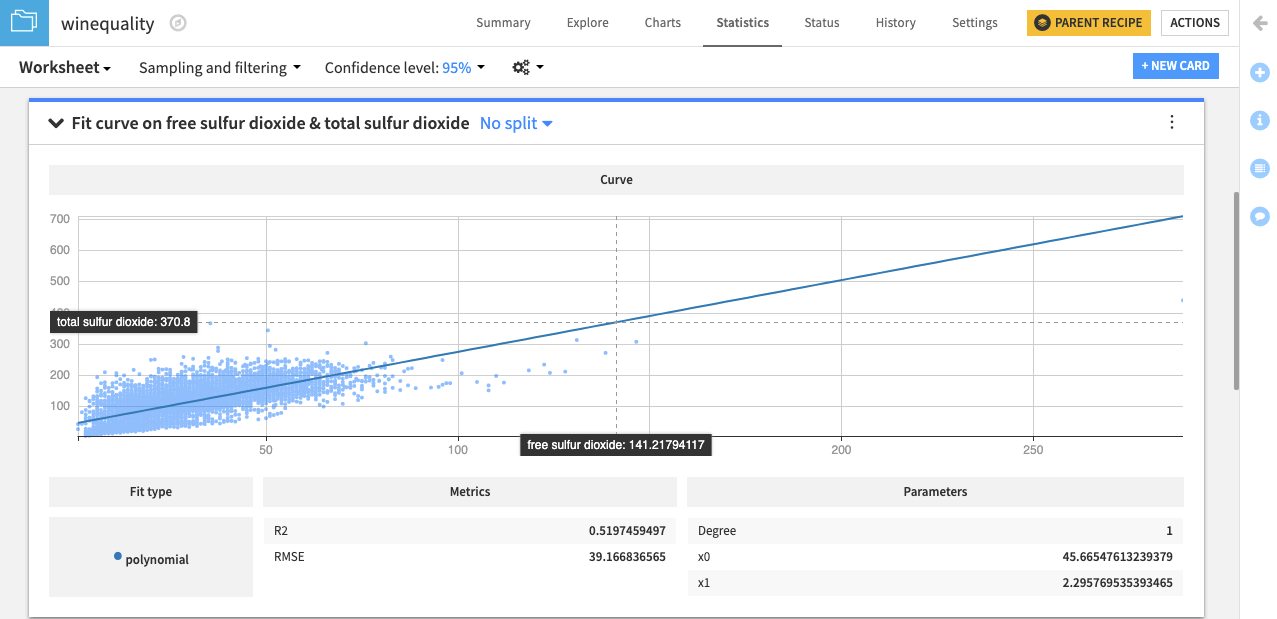
It appears that an increase in the value of the free sulfur dioxide variable results in an increase in the value of the total sulfur dioxide variable, and vice-versa. This indicates that both variables are positively correlated. We can confirm this by finding the correlation coefficient between these variables.
For more information, see Fit curves and distributions in the reference documentation.