Hands-On Tutorial: Forecasting Time Series (Plugin)
The ability to successfully predict future values of a column sometimes depends not only upon other features, but upon historical values of the column of interest, and the timing and order in which those historical values occur.
This is the case with time series data, and we need special techniques for forecasting quarterly sales and profits, weather forecasting, and trend detection.
Let’s Get Started!
In this tutorial, you will:
forecast time series using the Forecast plugin.
Prerequisites
You will need a Dataiku instance with the Time Series Preparation and Time Series Forecast plugins installed.
Create the Project
From the Dataiku homepage, click +New Project > DSS Tutorials > ML Practitioner > Time Series Forecasting (Tutorial).
Note
You can also download the starter project from this website and import it as a zip file.
Go to the project’s Flow.
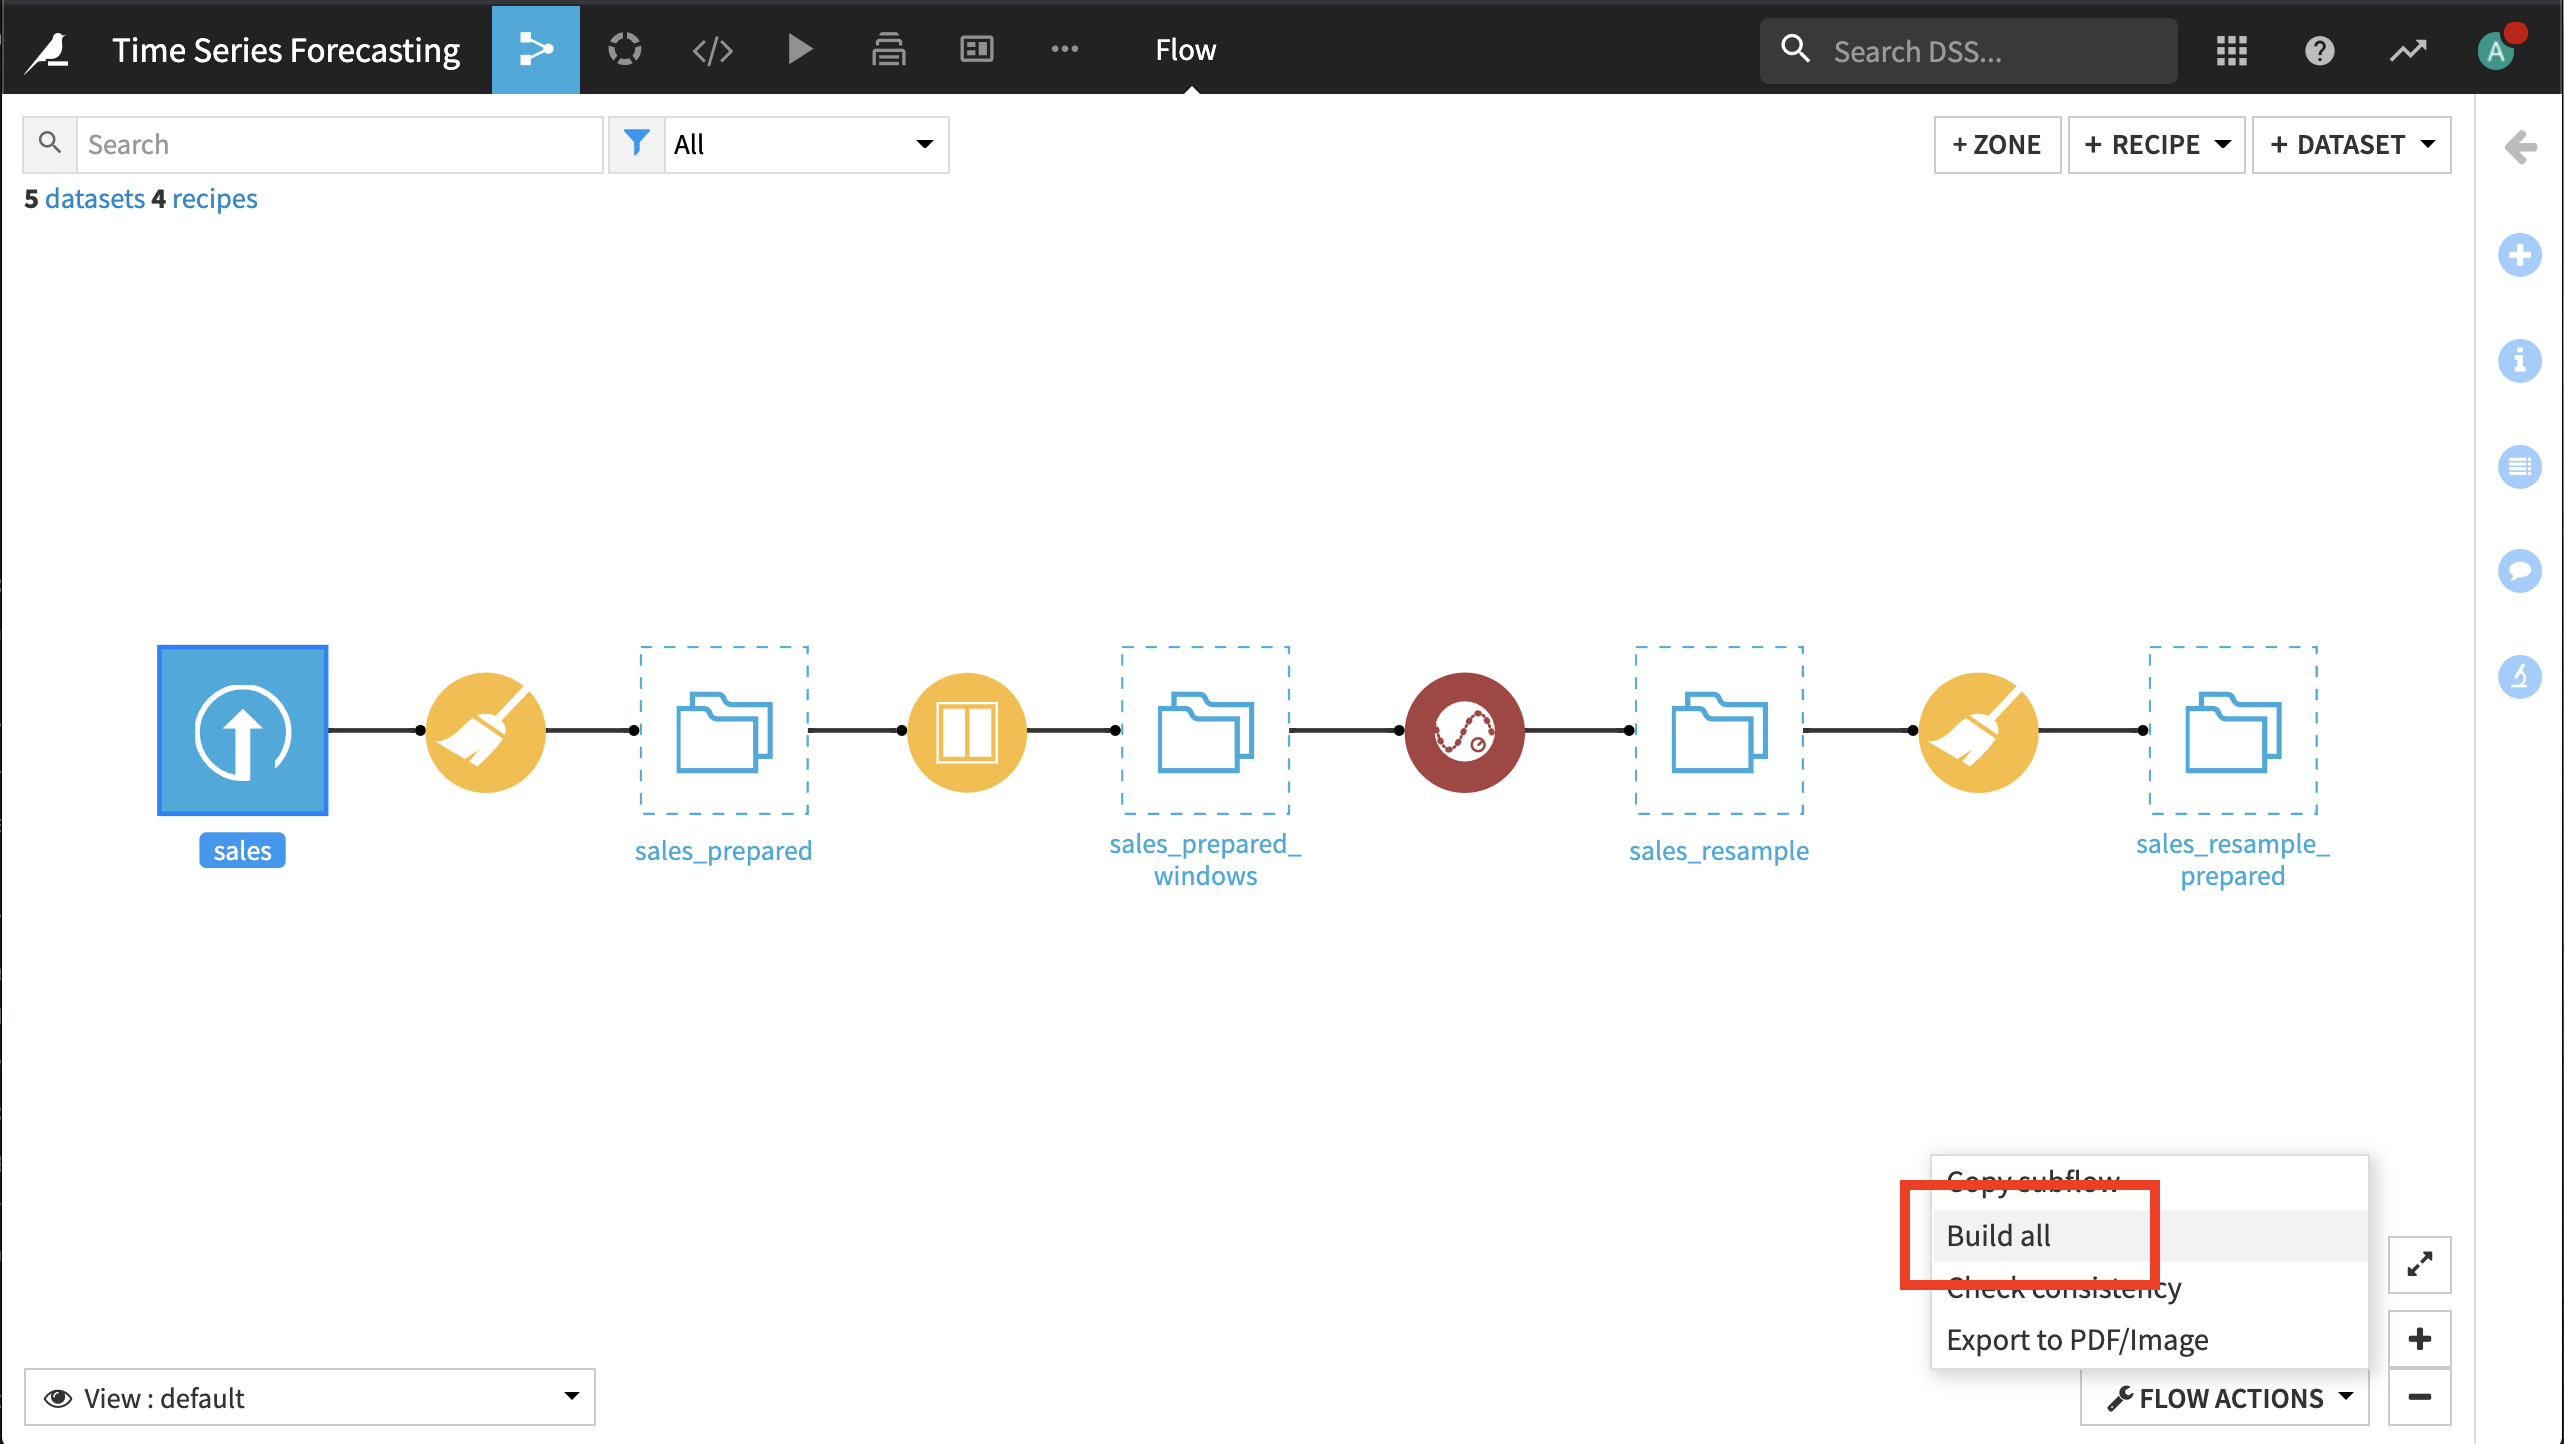
The input data contains weekly retail sales for multiple stores and departments from this Retail Data Analytics Kaggle dataset. The Flow already has the steps necessary to prepare the data for forecasting, and we just need to build the datasets.
The first Prepare recipe parses the dates and and concatenates the Store and Department columns to get a unique identifier for each store_dept couple.
The Window recipe counts the number of dates for each store_dept couple. In a Post-filter step, we remove store_dept time series that have too few dates.
The time series preparation Resampling recipe transforms time series data occurring in irregular time intervals into equispaced data that are required for the time series forecast training recipe.
The second Prepare recipe removes columns not used for forecasting and splits the concatenated store_dept column created in the first Prepare recipe back into the original Store and Dept columns.
From the Flow Actions menu, select Build All, then click Build in the following dialog.
Train and Evaluate Forecasting Models
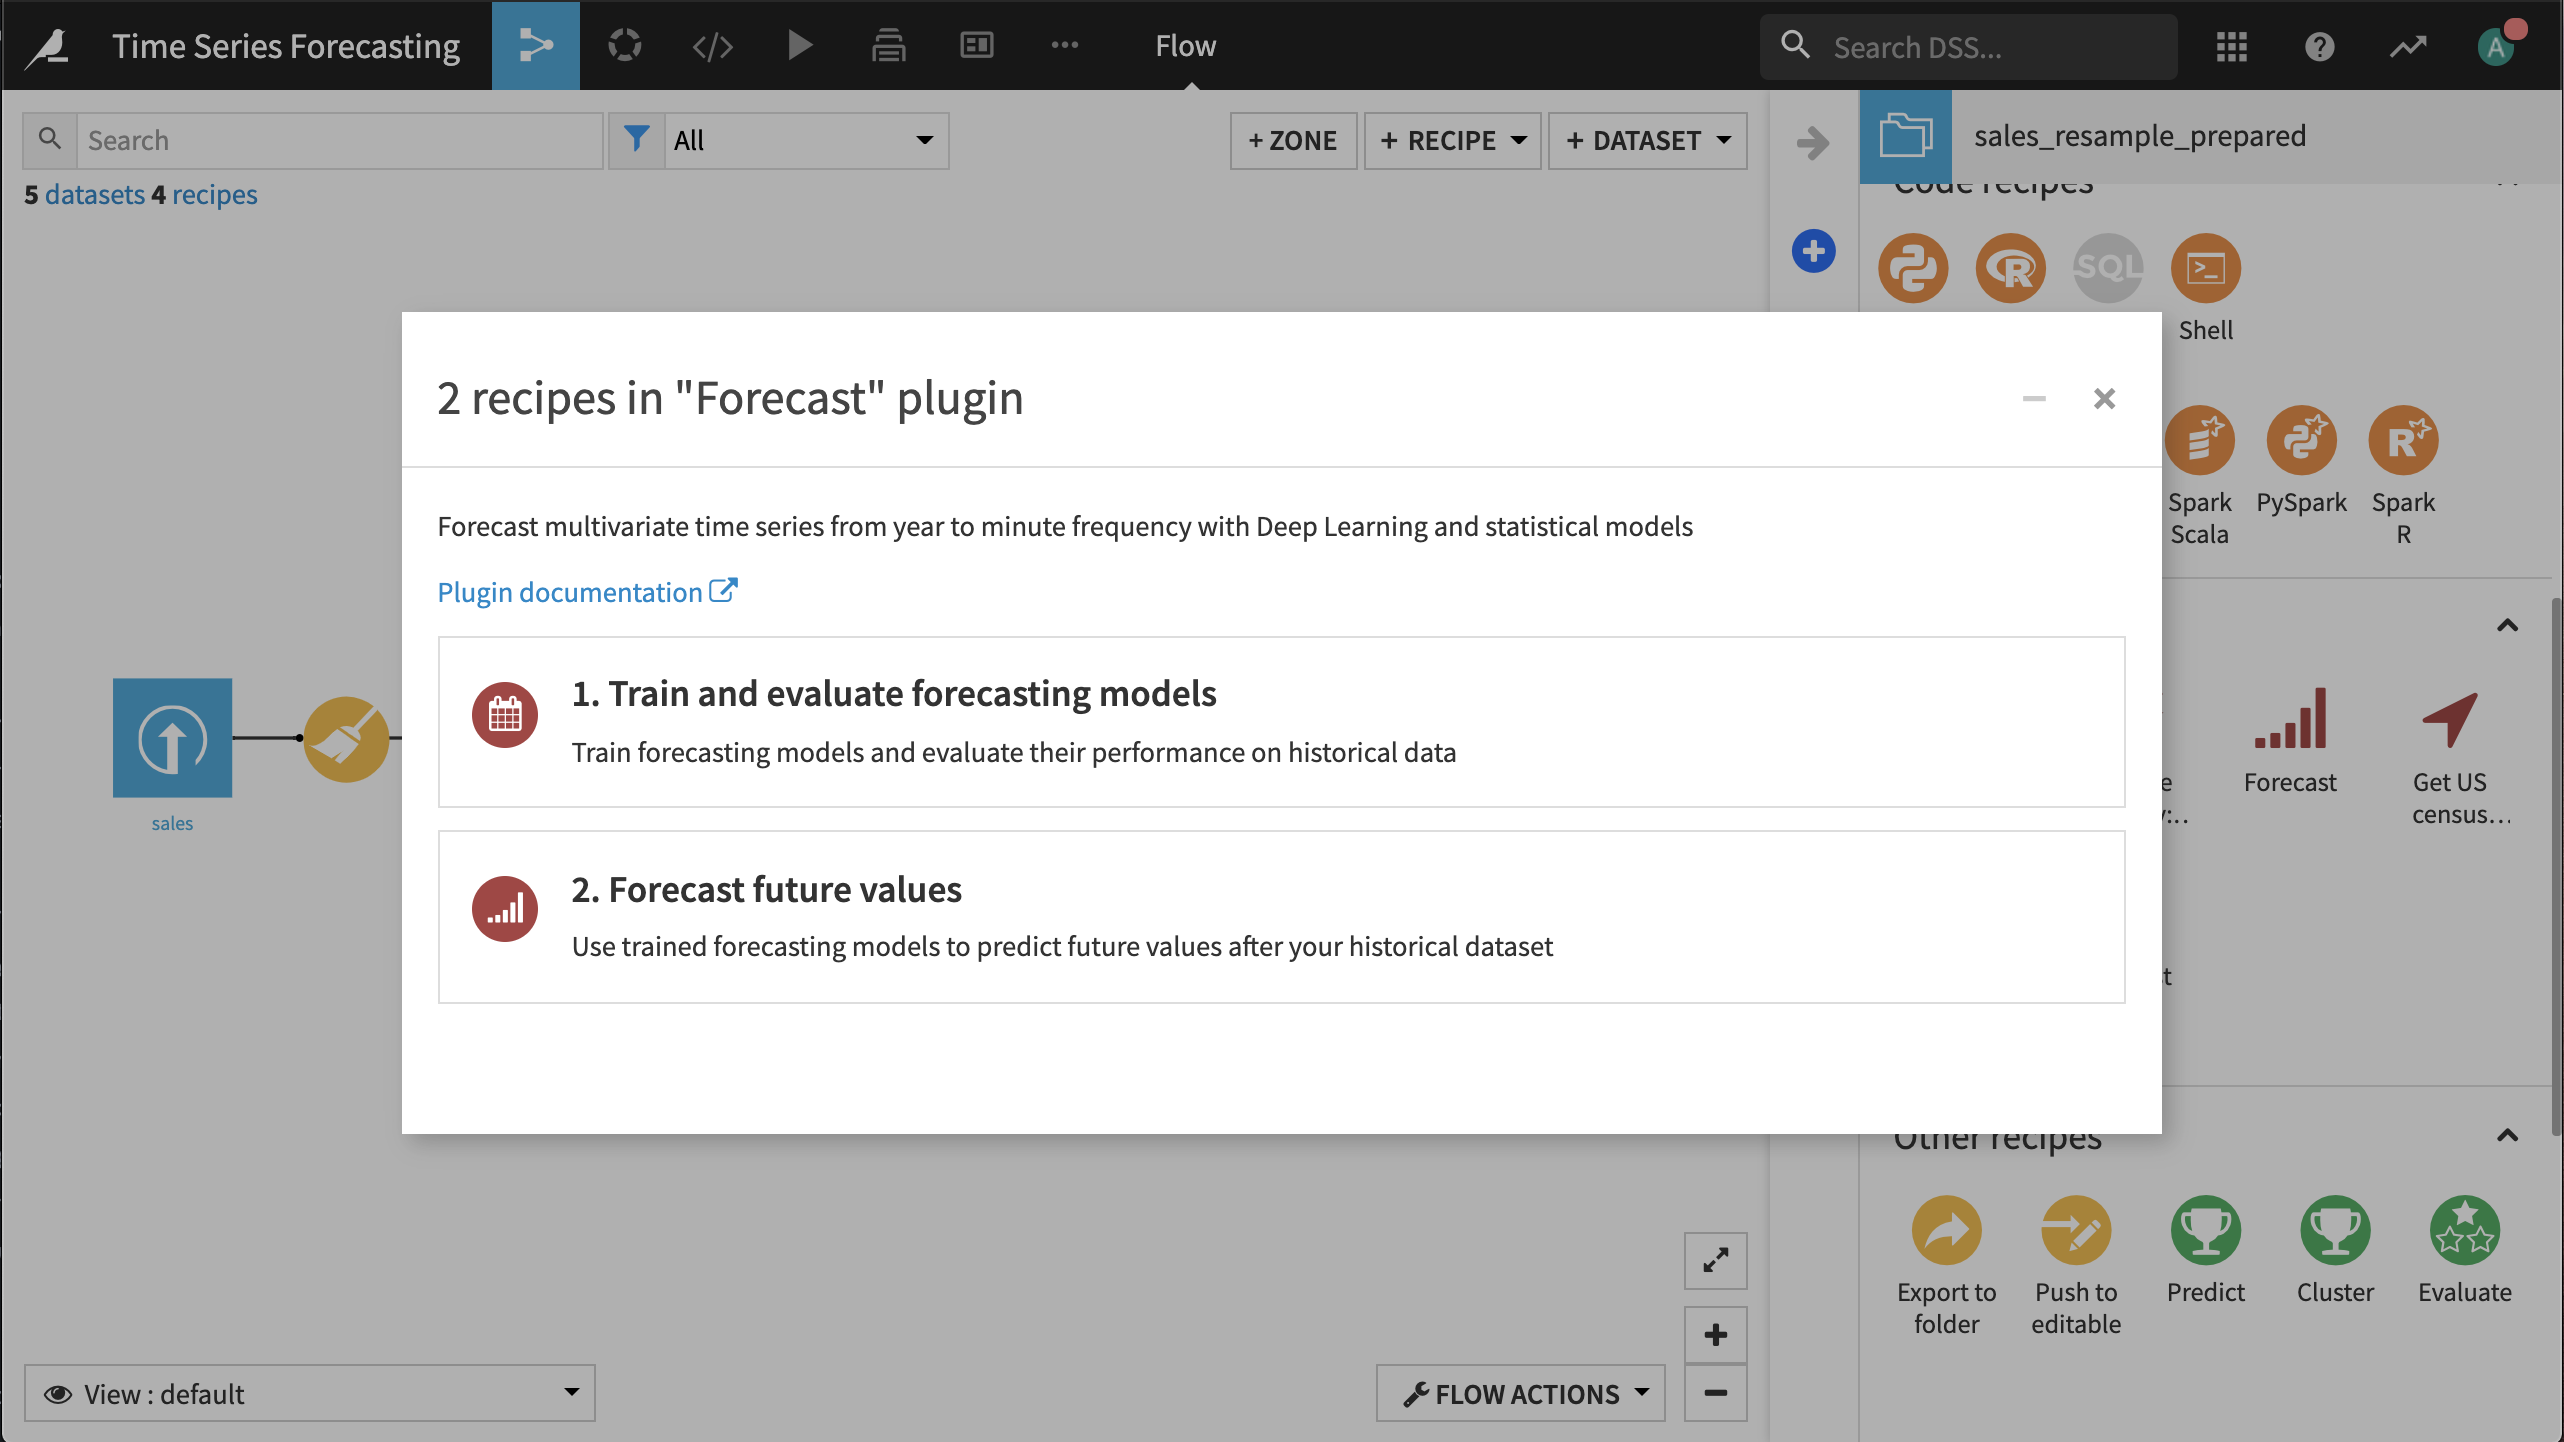
Select the sales_resample_prepared dataset and from the Actions panel, and select the Forecast plugin.
Select the Train and evaluate forecasting models plugin recipe.
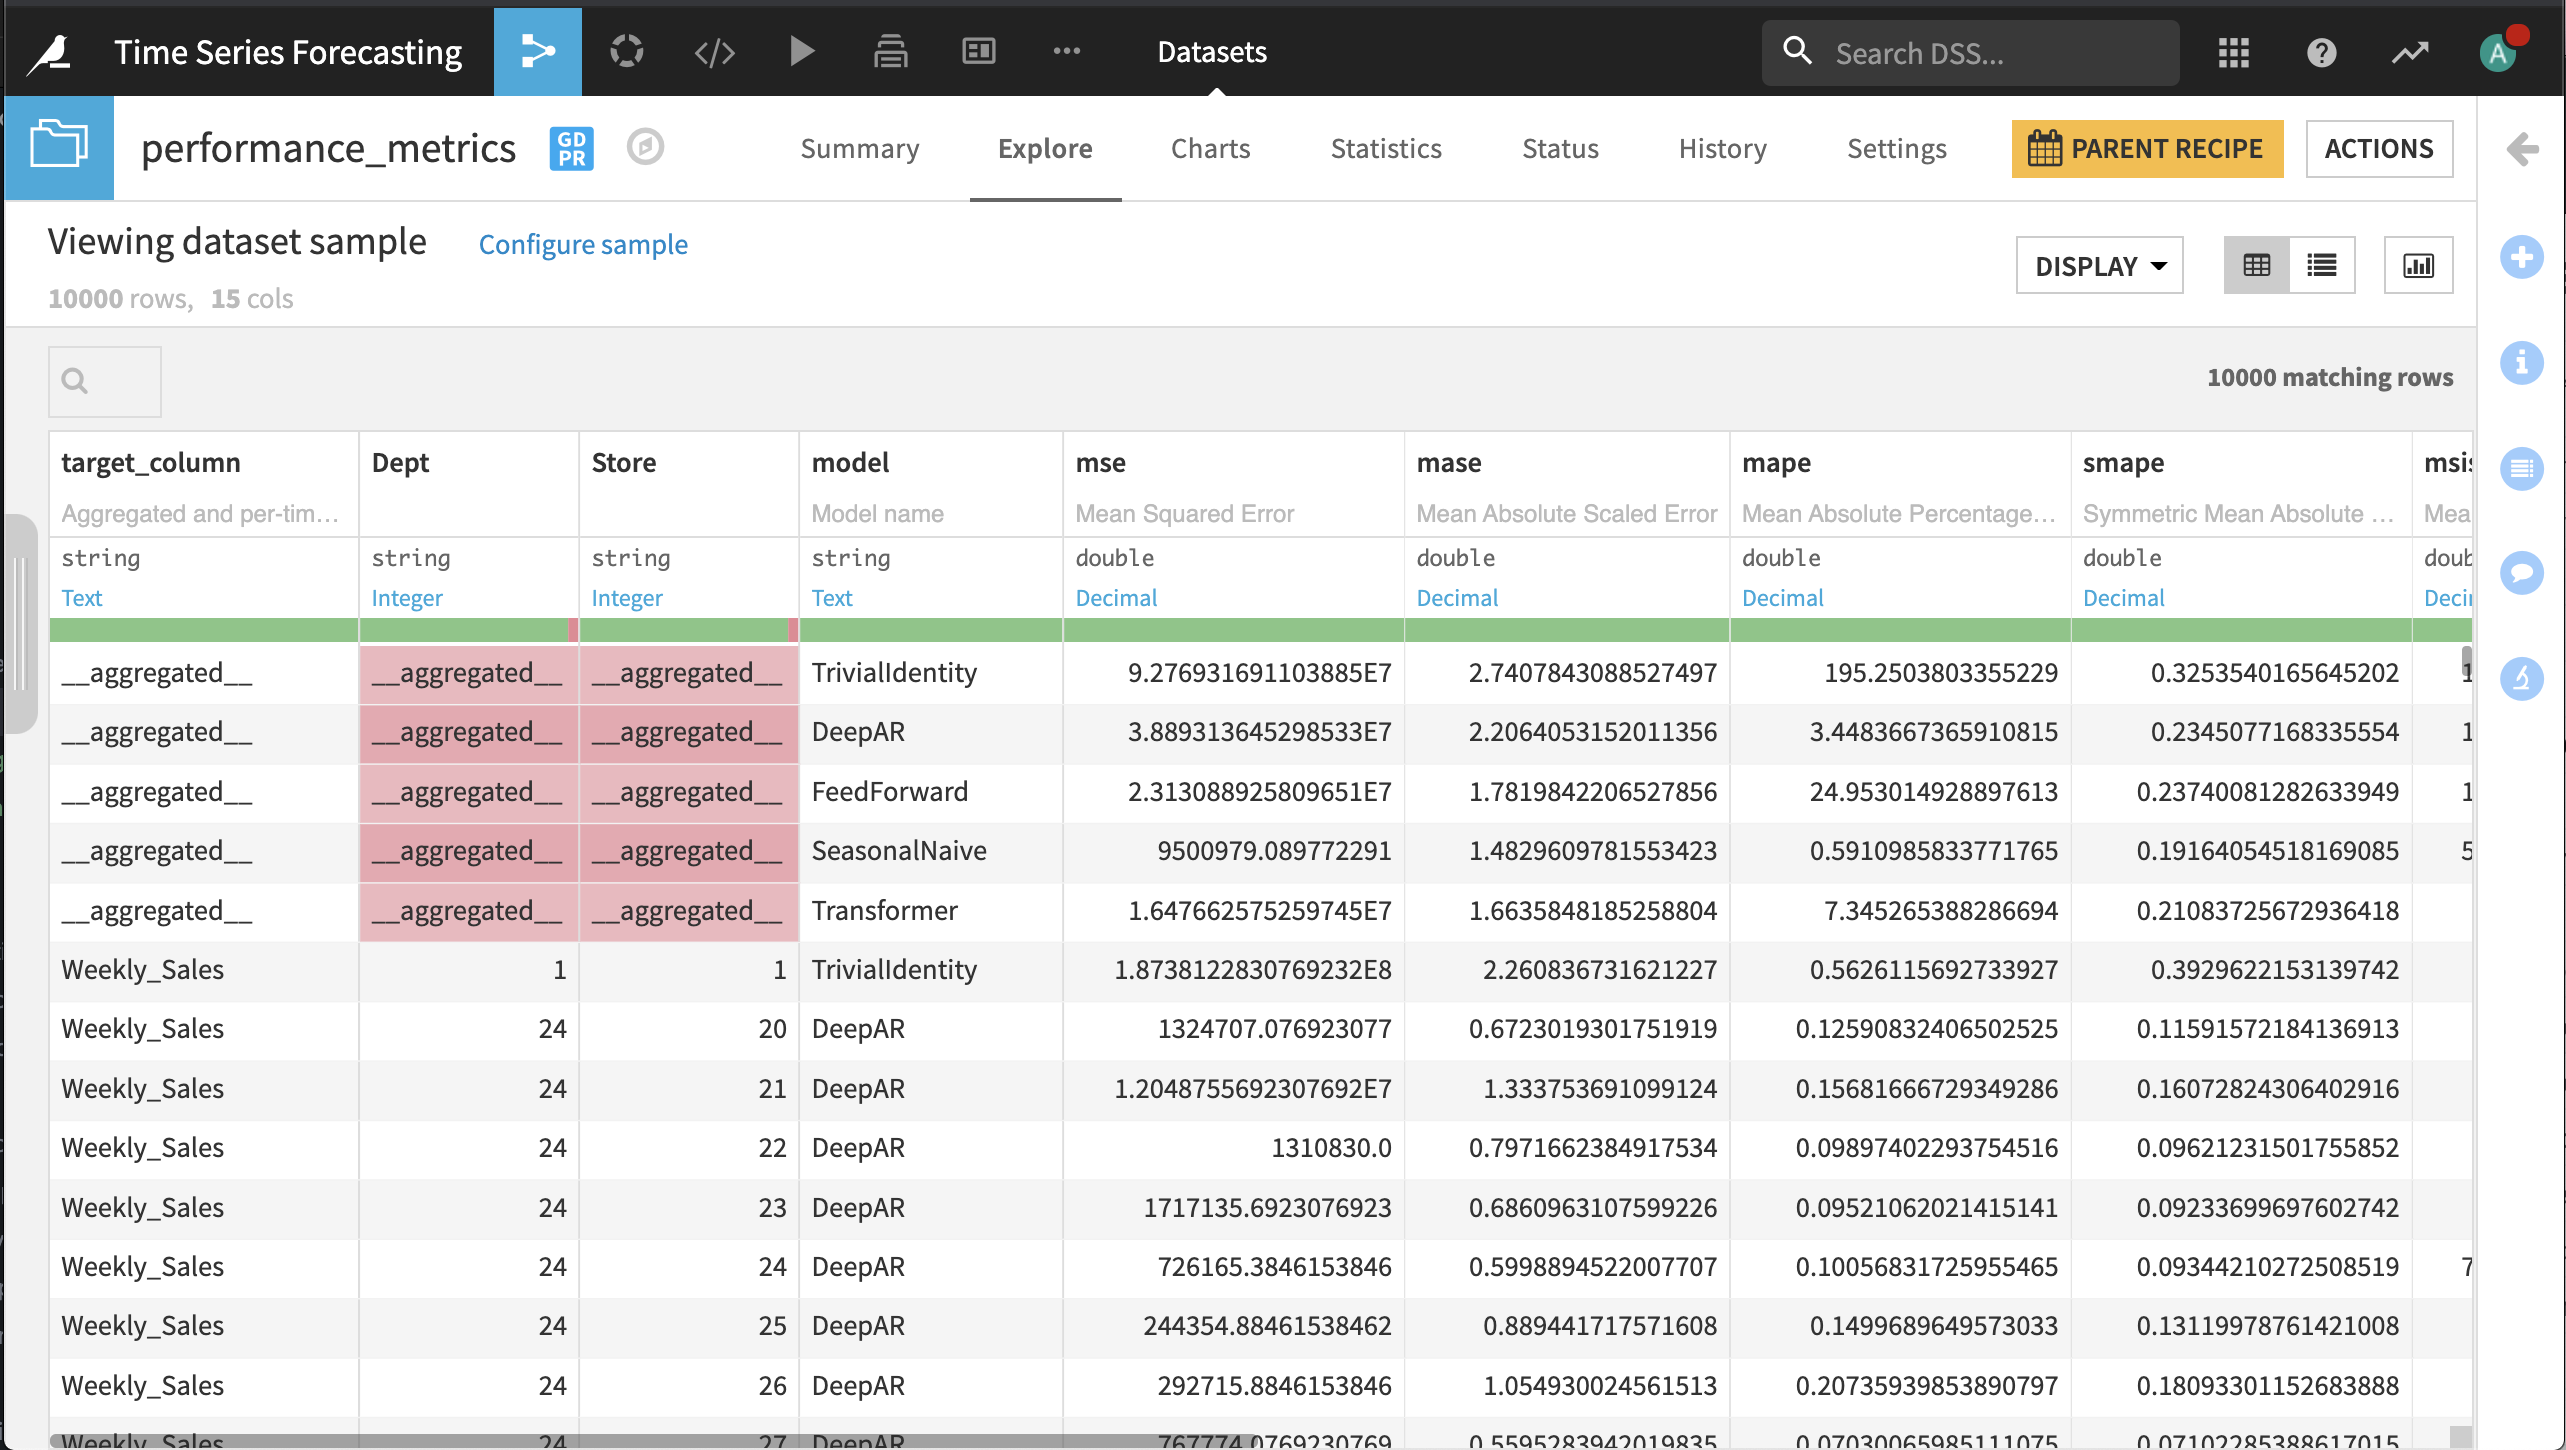
Create and name the outputs model_folder, performance_metrics, and evaluation_forecasts.
Click Create.
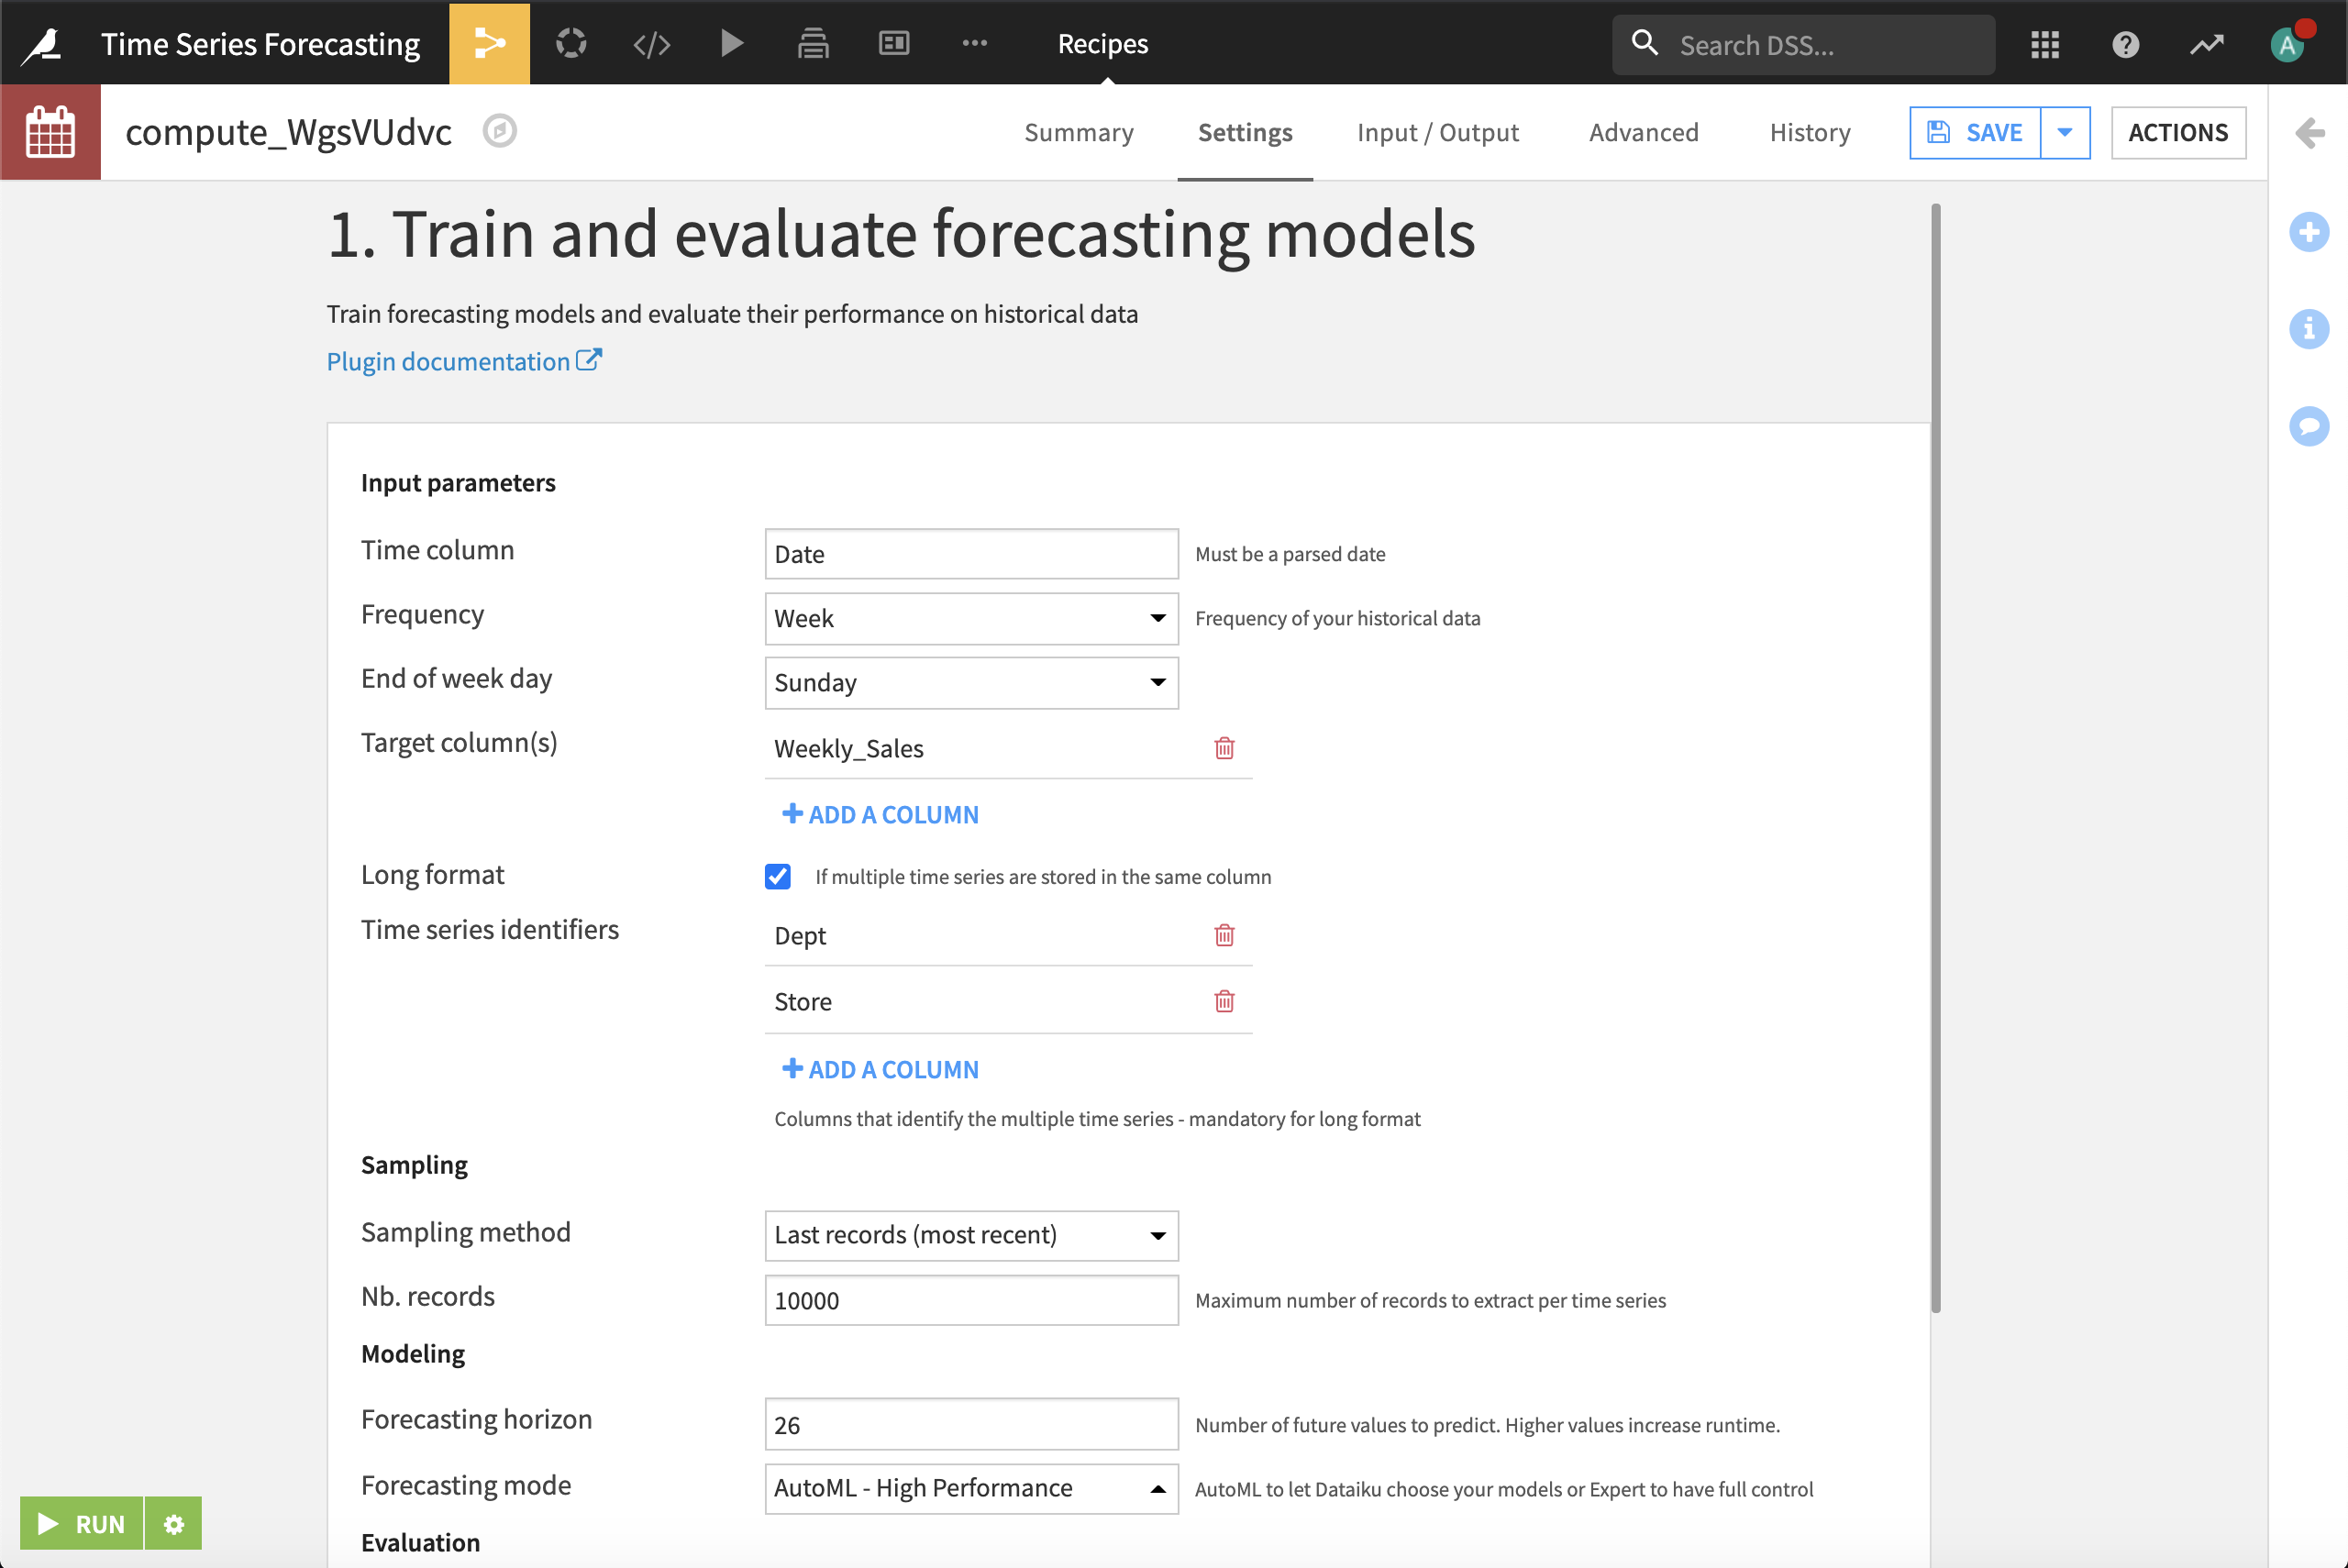
Select Date as the time column.
Select Week as the frequency.
Select Weekly_Sales as the target.
Select Long format and Dept and Store as the time series identifiers. A separate model will be fit for each Store - Dept couple.
Enter
26as the forecast horizon.Select AutoML - High Performance as the forecasting mode.
Click Run.
Note
This step may take some time to complete, especially if you can’t distribute the computation across containers. You may want to get a beverage of choice, chat with a colleague, or clean your inbox.
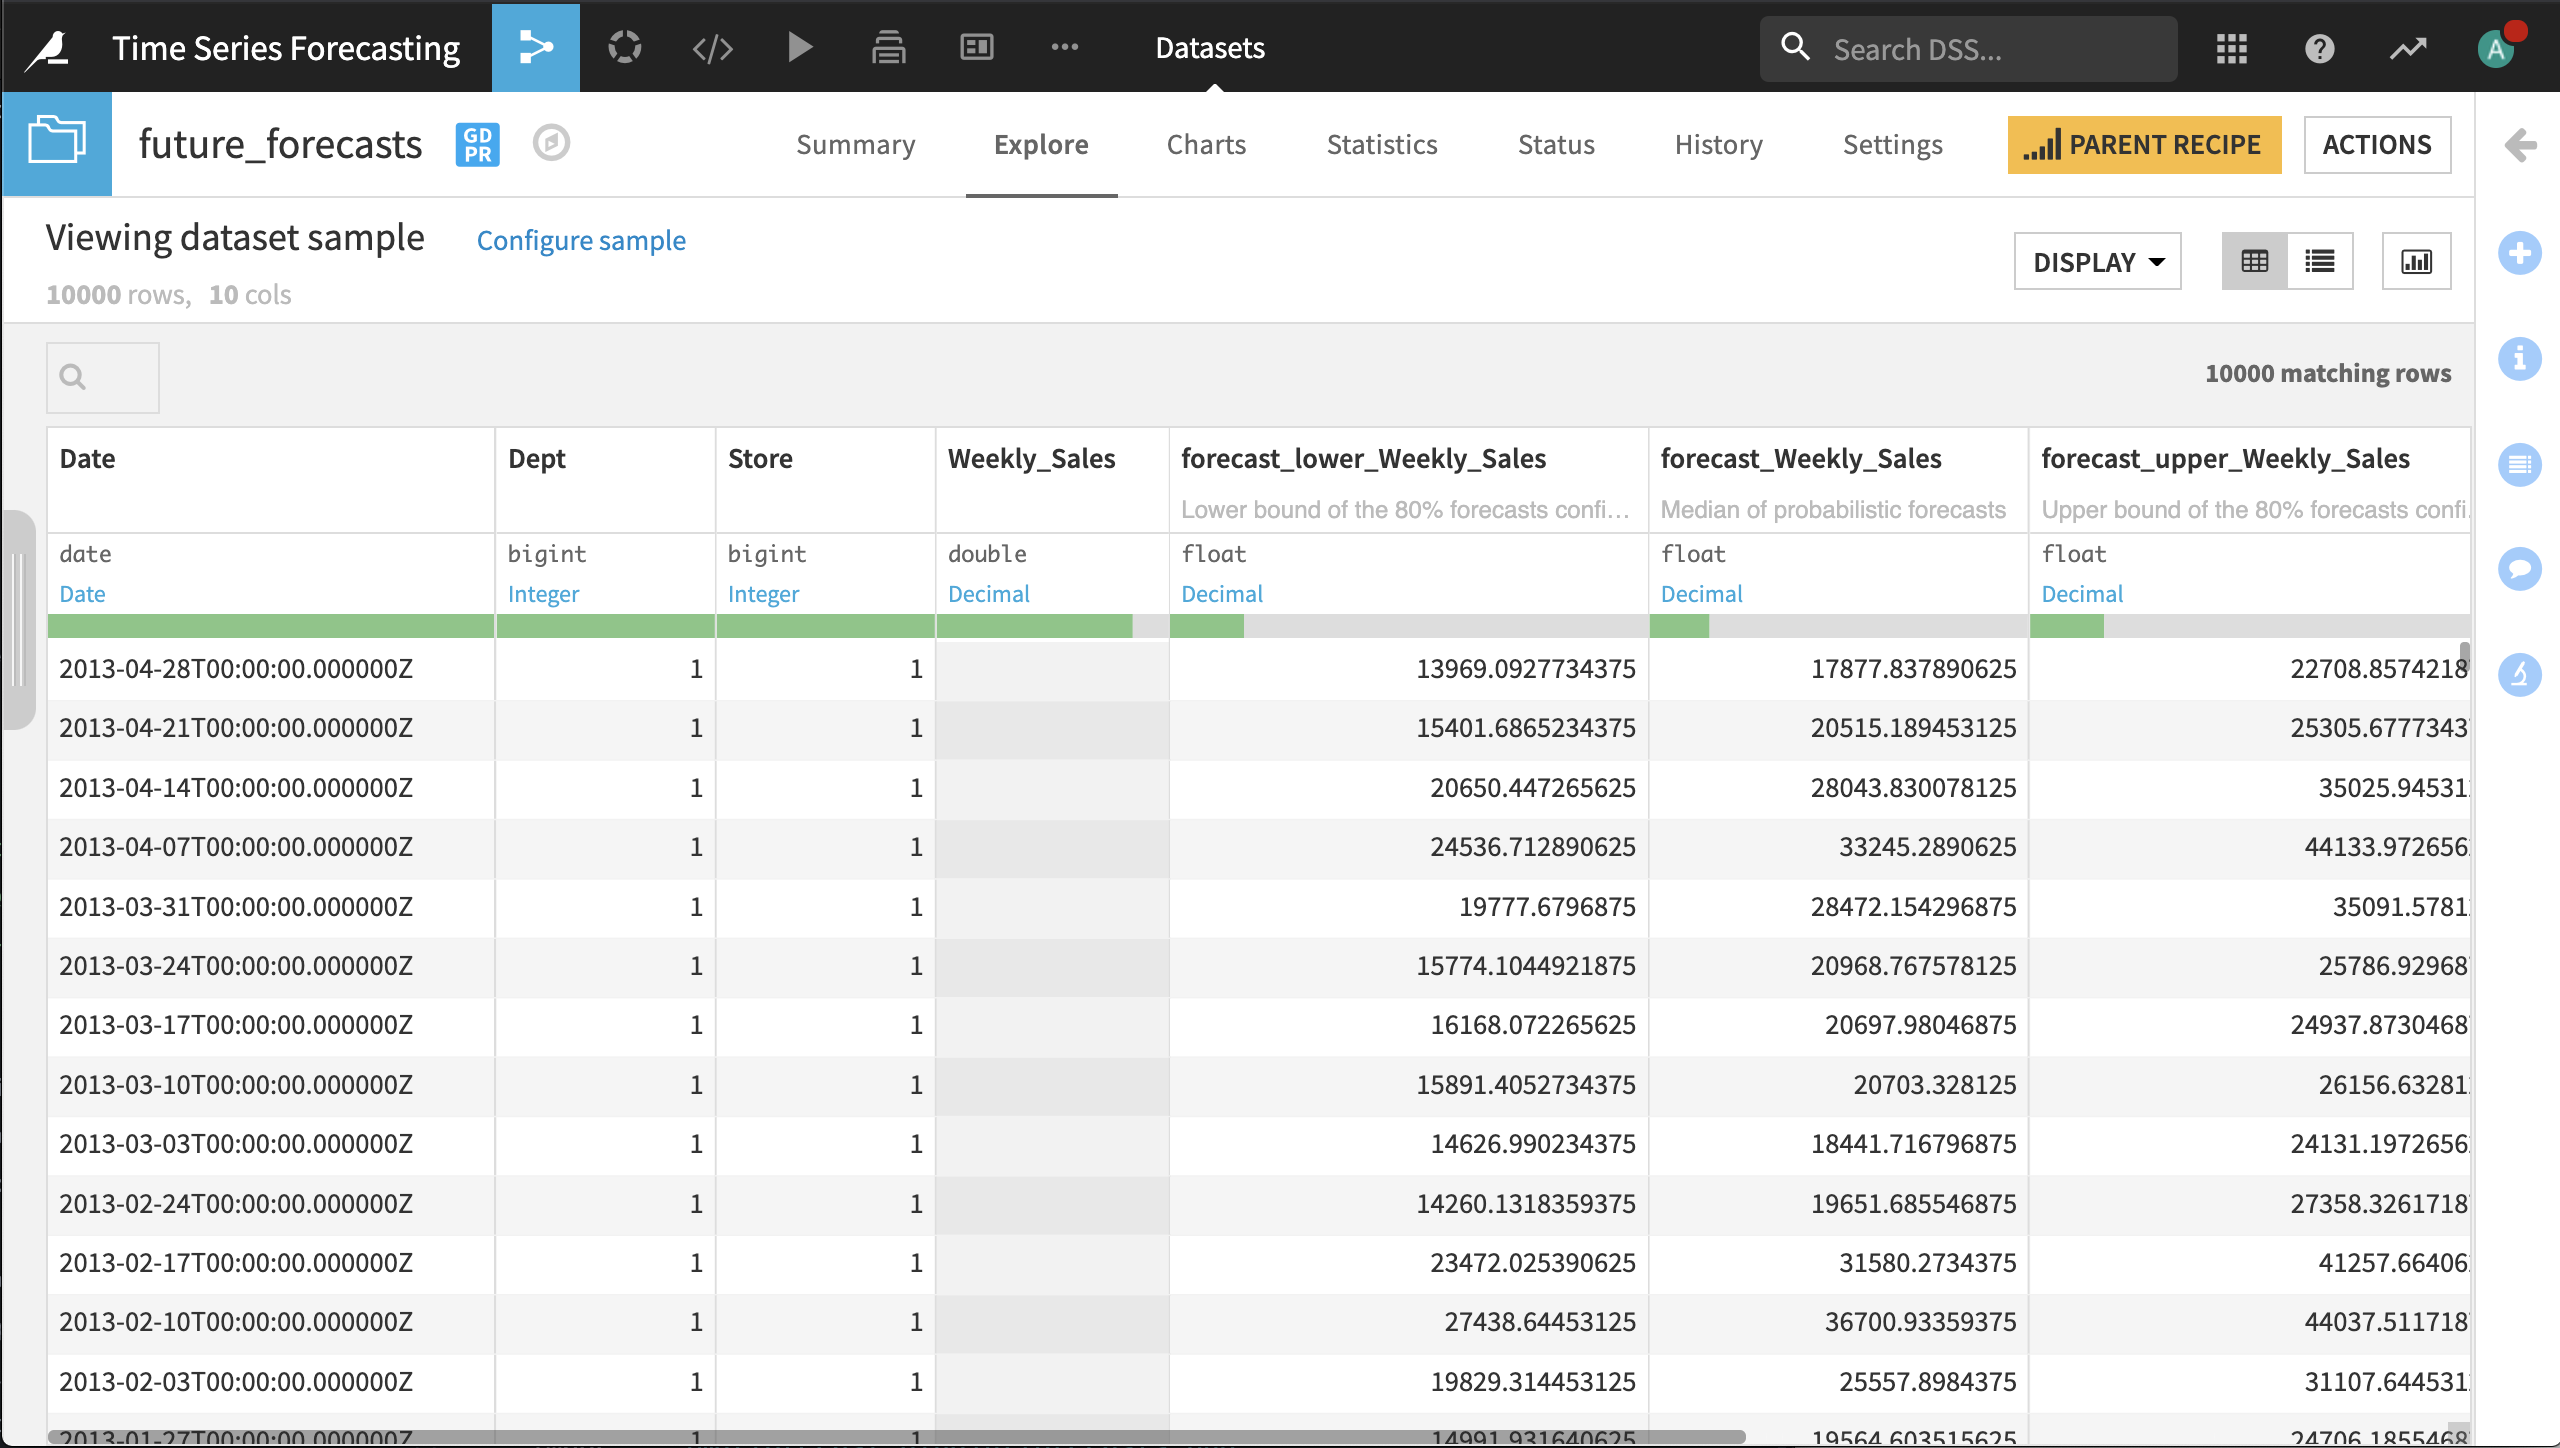
The trained models are stored in the model_folder folder. The evaluation_forecasts dataset contains the observed and model-predicted values for the last 26 weeks of sales. These predictions are used to compute the overall performance metrics for each model in the performance_metrics dataset.
Forecast Future Values
Now we can use the trained models to forecast the weekly sales for each store and department over the next 26 weeks.
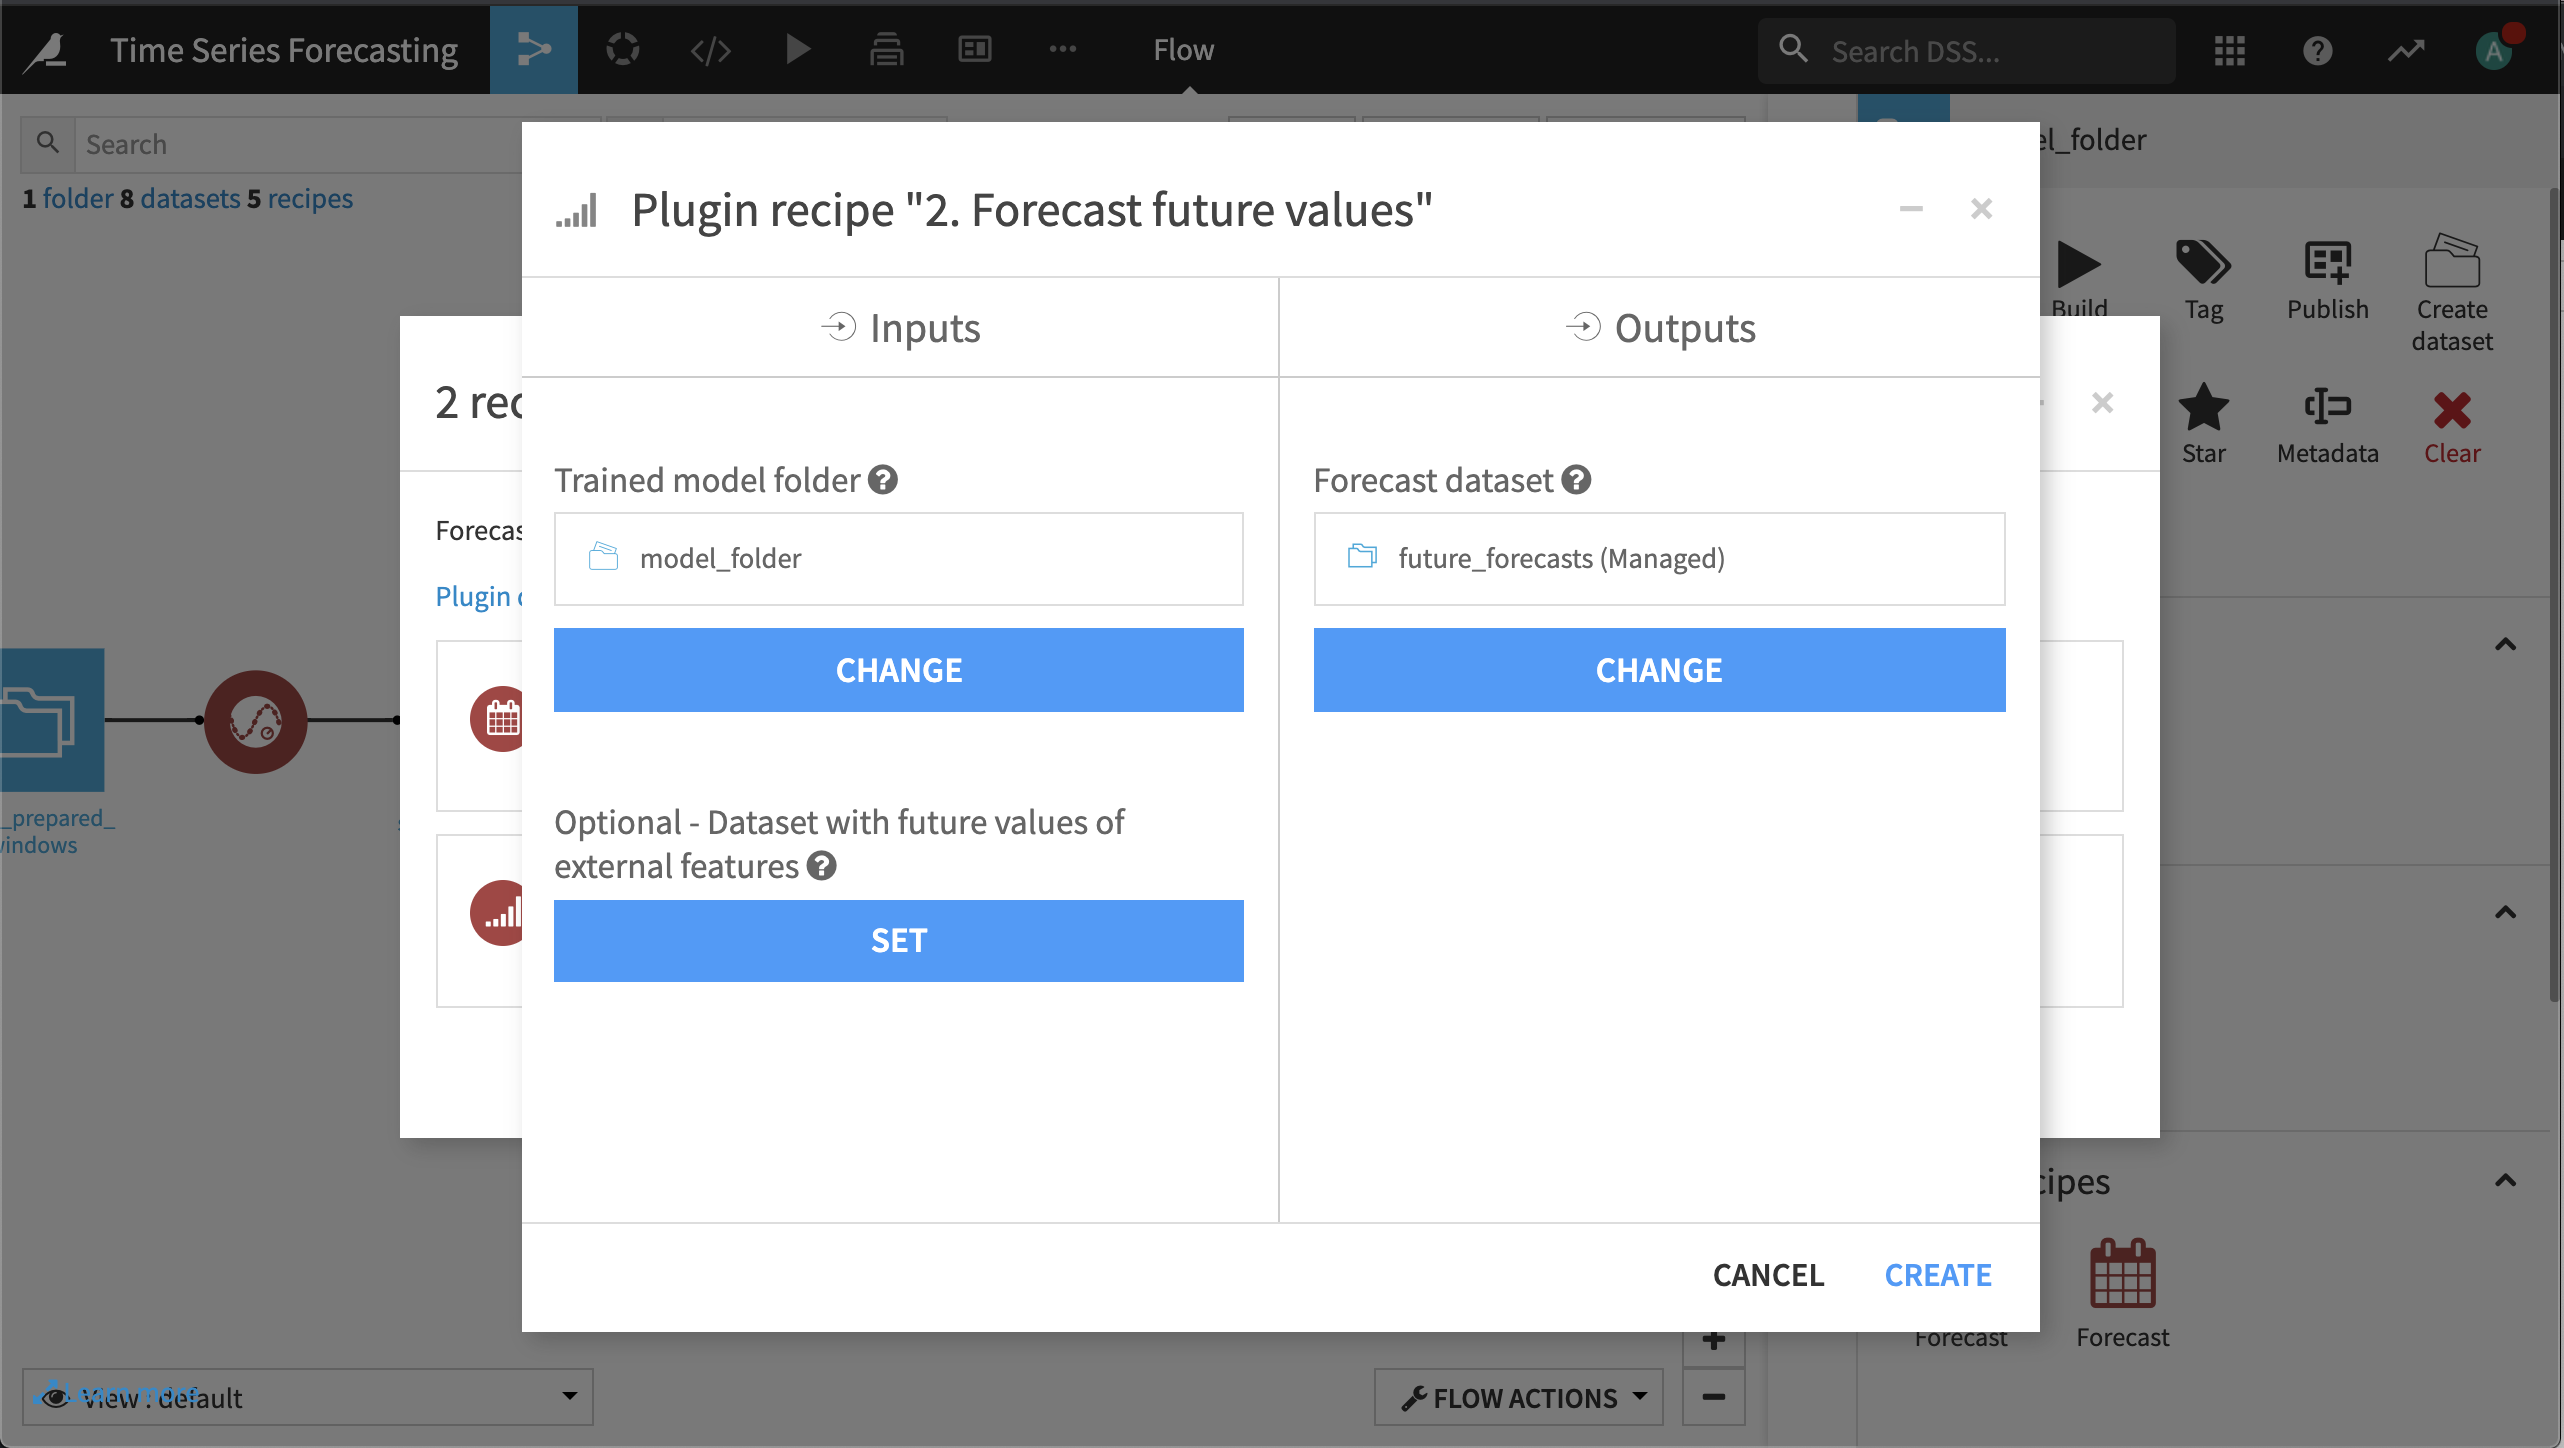
In the Flow, select the model_folder folder and from the Actions panel, select the Forecast plugin.
Select the Forecast future values plugin recipe.
Create and name the output dataset future_forecasts.
Click Create.
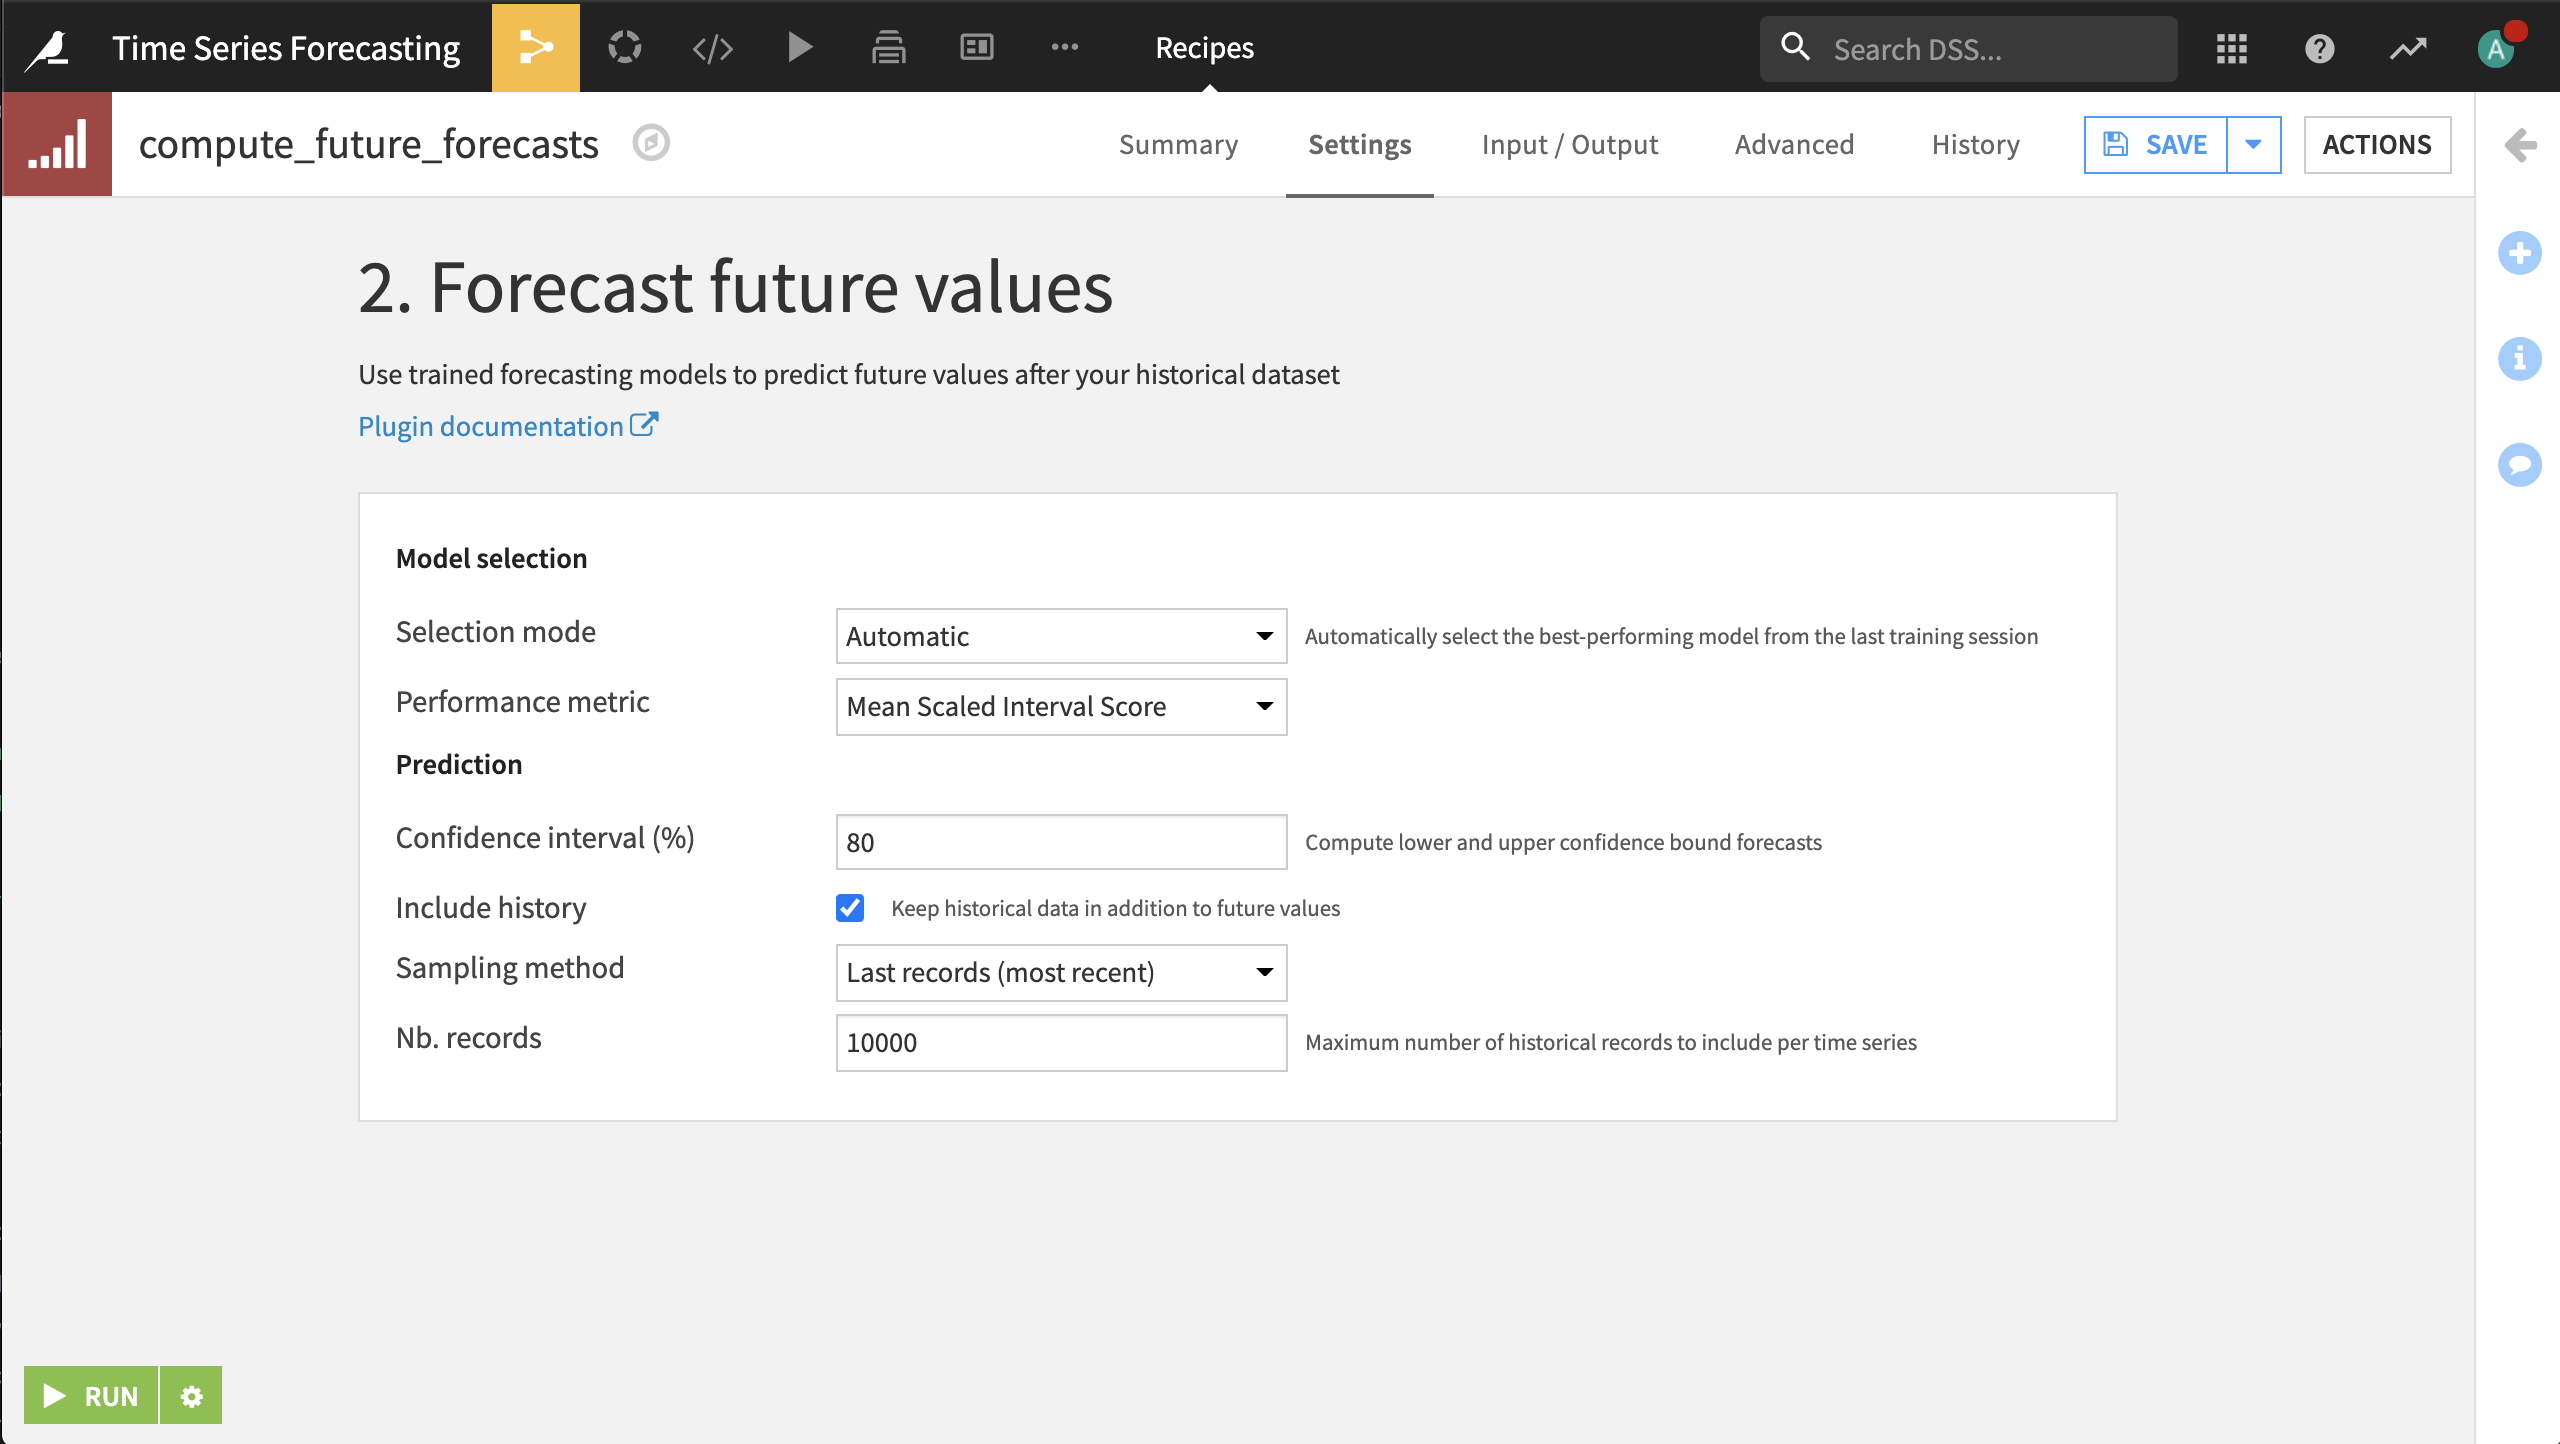
In the model selection section, leave the selection mode to automatically choose the model for scoring. Select Mean Scaled Interval Score as the metric to choose the best performing model.
Choose to compute 80% confidence intervals.
Click Run.
Open the output dataset. It contains forecast median values, as well as lower and upper confidence bounds for the next 26 weeks. These forecasts can be visualized in the second slide of the Forecasting dashboard.