Hands-On Tutorial: Monitoring Projects in Production
Projects deployed in production require close monitoring to ensure that its components run as expected, as new data arrives and conditions change. For example, with a model running in production, we’d be concerned whether over time:
the quality of the input data is stable, and
the relationship between the model and the data stays relevant.
At this point, you already have been introduced to all of the tools necessary to solve this kind of MLOps problem:
the model evaluation store to version model performance;
scenarios using metrics, checks, triggers, and reporters; and
the ability to deploy (and re-deploy) new bundle versions to production.
Let’s see how they can work together to achieve this goal!
Let’s Get Started!
In this tutorial, you will:
track data drift using the model evaluation store;
design a scenario that sends an alert if data drift rises above a certain threshold;
deploy a new version of the project bundle so this scenario can run in a production environment.
Use Case
In tutorials throughout the MLOps Practitioner learning path, you’ll work with a simple credit card fraud use case. Using data about transactions, merchants, and cardholders, we have a model that predicts which transactions should be authorized and which are potentially fraudulent.
A score of 1 for the target variable, authorized_flag, represents an authorized transaction. A score of 0, on the other hand, is a transaction that failed authorization.
The focal point of the Flow is a model evaluation store that logs the performance of the prediction model against new quarters of data. In this case, we consider three months of data as one batch.
Prerequisites
This tutorial assumes that you satisfy all of the technical prerequisites for the MLOps Practitioner learning path.
Resume the Project
This tutorial also assumes that you have completed the Batch Deployment tutorial, and so have an active deployment of the “DKU_TUT_MLOPS” project running on an Automation node.
If you do not have this project available and want to review only this present tutorial, from the homepage of your Design node, click +New Project > DSS Tutorials > MLOps > MLOps (Tutorial).
Note
You can also download the starter project from this website and import it as a zip file.
Otherwise, return to the MLOps project on your Design node to pick up where we left off.
Warning
If skipping the Batch Deployment tutorial, be aware that instead of updating a deployment as described, you’ll be creating a new one.
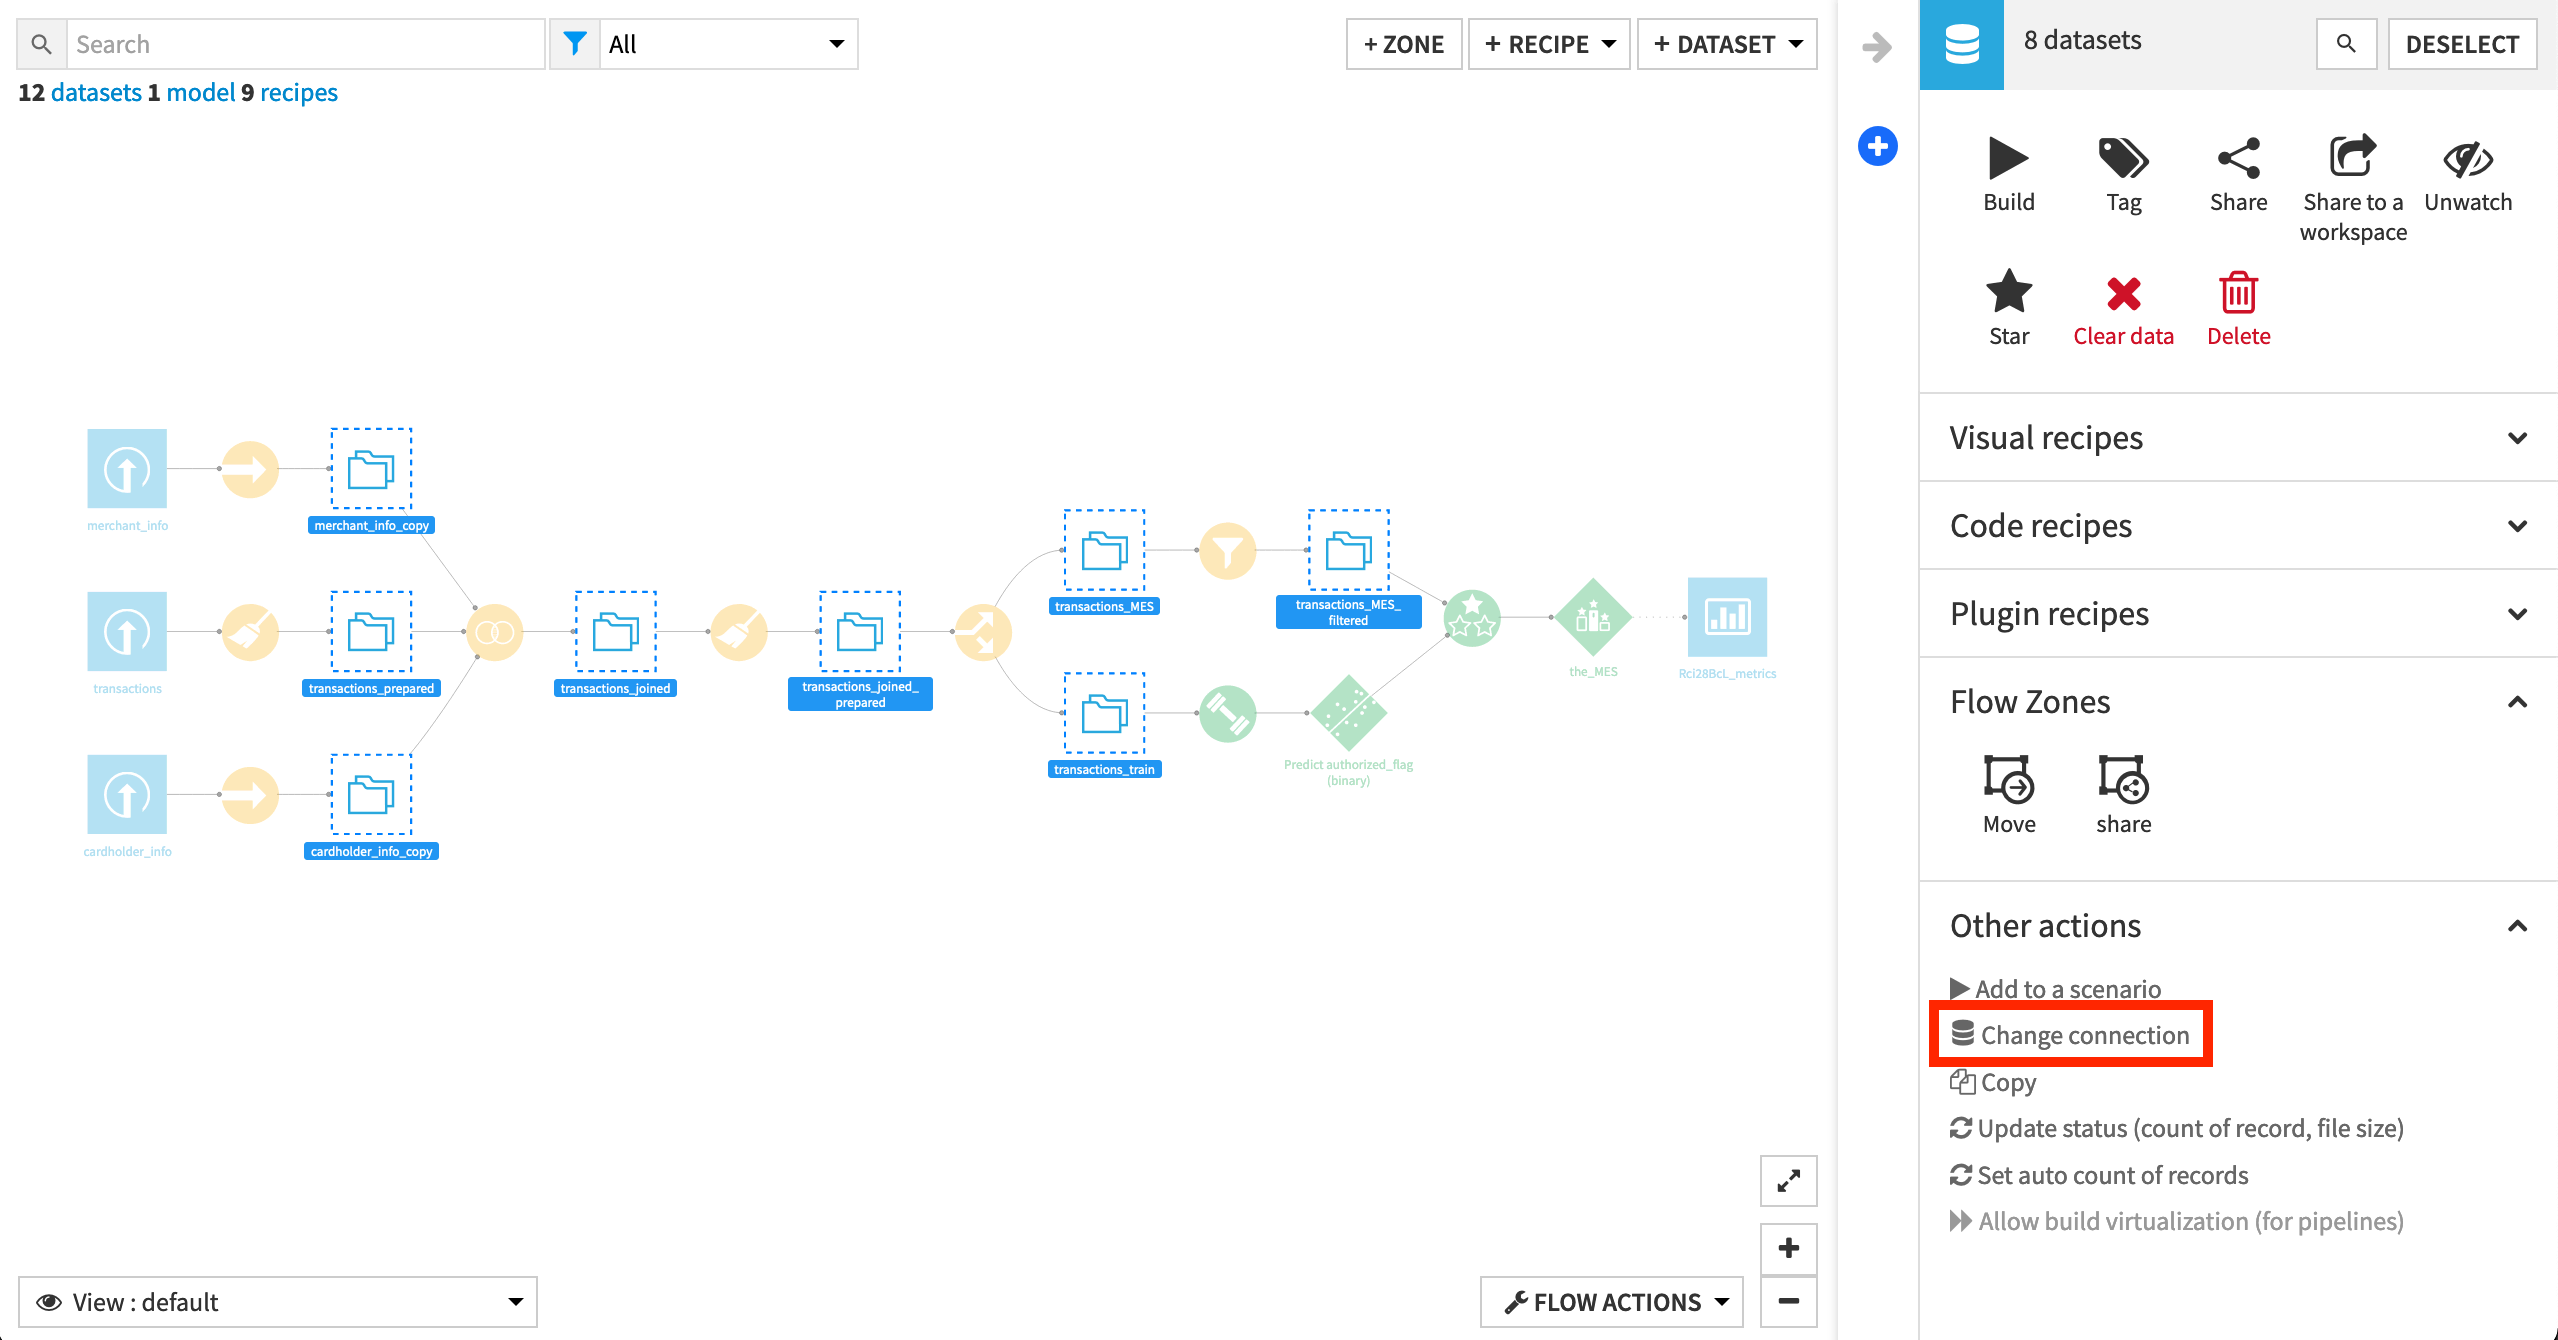
Remap Connections (Recommended)
To simplify the import process, the starter project contains only filesystem connections. However, the walkthrough of this tutorial has synced the eight intermediate datasets to a PostgreSQL database. To change the filesystem connections to a SQL connection, review the remap connections article in the Knowledge Base.
Note
While we recommended that you remap filesystem connections to a SQL database, it is not required for completing this hands-on tutorial.
Also, note that if you use a SQL connection on the Design node, you’ll need to create the same SQL connection on the Automation node or remap the SQL connection to another SQL connection on the Automation node.
Monitor a Model with the Model Evaluation Store
With a project deployed to the Automation node, how do we ensure the project is running as expected? In particular for this use case, how can we determine that the new batches of input data are similar to the data used to train the model?
We’ll start with sending batches of data to the model evaluation store in order to evaluate the model’s performance.
Generate Evaluation Data
In the project’s Flow, recall that the model was trained only on Q1 2017 data. To confirm this, see the Split recipe that produces the transactions_train dataset.
However, for the purposes of this example, we now have another three quarters of labeled data, where we know which transactions failed authorization. In other words, we have three additional quarters of “ground truth” data, which we can use to evaluate how well the model is still performing or how far the input data has drifted from the training data.
Imagine that this data originally came through the production databases on the Automation node, but now has been imported to the Design node for analysis. For convenience, we’ll use a scenario to simulate sending each quarter’s data through the Flow to the model evaluation store.
Warning
If using the same project from previous MLOps tutorials, you already have Q4 2017 data in the model evaluation store. Although there’s no harm in keeping it, for simplicity, remove it by opening the MES, clicking the empty box next to the Actions button to select all rows, and then Remove.
Navigate to the project’s Scenarios page, and turn on (and then off if you wish) the auto-trigger status of the “Recursive_MES” scenario.
Note
The objective here is to introduce any change that will transfer the “Run as” setting from the user on the instance where this project was originally created to you, the present user and now the “last author” of the scenario. You should see the green “Saved” popup, and the time of the last modification shown on the Scenarios page should update to “just now”.
In all of the other examples in these tutorials, we directly run the scenario at hand from a user with permissions to do so, and so we do not need to worry about the “Run as” setting of the other imported scenarios. However, in this case, as we will run the “Recursive_MES” scenario from another scenario, the “last author” of the “Recursive_MES” scenario remains in fact the user who last modified the scenario–until we introduce some change.
Open the Build_Project_MES scenario, and navigate to the Script tab.
Although you do not need to study the scenario API, know that it cycles through each quarter, changing the variables in the Filter recipe to produce a new set of evaluation data for every new quarter.
Click the green Run button.

Note
The “Build_Project_MES” scenario uses a Python script to run the “Recursive_MES scenario” for Q2, Q3, and Q4. You could have done this by manually changing the date variables and re-building the Flow and model evaluation store. The scenario just shows an automated way to do this. The main goal is to have some data to observe in the model evaluation store.
Interpret the Results
Let’s now briefly interpret the results found in the model evaluation store.
In the Flow, again open the model evaluation store called the_MES.
Thanks to the above scenario, we have some results depicting how key model metrics have evolved for three different quarters of data.
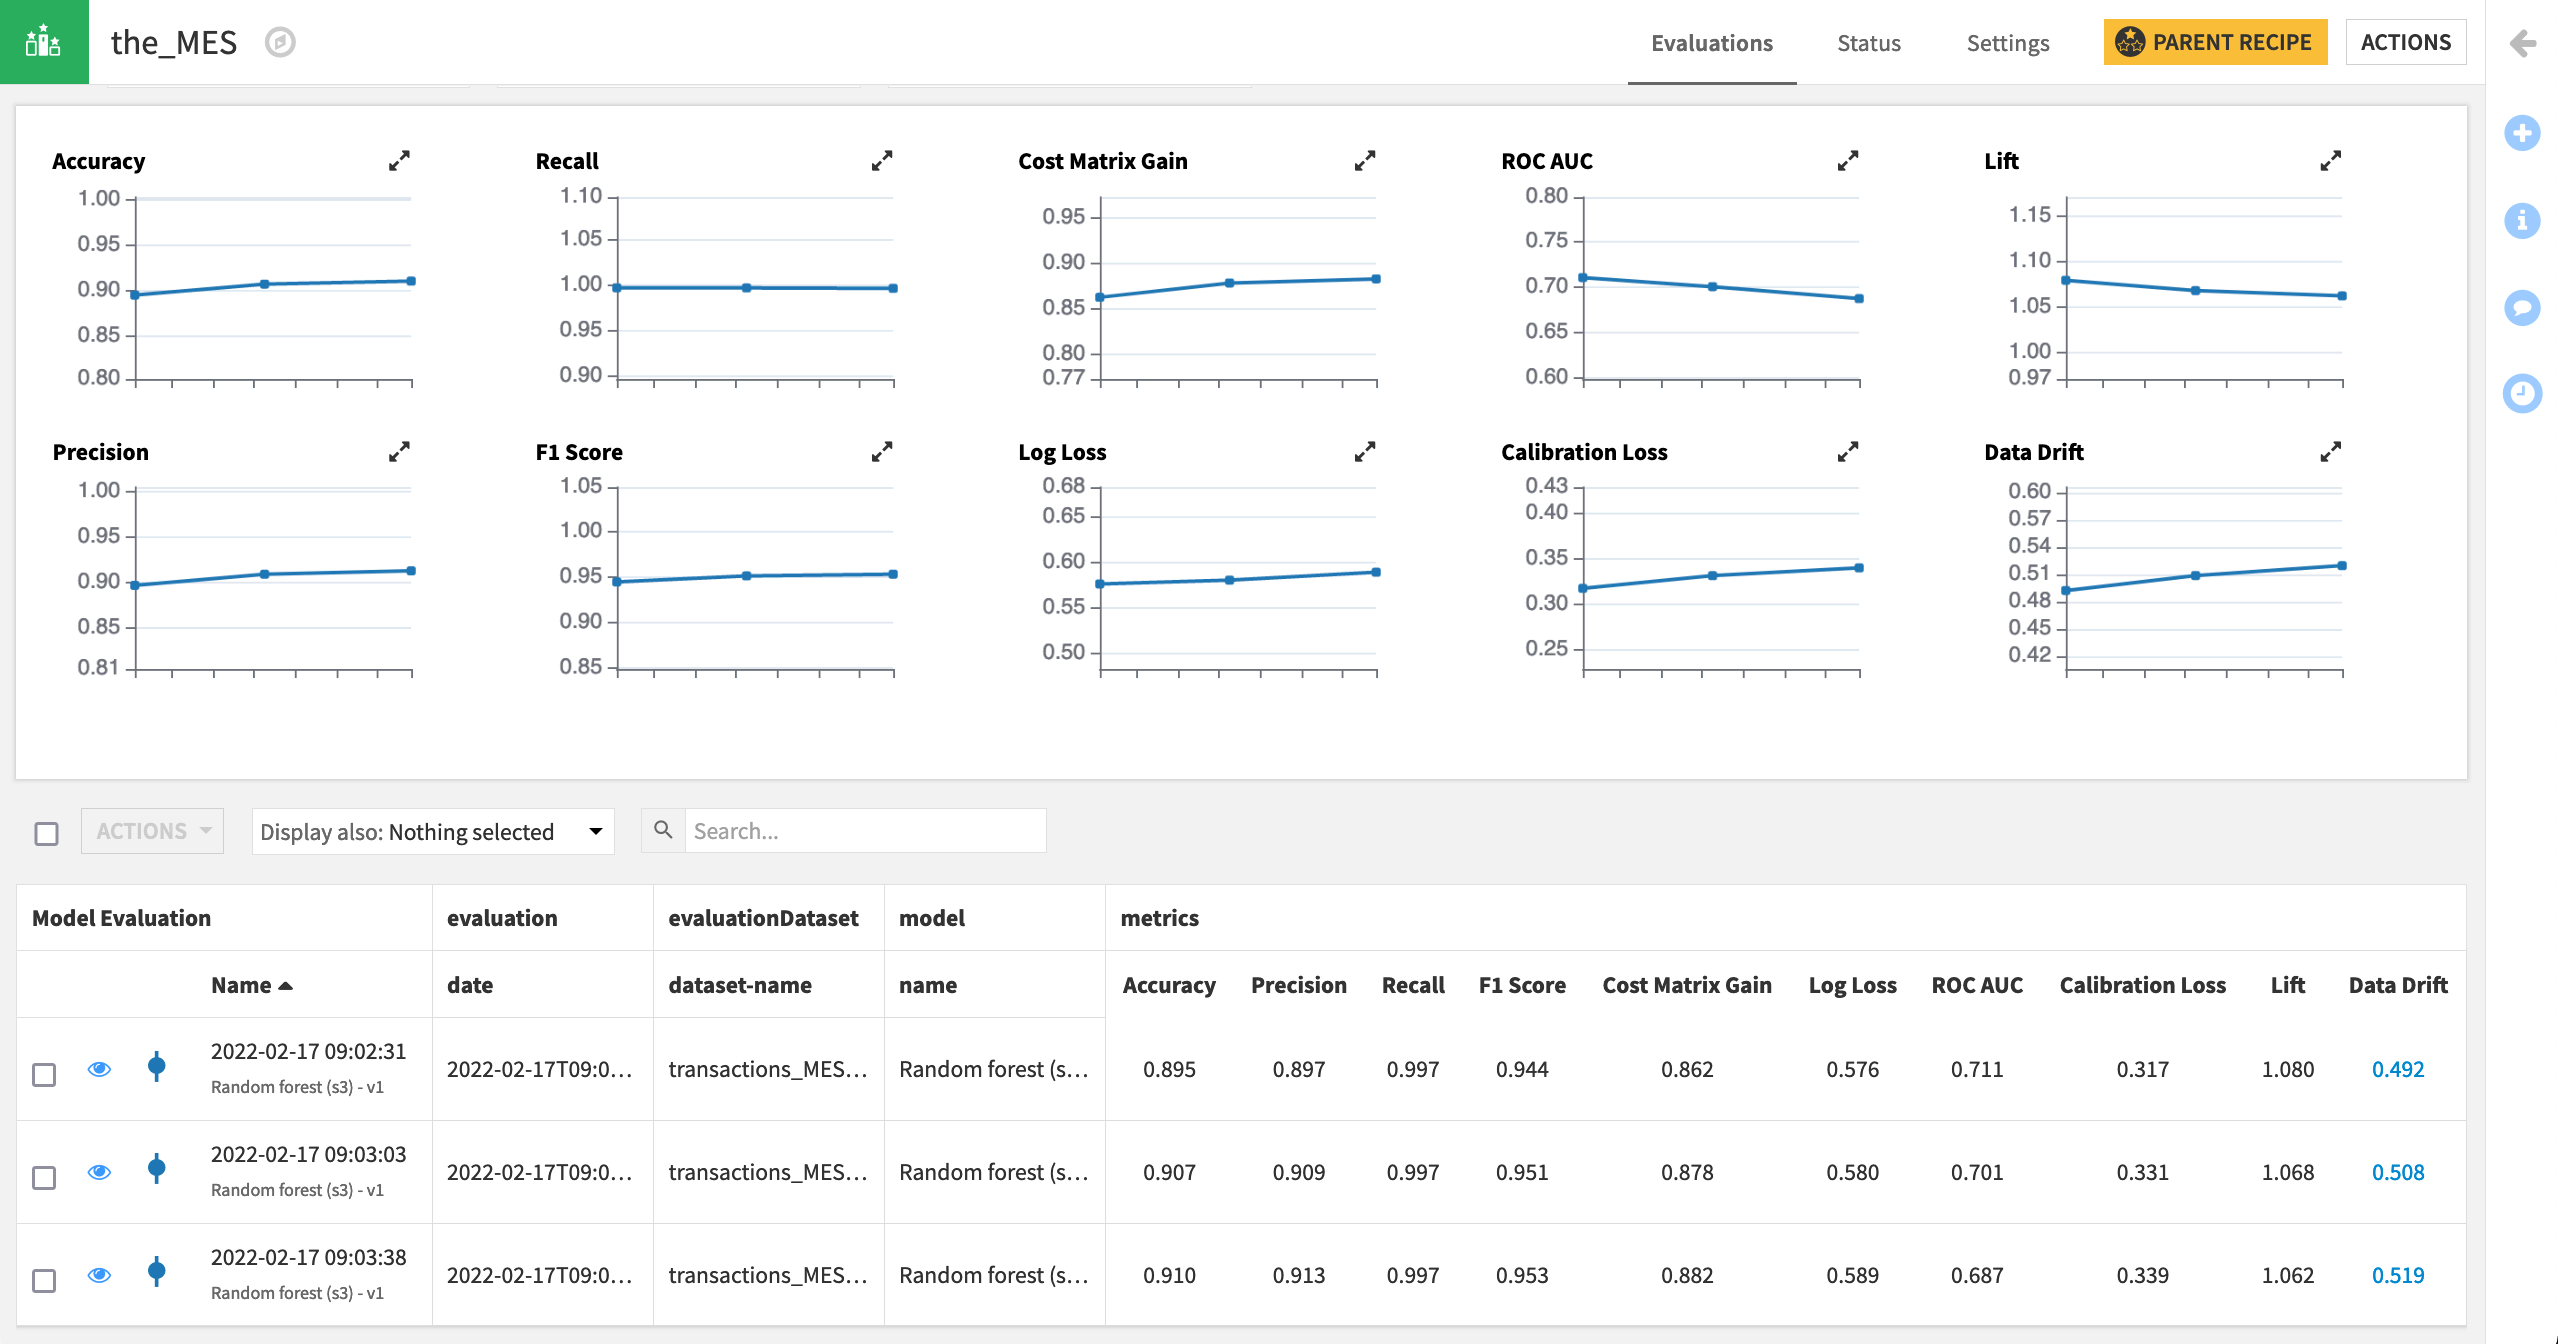
Interpreting these results is highly dependent on the specific use case and objectives. However, we can note what to look for.
Click on the value in the Name column to view the details of the last row of the model evaluation store (Q4).
The results appear very much like those in the Lab, with the addition of the “Drift Analysis” section.
Navigate to the Input data drift pane of the Drift Analysis section to explore the extent to which the most recent input data has drifted from the data used to train the model.
Click Compute.
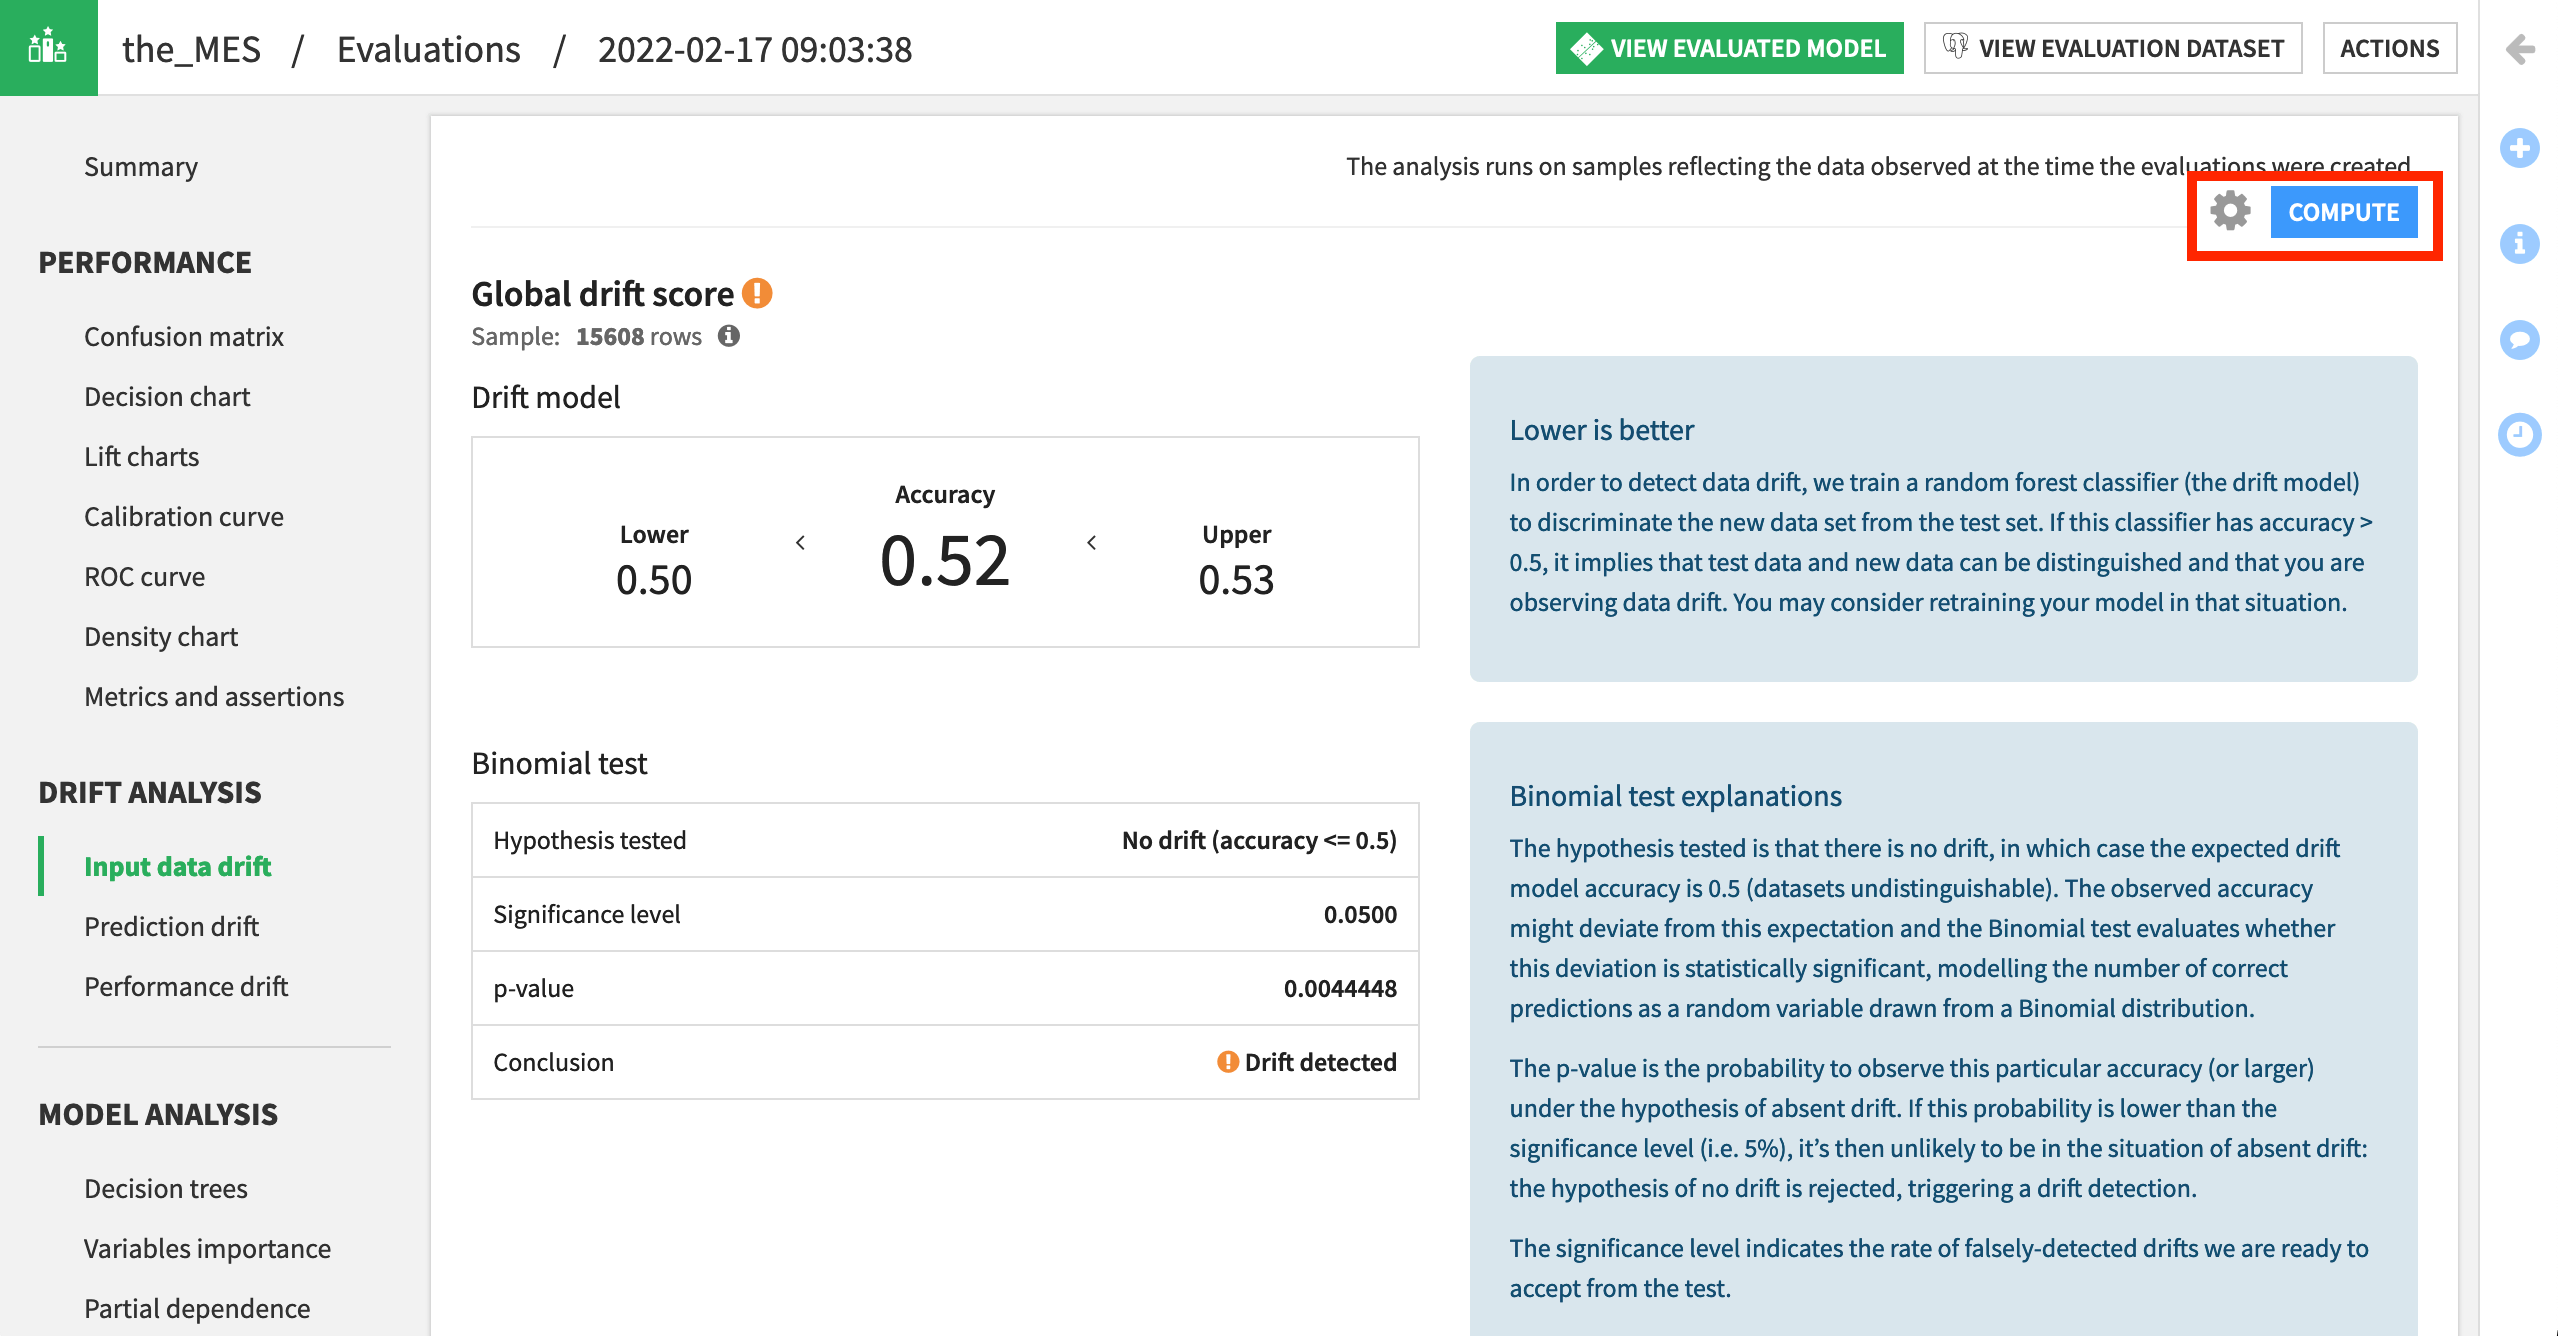
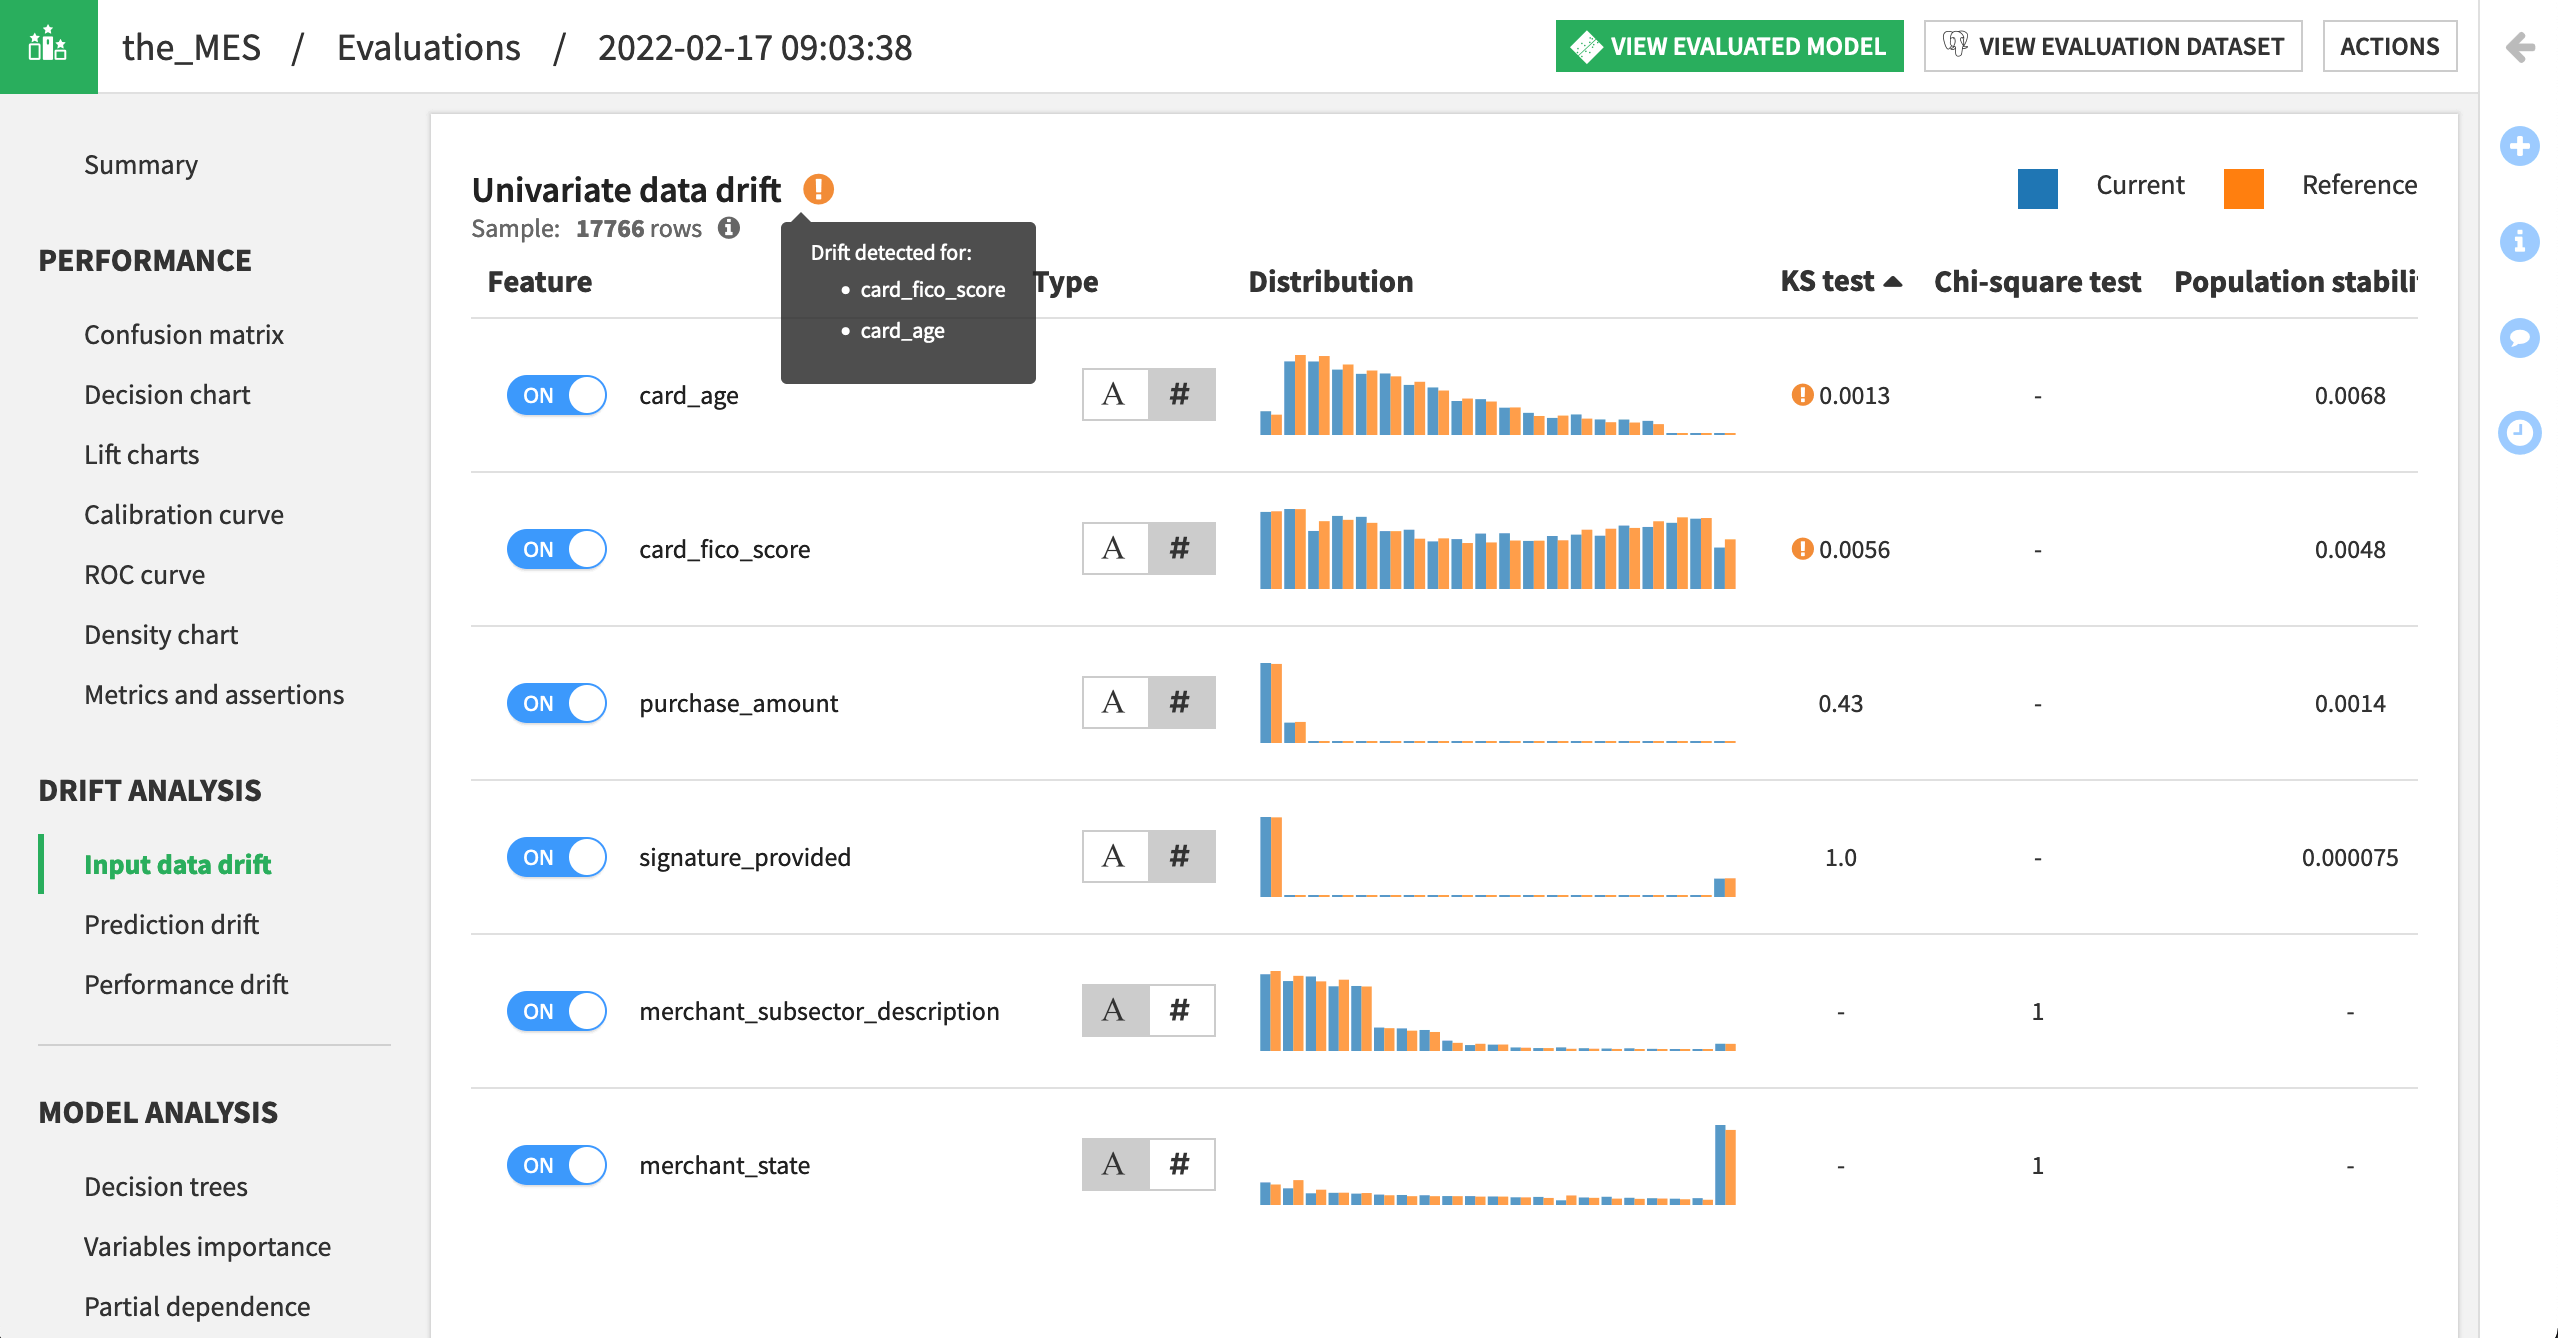
Scrolling down, we can see which features in particular have drifted. In this case (your results may differ slightly), card_age and card_fico_score for the Q4 data are significantly different from the Q1 reference data used to train the model.
Note
For more information on the model evaluation store, please refer to the product documentation or this how-to article.
Monitor a Model in Production with a Scenario
The results above perhaps indicate that the model needs to be retrained using the more recent data. However, making that decision is not our primary objective. Our objective is to access this kind of information automatically, while our project runs in production.
Luckily, you are already familiar with the necessary tools to achieve this objective: metrics, checks, scenarios, triggers, and reporters.
Add a Data Drift Metric and Check
We’ll start with creating the right set of metrics and checks to guide our scenario actions.
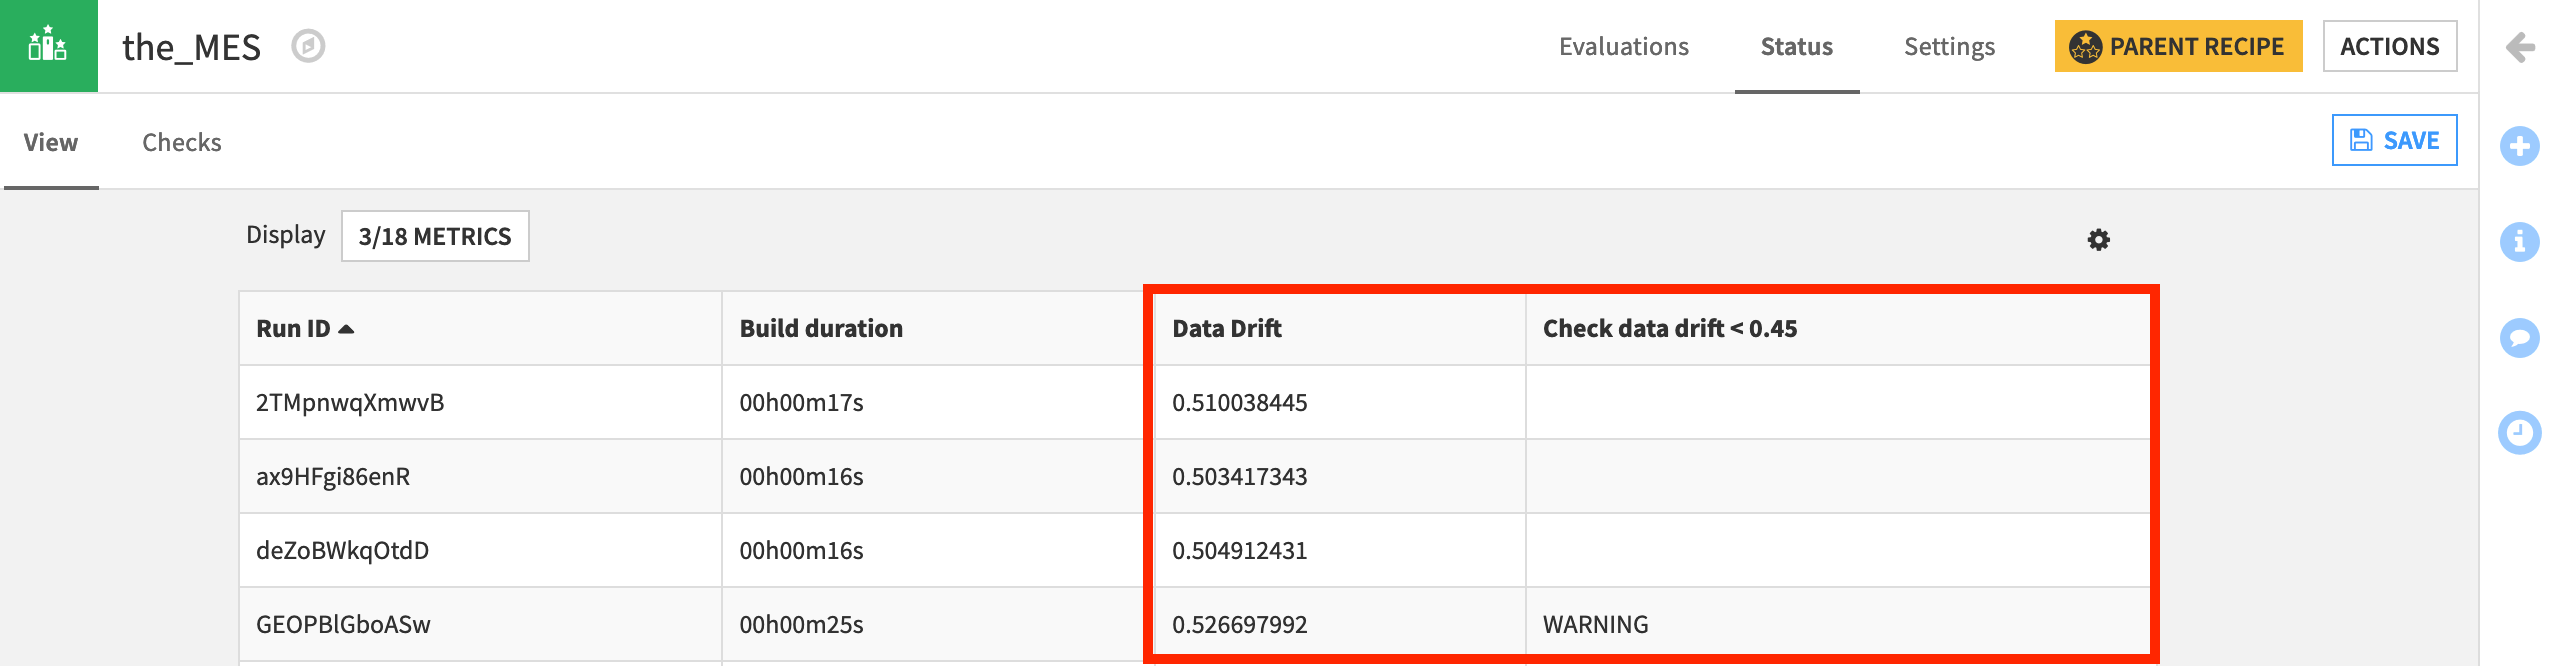
Navigate to the Status tab of the model evaluation store.
On the View subtab, add “Data Drift” as a displayed metric from the available options, and click Save.
Then navigate to the Status checks subtab within the Settings tab.
Click “Metric Value is in a Numeric Range”.
Create a check named
data drift < 0.45, that issues a warning (a soft maximum) if the data drift metric rises above 0.45.Click Check to confirm it returns a warning, and be sure to save it.
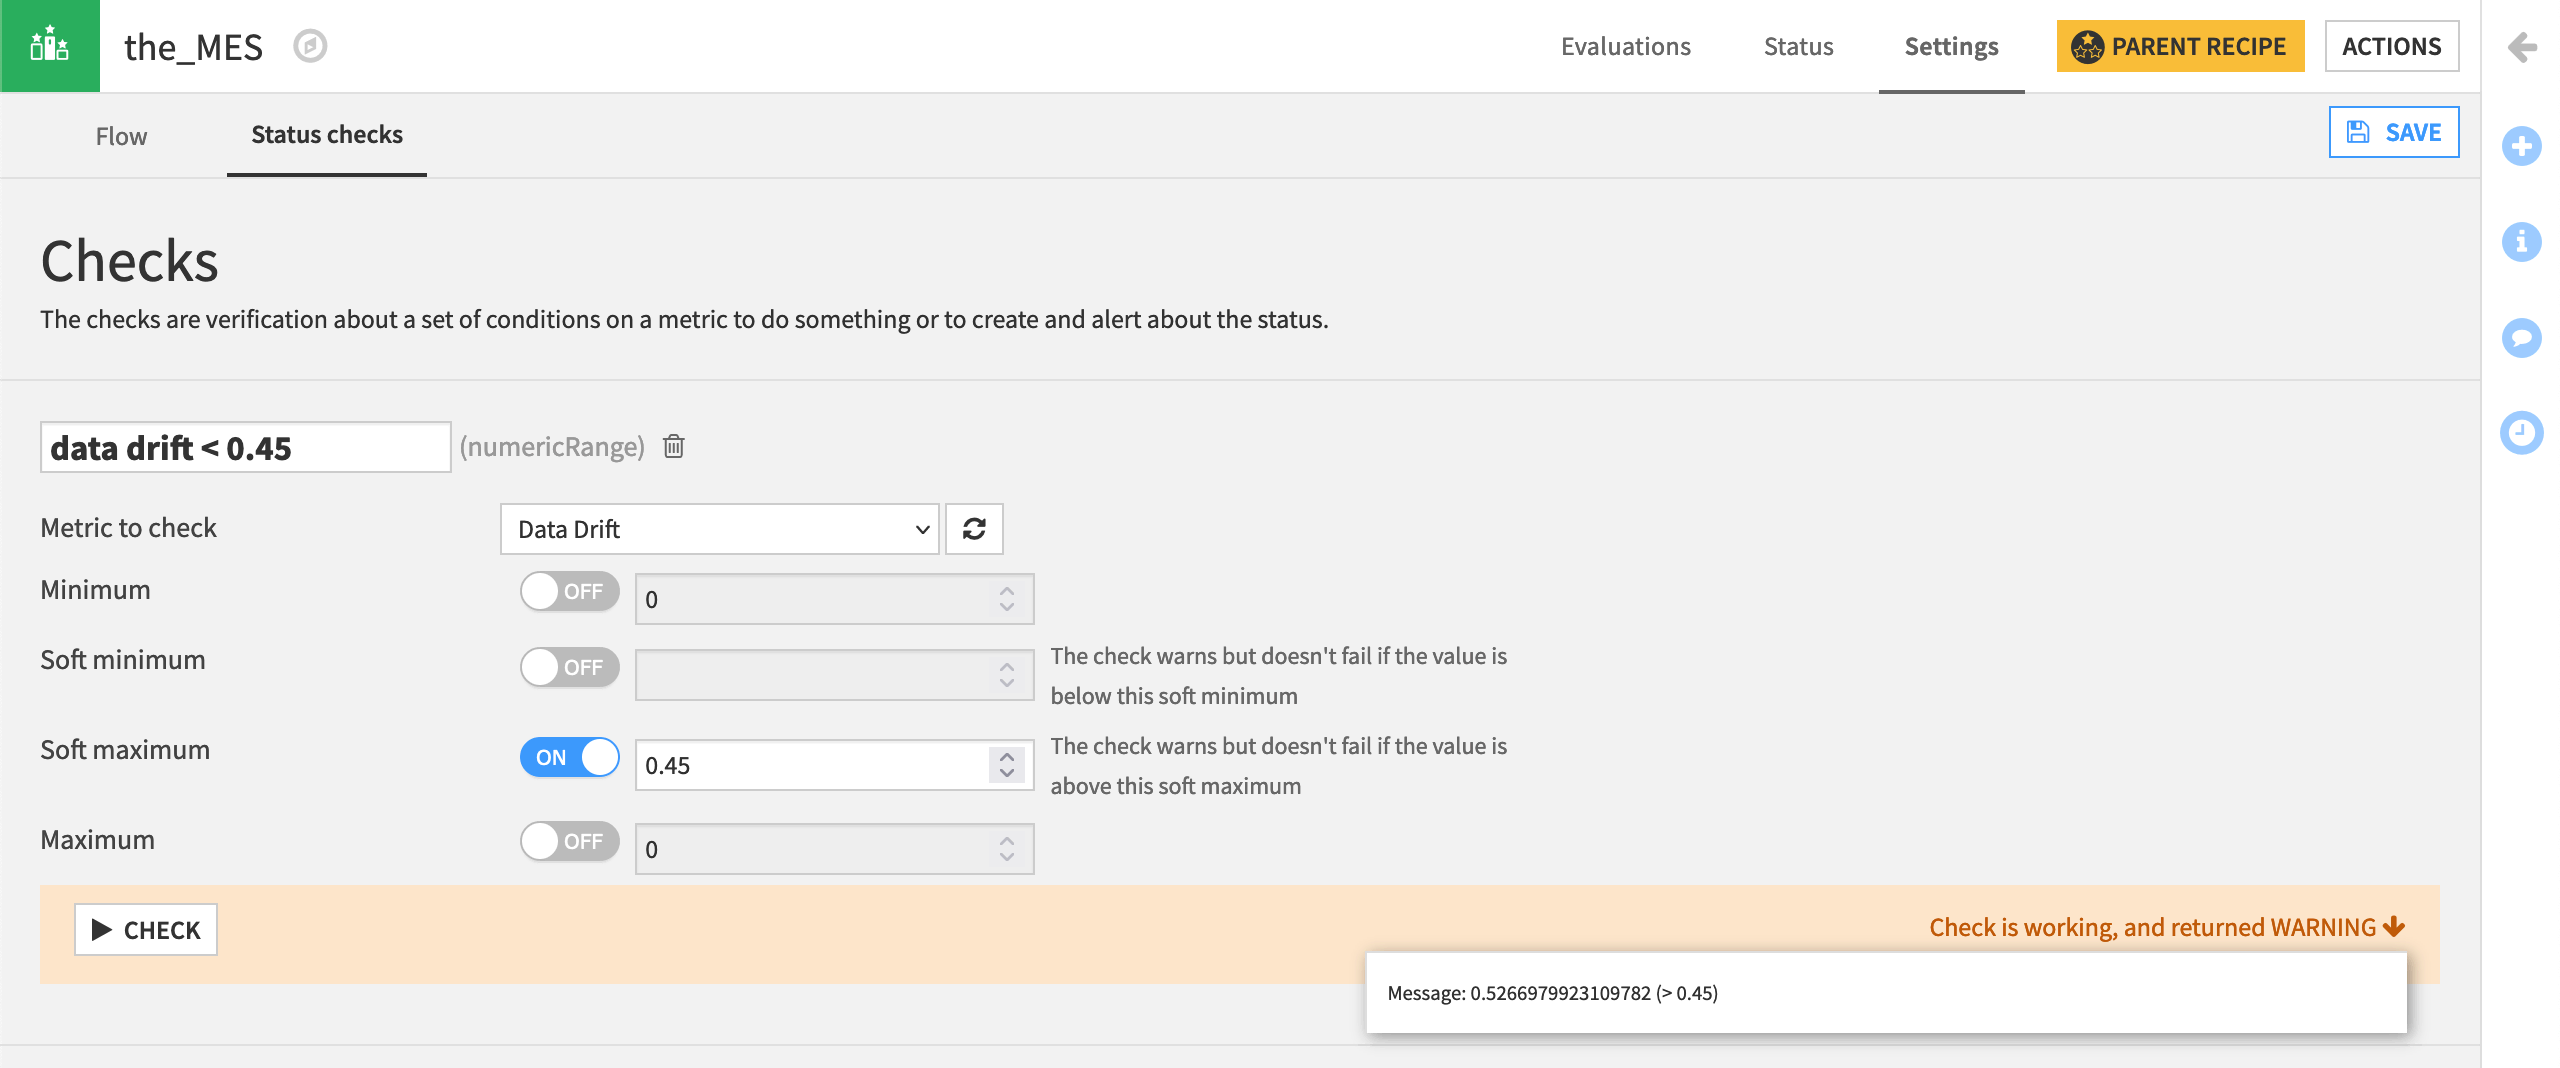
Note
The actual threshold value for “too much” data drift is highly specific to your use case. In this case, we chose a value knowing it would generate a warning for the purpose of demonstration.
Back in the Status tab, display the new check on both the View and Checks subtabs.
Create a Scenario to Monitor Data Drift
Now let’s create a basic scenario that will run the check on data drift after building the model evaluation store.
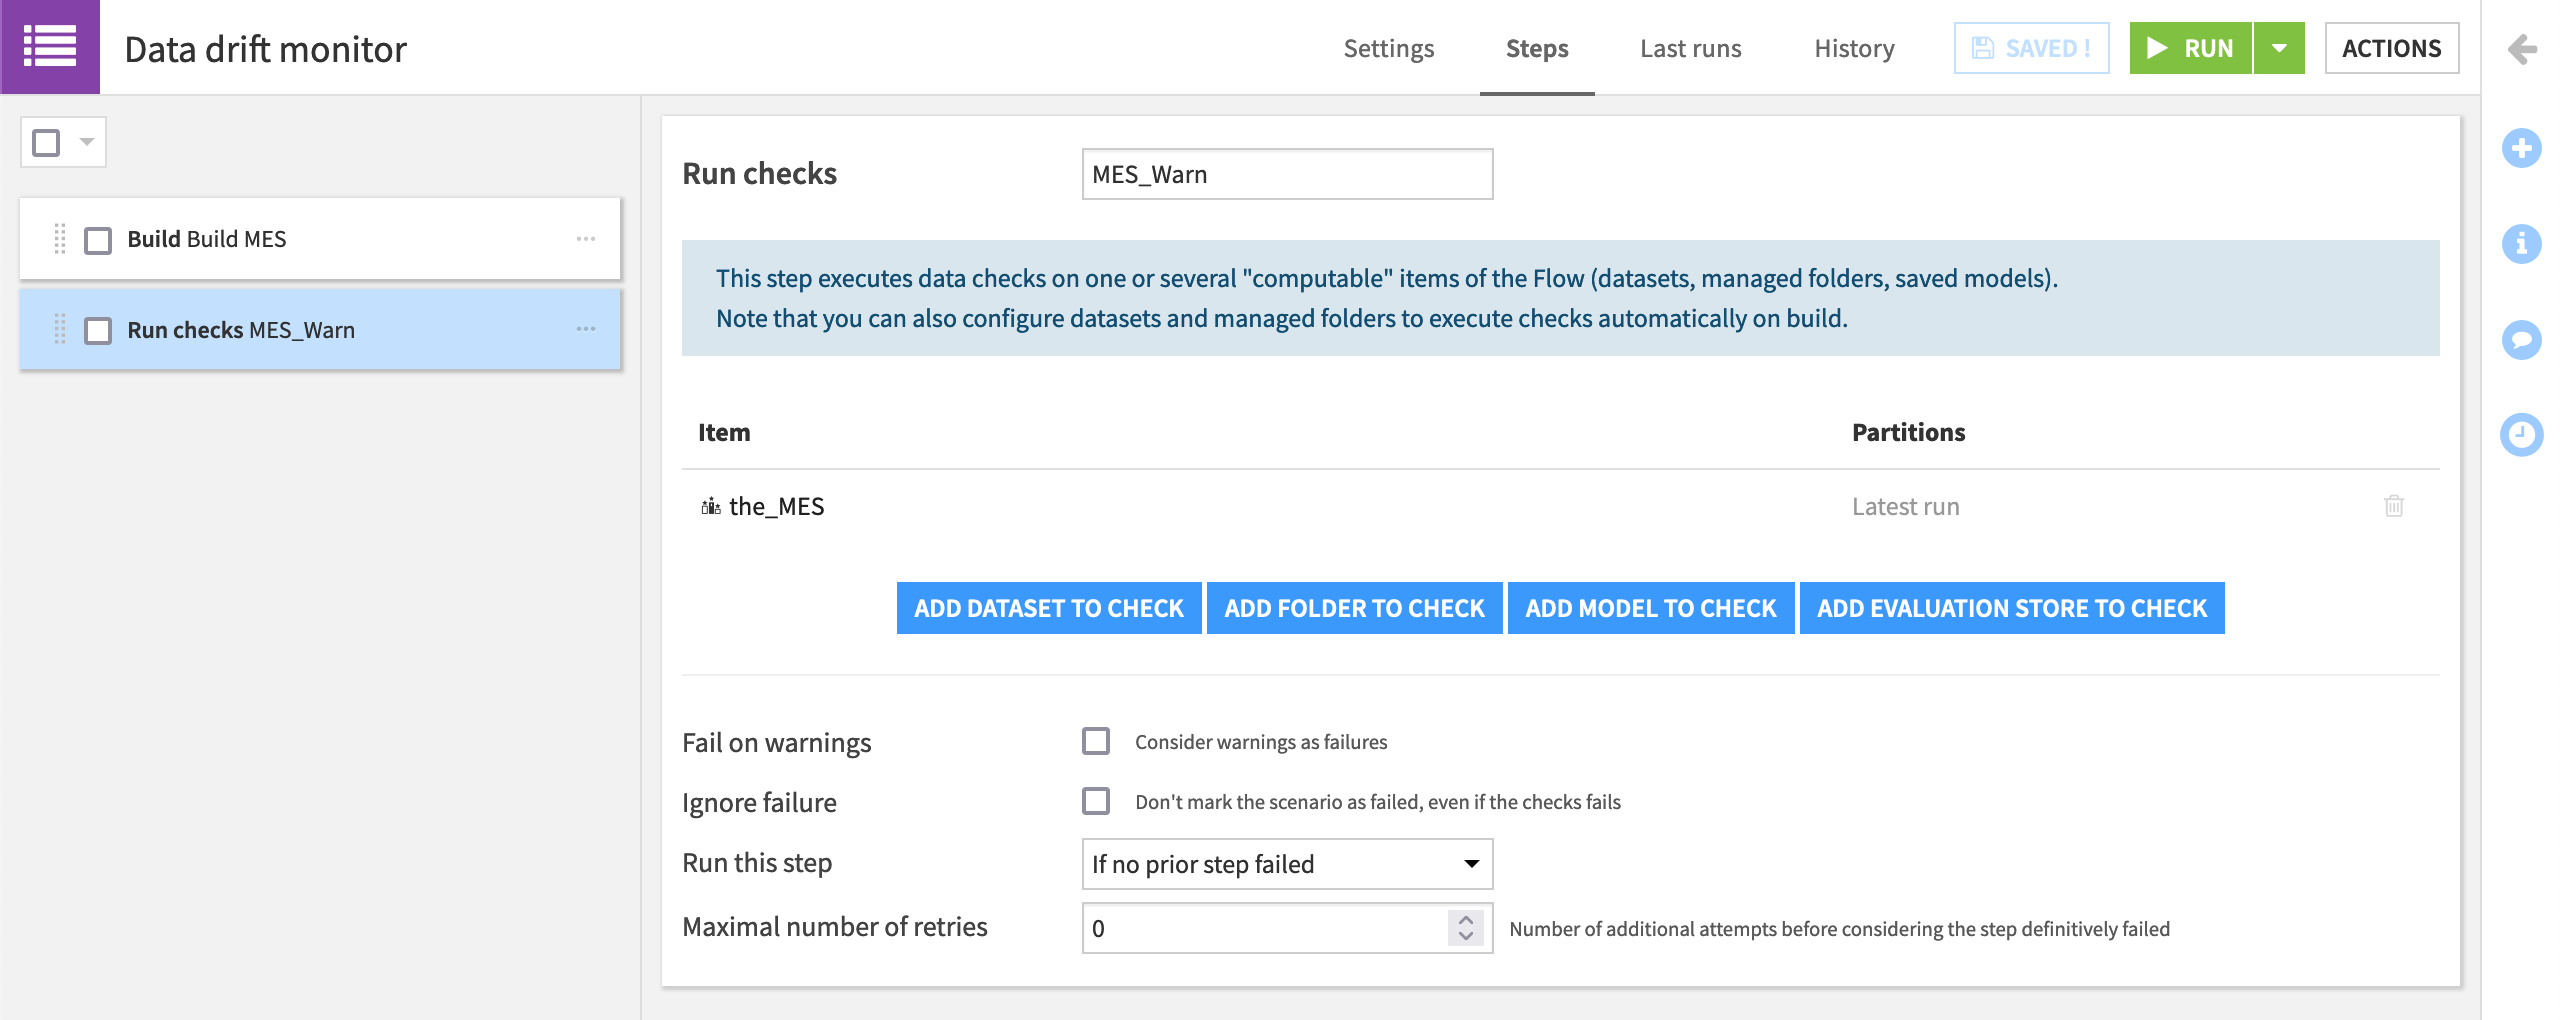
From the Scenarios page, create a new step-based scenario named
Data drift monitor.On the Steps tab, add a “Build / Train” step with the_MES as the evaluation store to build. Name the step
Build MES.Then add a “Run checks” step that runs checks on the_MES. Name the step
MES_Warn.
Add a Reporter to Send Data Drift Alerts
Now that we have the essential steps, we can add the reporter to alert us whenever the check for data drift returns a warning.
Warning
If you don’t have a Mail reporter configured, you can skip this step or set one up now.
Navigate to the Settings tab of the “Data drift monitor” scenario.
We’ll manually run this scenario so there is no need to set a trigger in this case.
Click Add Reporter > Mail.
Name it
Data drift warning.
Instead of always running at the end of a scenario run, let’s only send an email if the step for the data drift check returns a warning. Otherwise, we don’t need the alert.
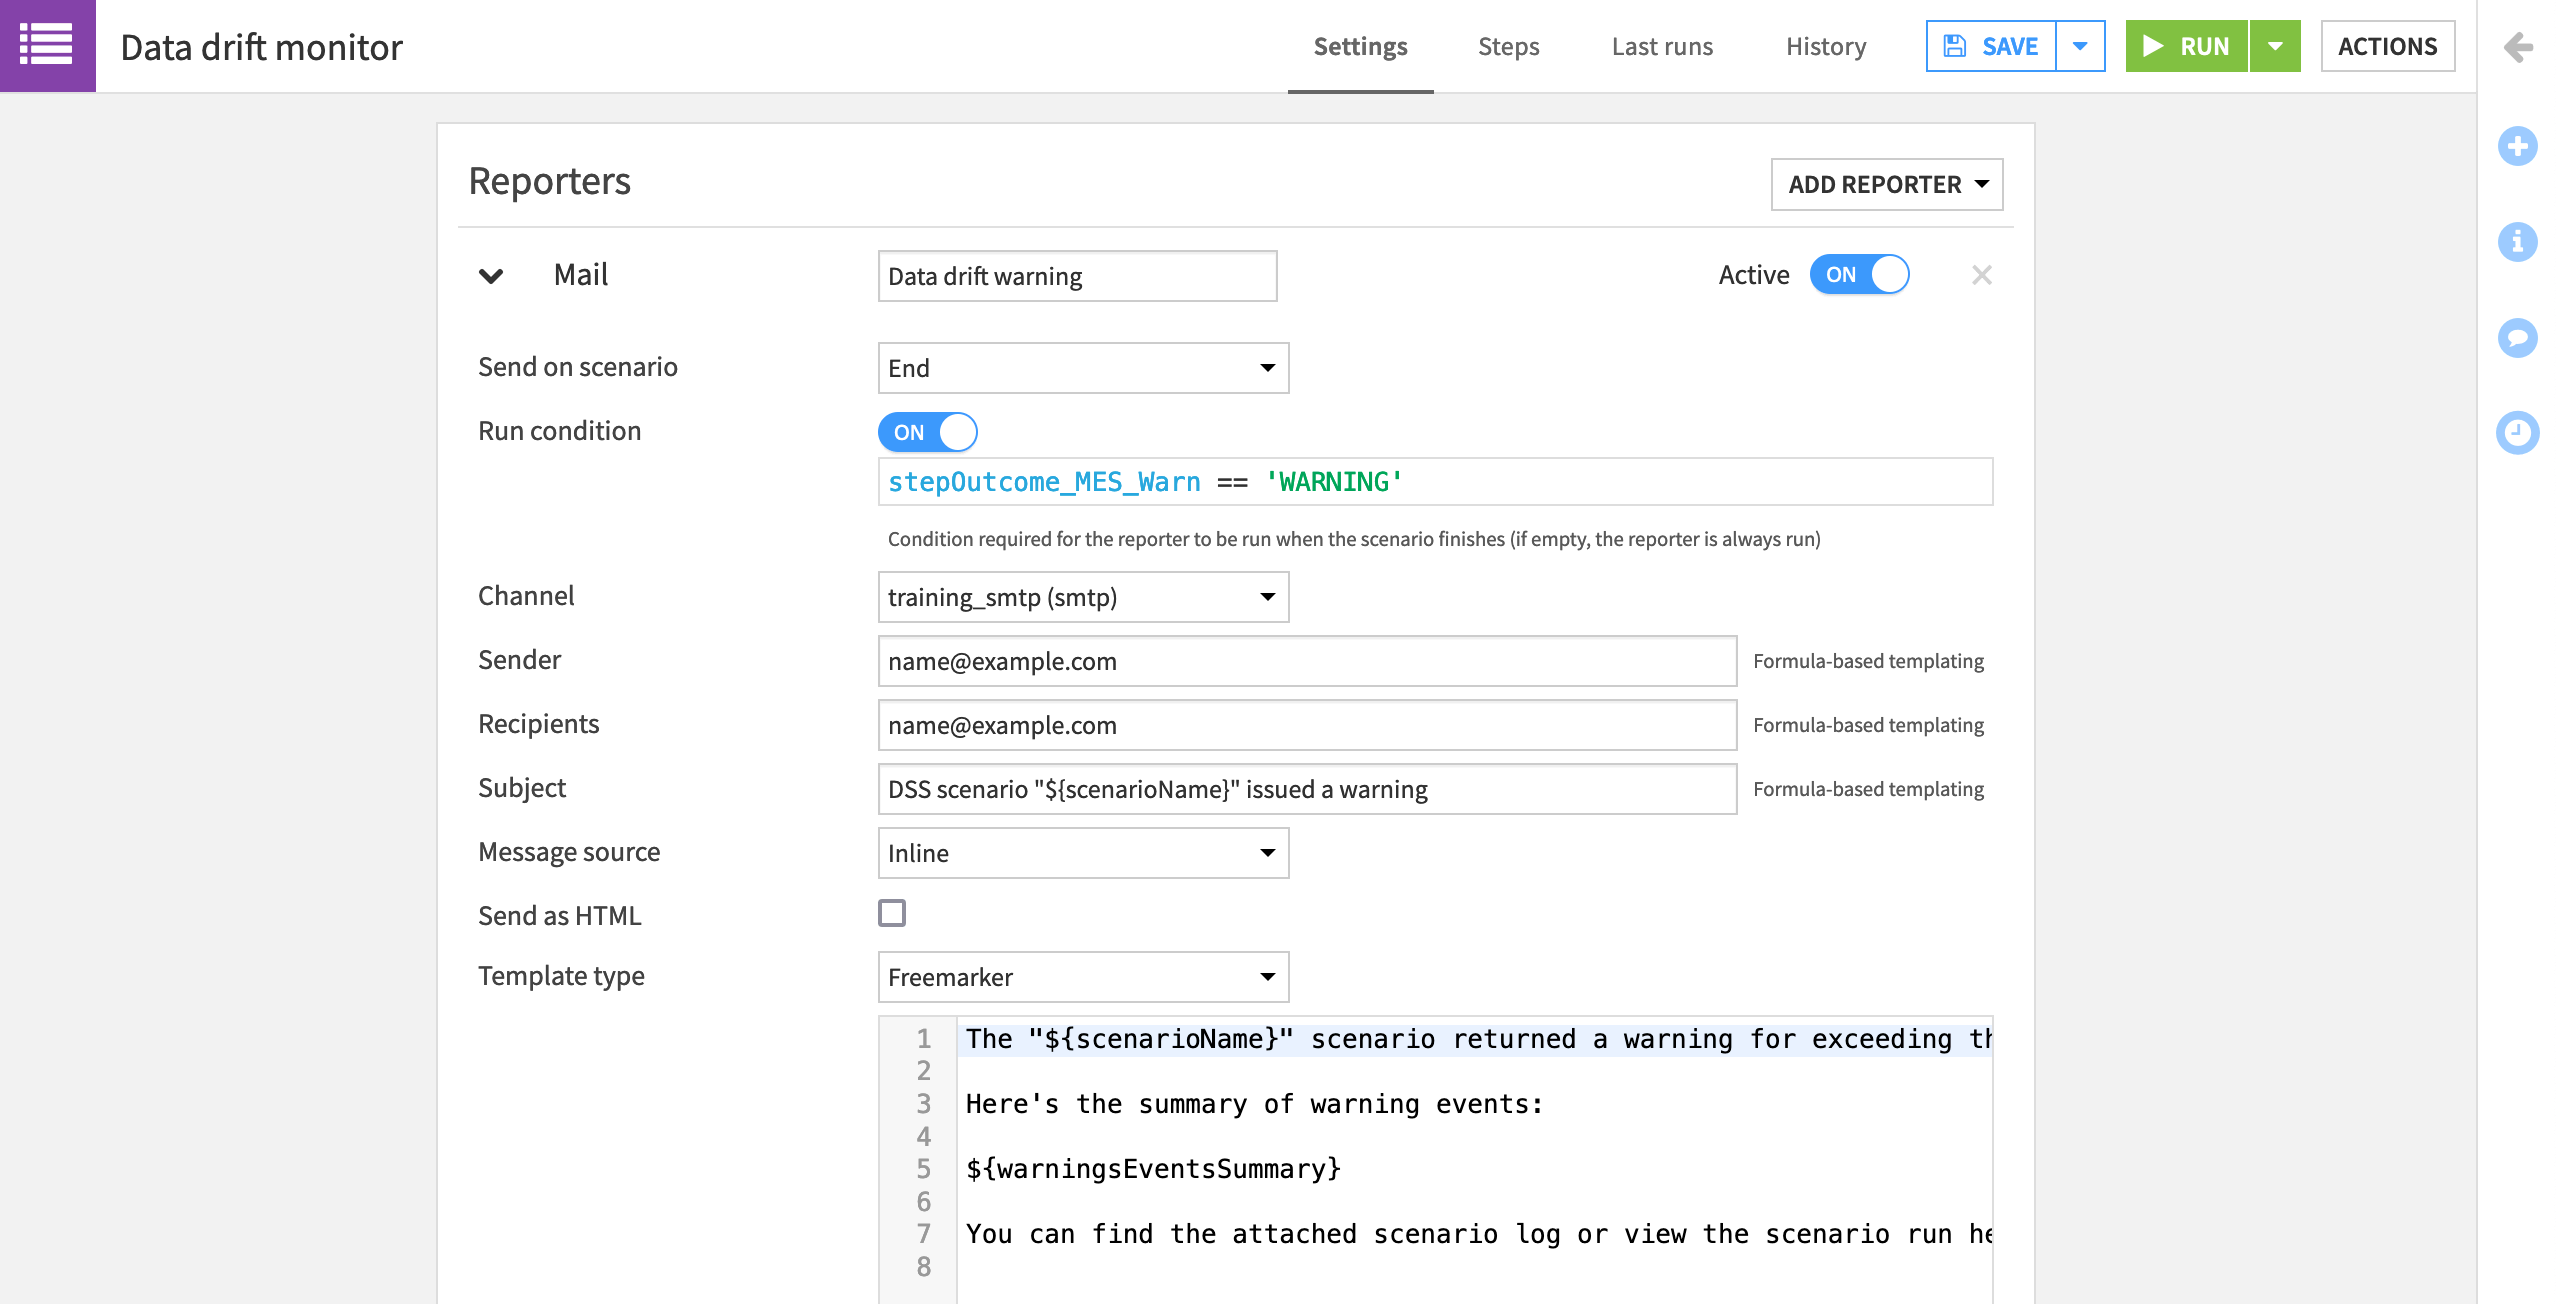
On the scenario’s end, set the “Run condition” to
stepOutcome_MES_Warn == 'WARNING'.Add an available SMTP channel, and your own email as the sender and recipient.
Note
If you named the “MES_Warn” step something else, be sure to adjust the run condition accordingly. For more details on step-based execution of scenarios, such as running steps conditionally, please refer to the product documentation.
Instead of the default template, let’s use a simple custom message.
For the subject, add
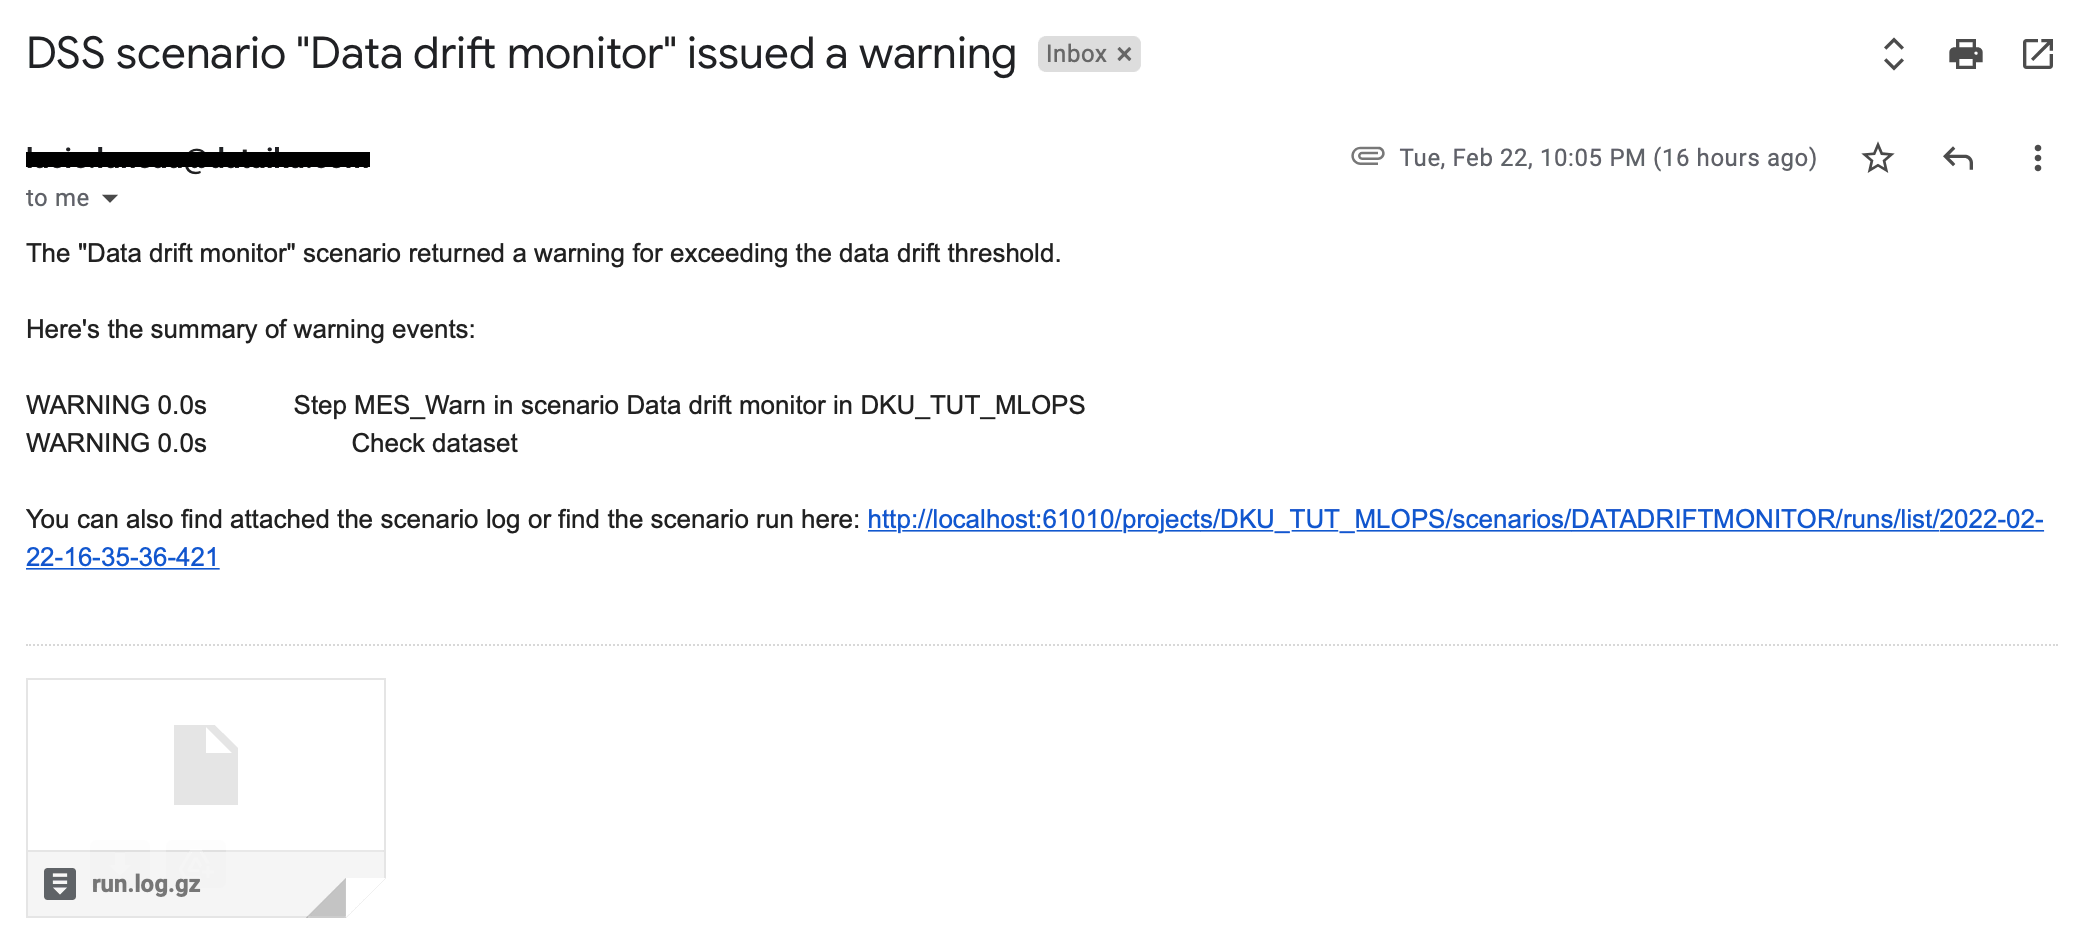
DSS scenario "${scenarioName}" issued a warning.Change the message source to Inline, and add a message like the one below:
The “${scenarioName}” scenario returned a warning for exceeding the data drift threshold.
Here’s the summary of warning events:
${warningsEventsSummary}
You can find the attached scenario log or view the scenario run here: ${scenarioRunURL}
Add the Scenario log as an attachment to the email.
Be sure the trigger is set to Active, and then manually Run the scenario to confirm the email is received.
Deploy to Production
We now have a scenario that sends an email alert if data drift has increased beyond an acceptable threshold. However, it is only present on the Design node. (Recall that we always introduce changes in the development environment, and then push a new bundle to the production environment).
We need to deploy a new bundle so this scenario can run on the Automation node. The process for creating a bundle, which includes the “Data drift monitor” scenario, and pushing it to the Automation node is no different than before.
Try pushing a new bundle to the Automation node on your own!
Batch deployment steps are here for review.
Create a new bundle with the same configuration found in the Batch Deployment tutorial (the three initial uploaded datasets and the saved model included).
Name it
v3, and pasteadds scenario for monitoring data driftin the release notes.From the Bundles page of the project on the Design node, select the newly-created bundle.
Click Publish on Depoyer, and then again confirm the same.
From the bundle details page on the Design node, click Open in Deployer.
On the Deployer, find the new bundle, and, click Deploy.
Click OK to “Update” the existing bundle.
Click OK to confirm the deployment you want to edit.
Click the green Update button to activate the new bundle.
Warning
If starting from a new project, instead of updating the existing deployment, you’ll be creating a new one, and so will need to choose an infrastructure.
Note
To review the process for moving a bundle from the Design to the Automation node, please refer to the Batch Deployment concept article or tutorial.
Run the Scenario
Once the new bundle is deployed in our production environment, let’s manually trigger the scenario.
Open the project on the Automation node, and confirm the bundle including the “Data drift monitor” scenario is present.
Manually trigger that scenario.
When the scenario has run, check your email for the reporter email including the custom message and scenario log.
Warning
If you receive an error about a missing “scenarioRunURL”, your instance administrator needs to provide a DSS URL from “Administration > Settings > Notifications & Integrations”.
What’s Next?
Congratulations! You’ve created an automatic alert to unacceptable data drift in a project running in a production environment.
Although we’ve used many scenarios thus far, creating and deploying bundles has been a manual process. Depending on the use case though and the level of MLOps sophistication in your organization, it doesn’t necessarily have to be.
In the next tutorial, you’ll see how to create a scenario that automatically creates a new bundle and updates an existing deployment!