Enriching Web Logs
Logs can be difficult and time-consuming to parse. Even for standardized formats, such as Apache log files, one often needs to code several regular expressions to be able to extract all the information needed.
Several processors in Dataiku DSS simplify this process down to a few clicks.
This brief tutorial demonstrates the how to use visual processors, such as Resolve GeoIP, Classify User-Agent, and Split URL, to quickly parse and enrich web log data.
Importing the Data
As a toy example, we provide this randomly generated dataset.
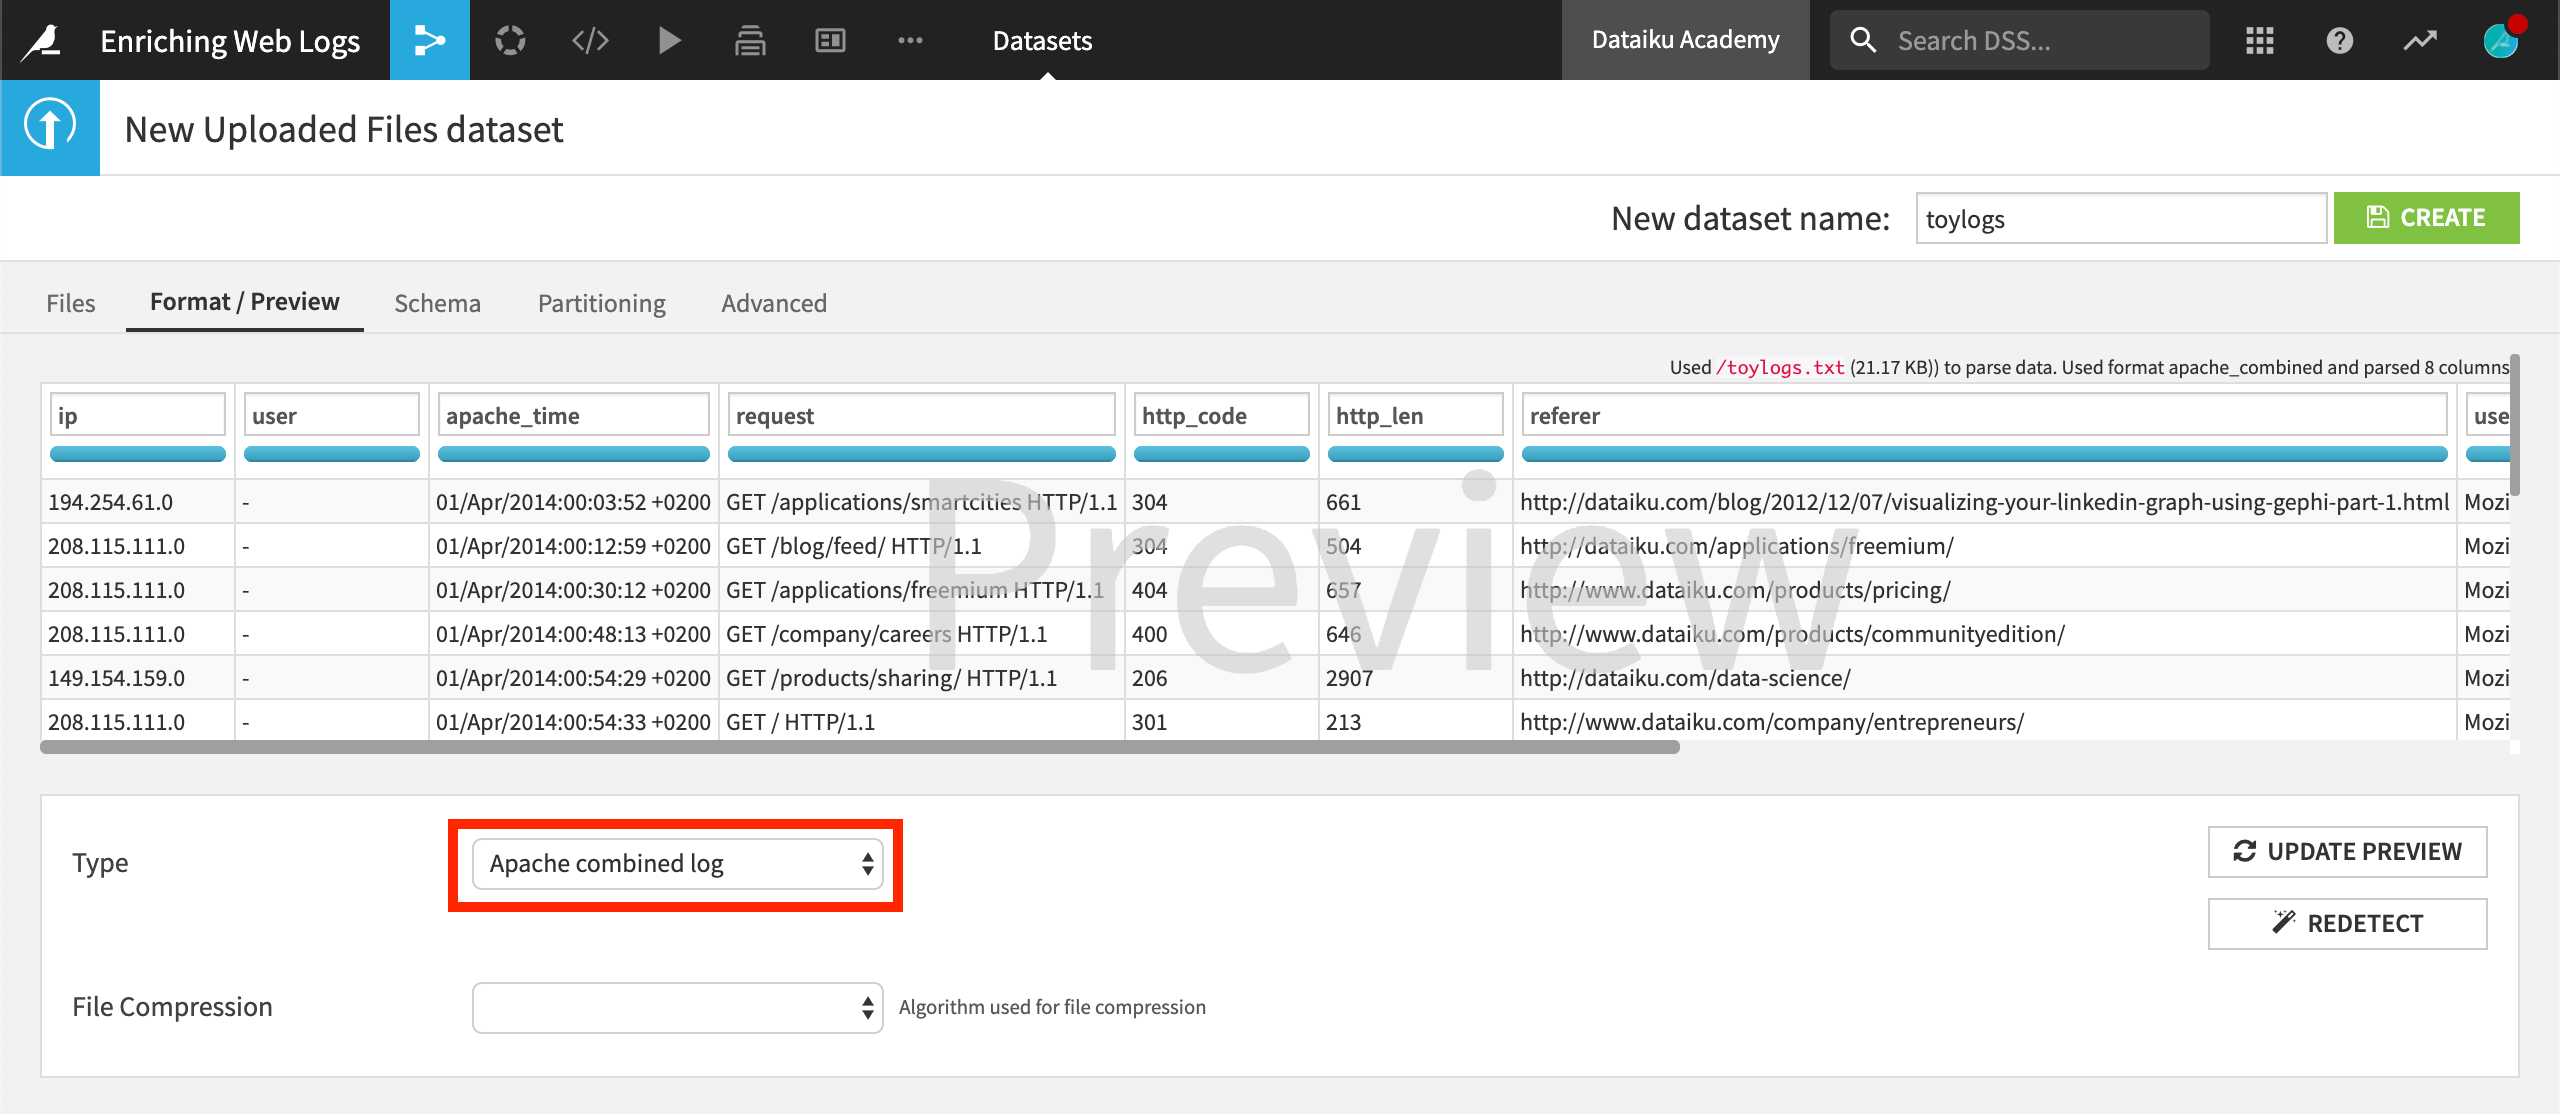
When importing the data into a new project, on the Preview tab, you can see that DSS automatically detects the format “Apache combined log” and performs the log parsing on your behalf.
The common fields are retrieved as columns: the ip address, the user (not available in this example), the timestamp, the requested url, the request status code , the size of the object returned, the referer (from where the user made the request), and the user agent (device used by the user).
GeoIP Enrichment
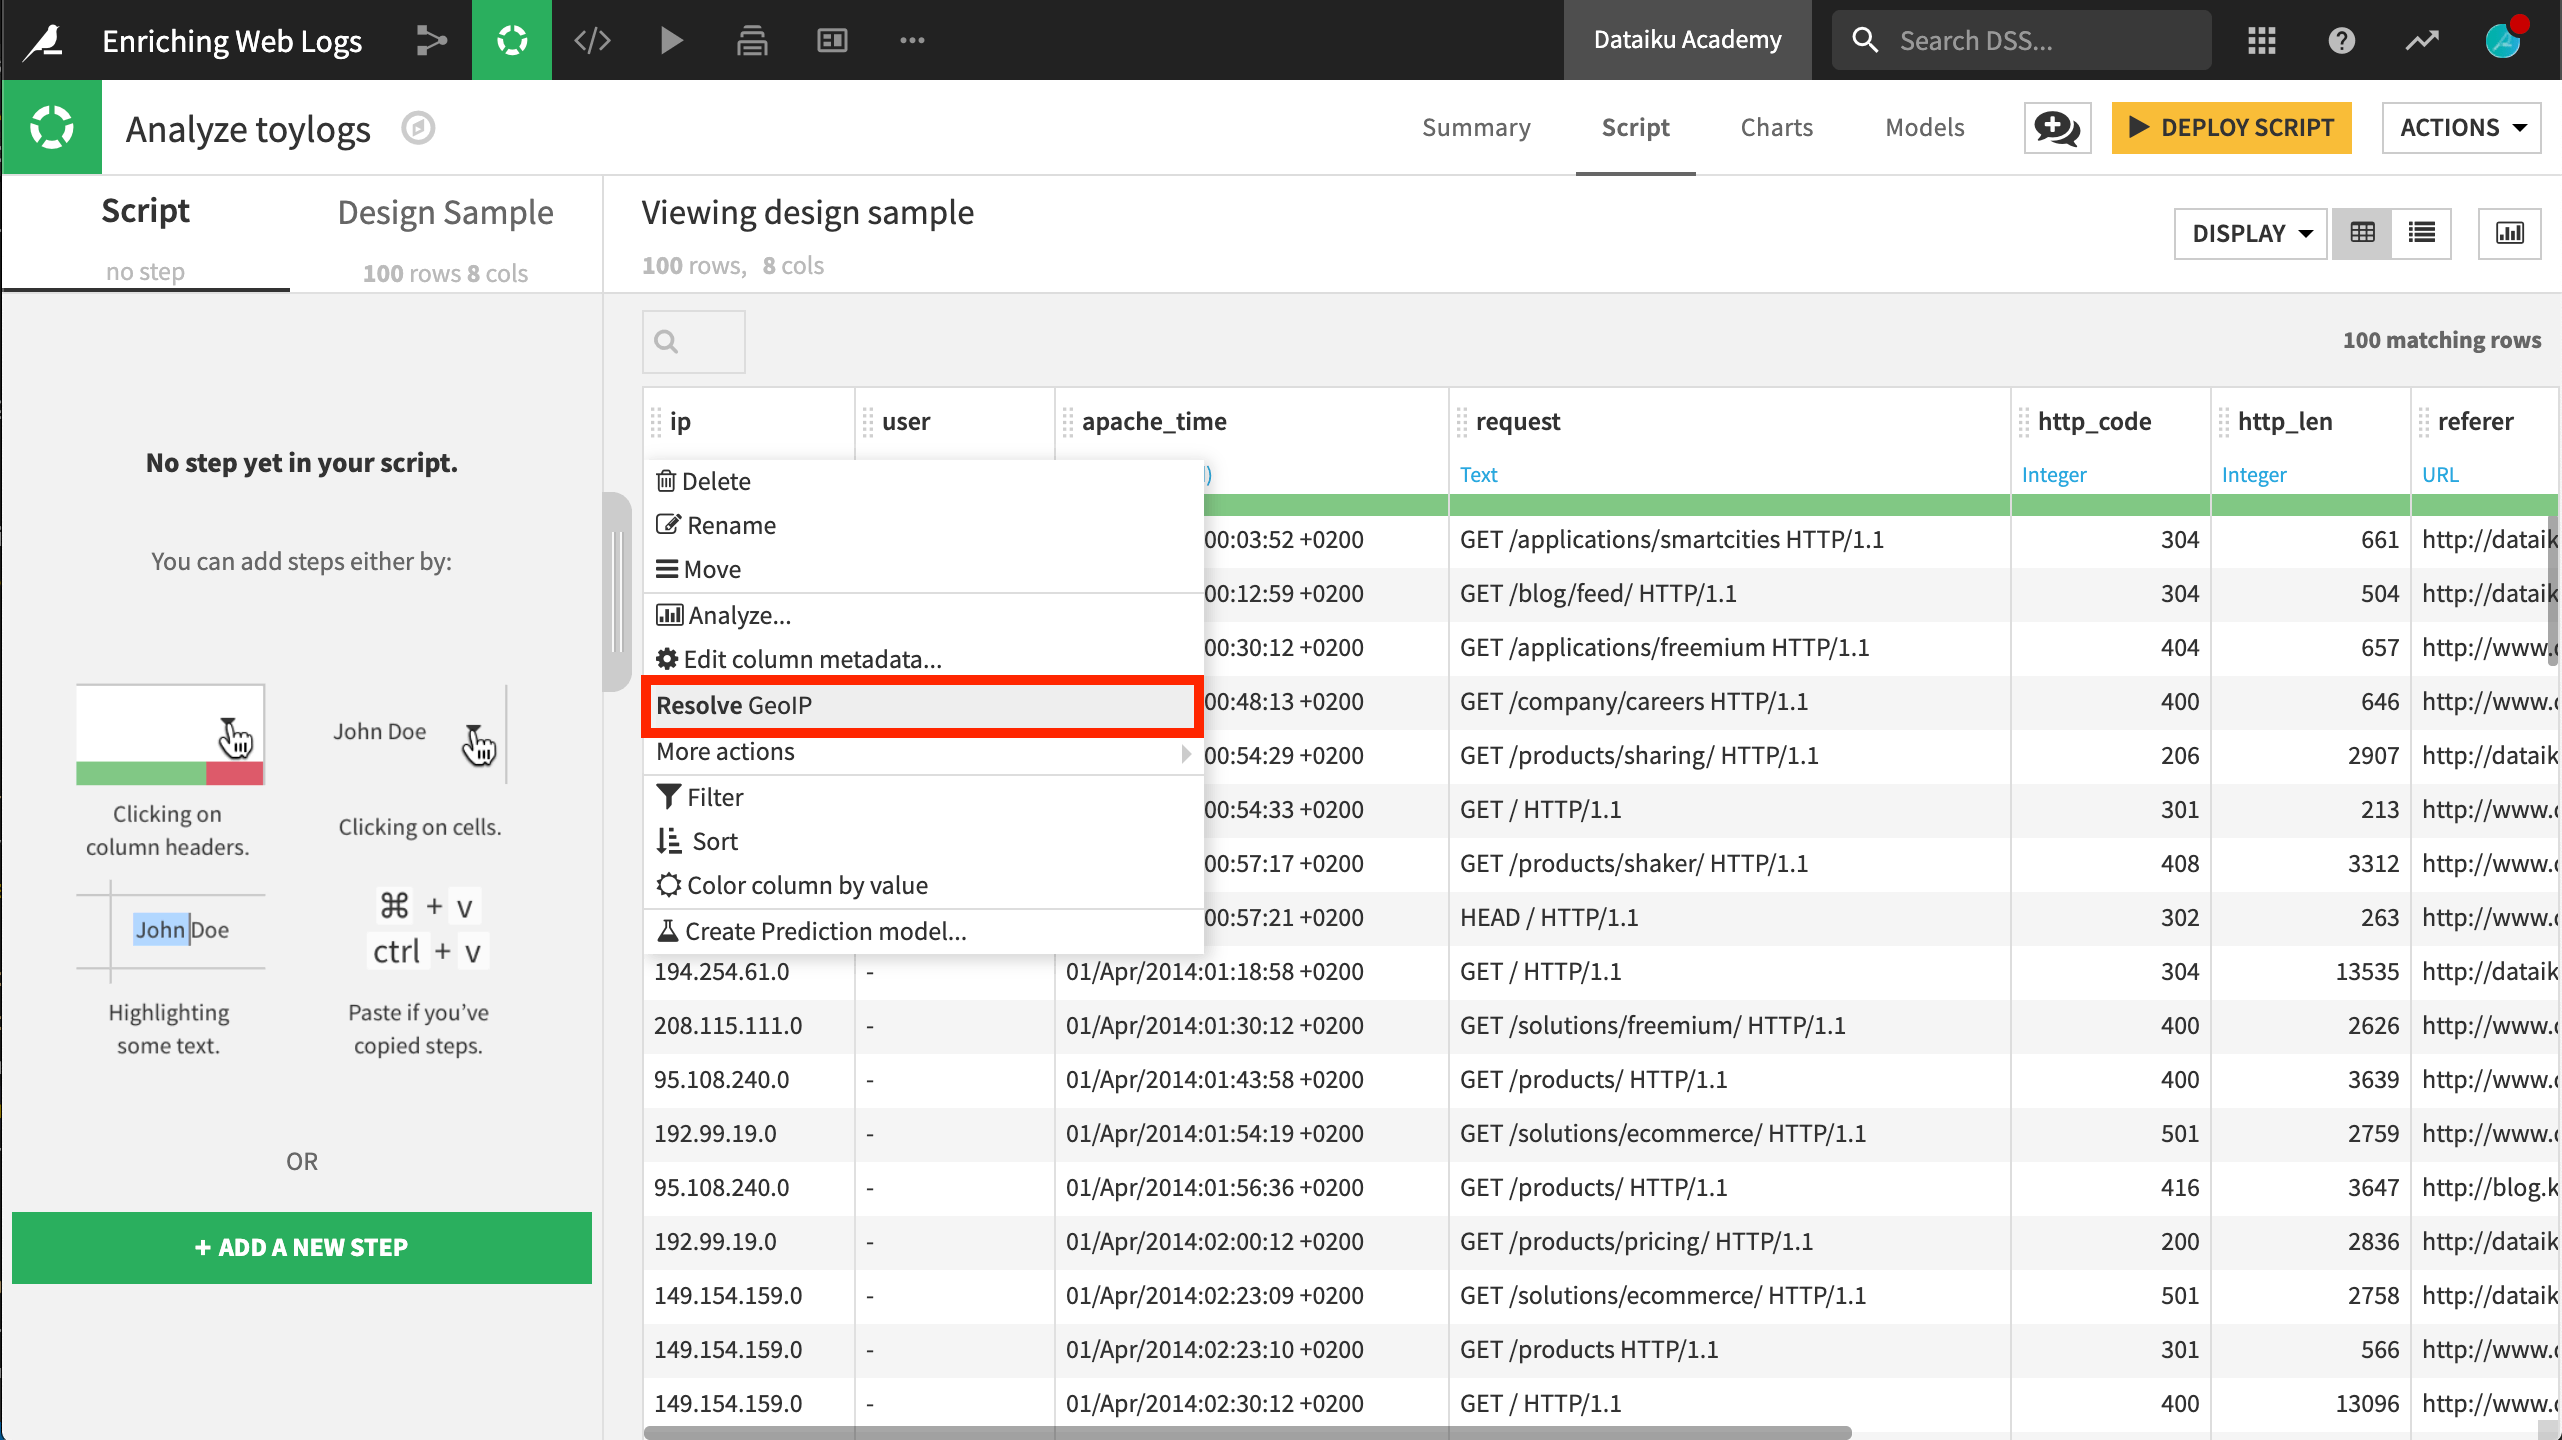
Create the dataset and a start a new visual analysis in the Lab. Alternatively, you could create a Prepare recipe.
Let’s first extract geographic information from the IP address. To do so, click on the ip column and select Resolve GeoIP.
This processor extracts a variety of geographic fields. In this case, extract only country and GeoPoint.
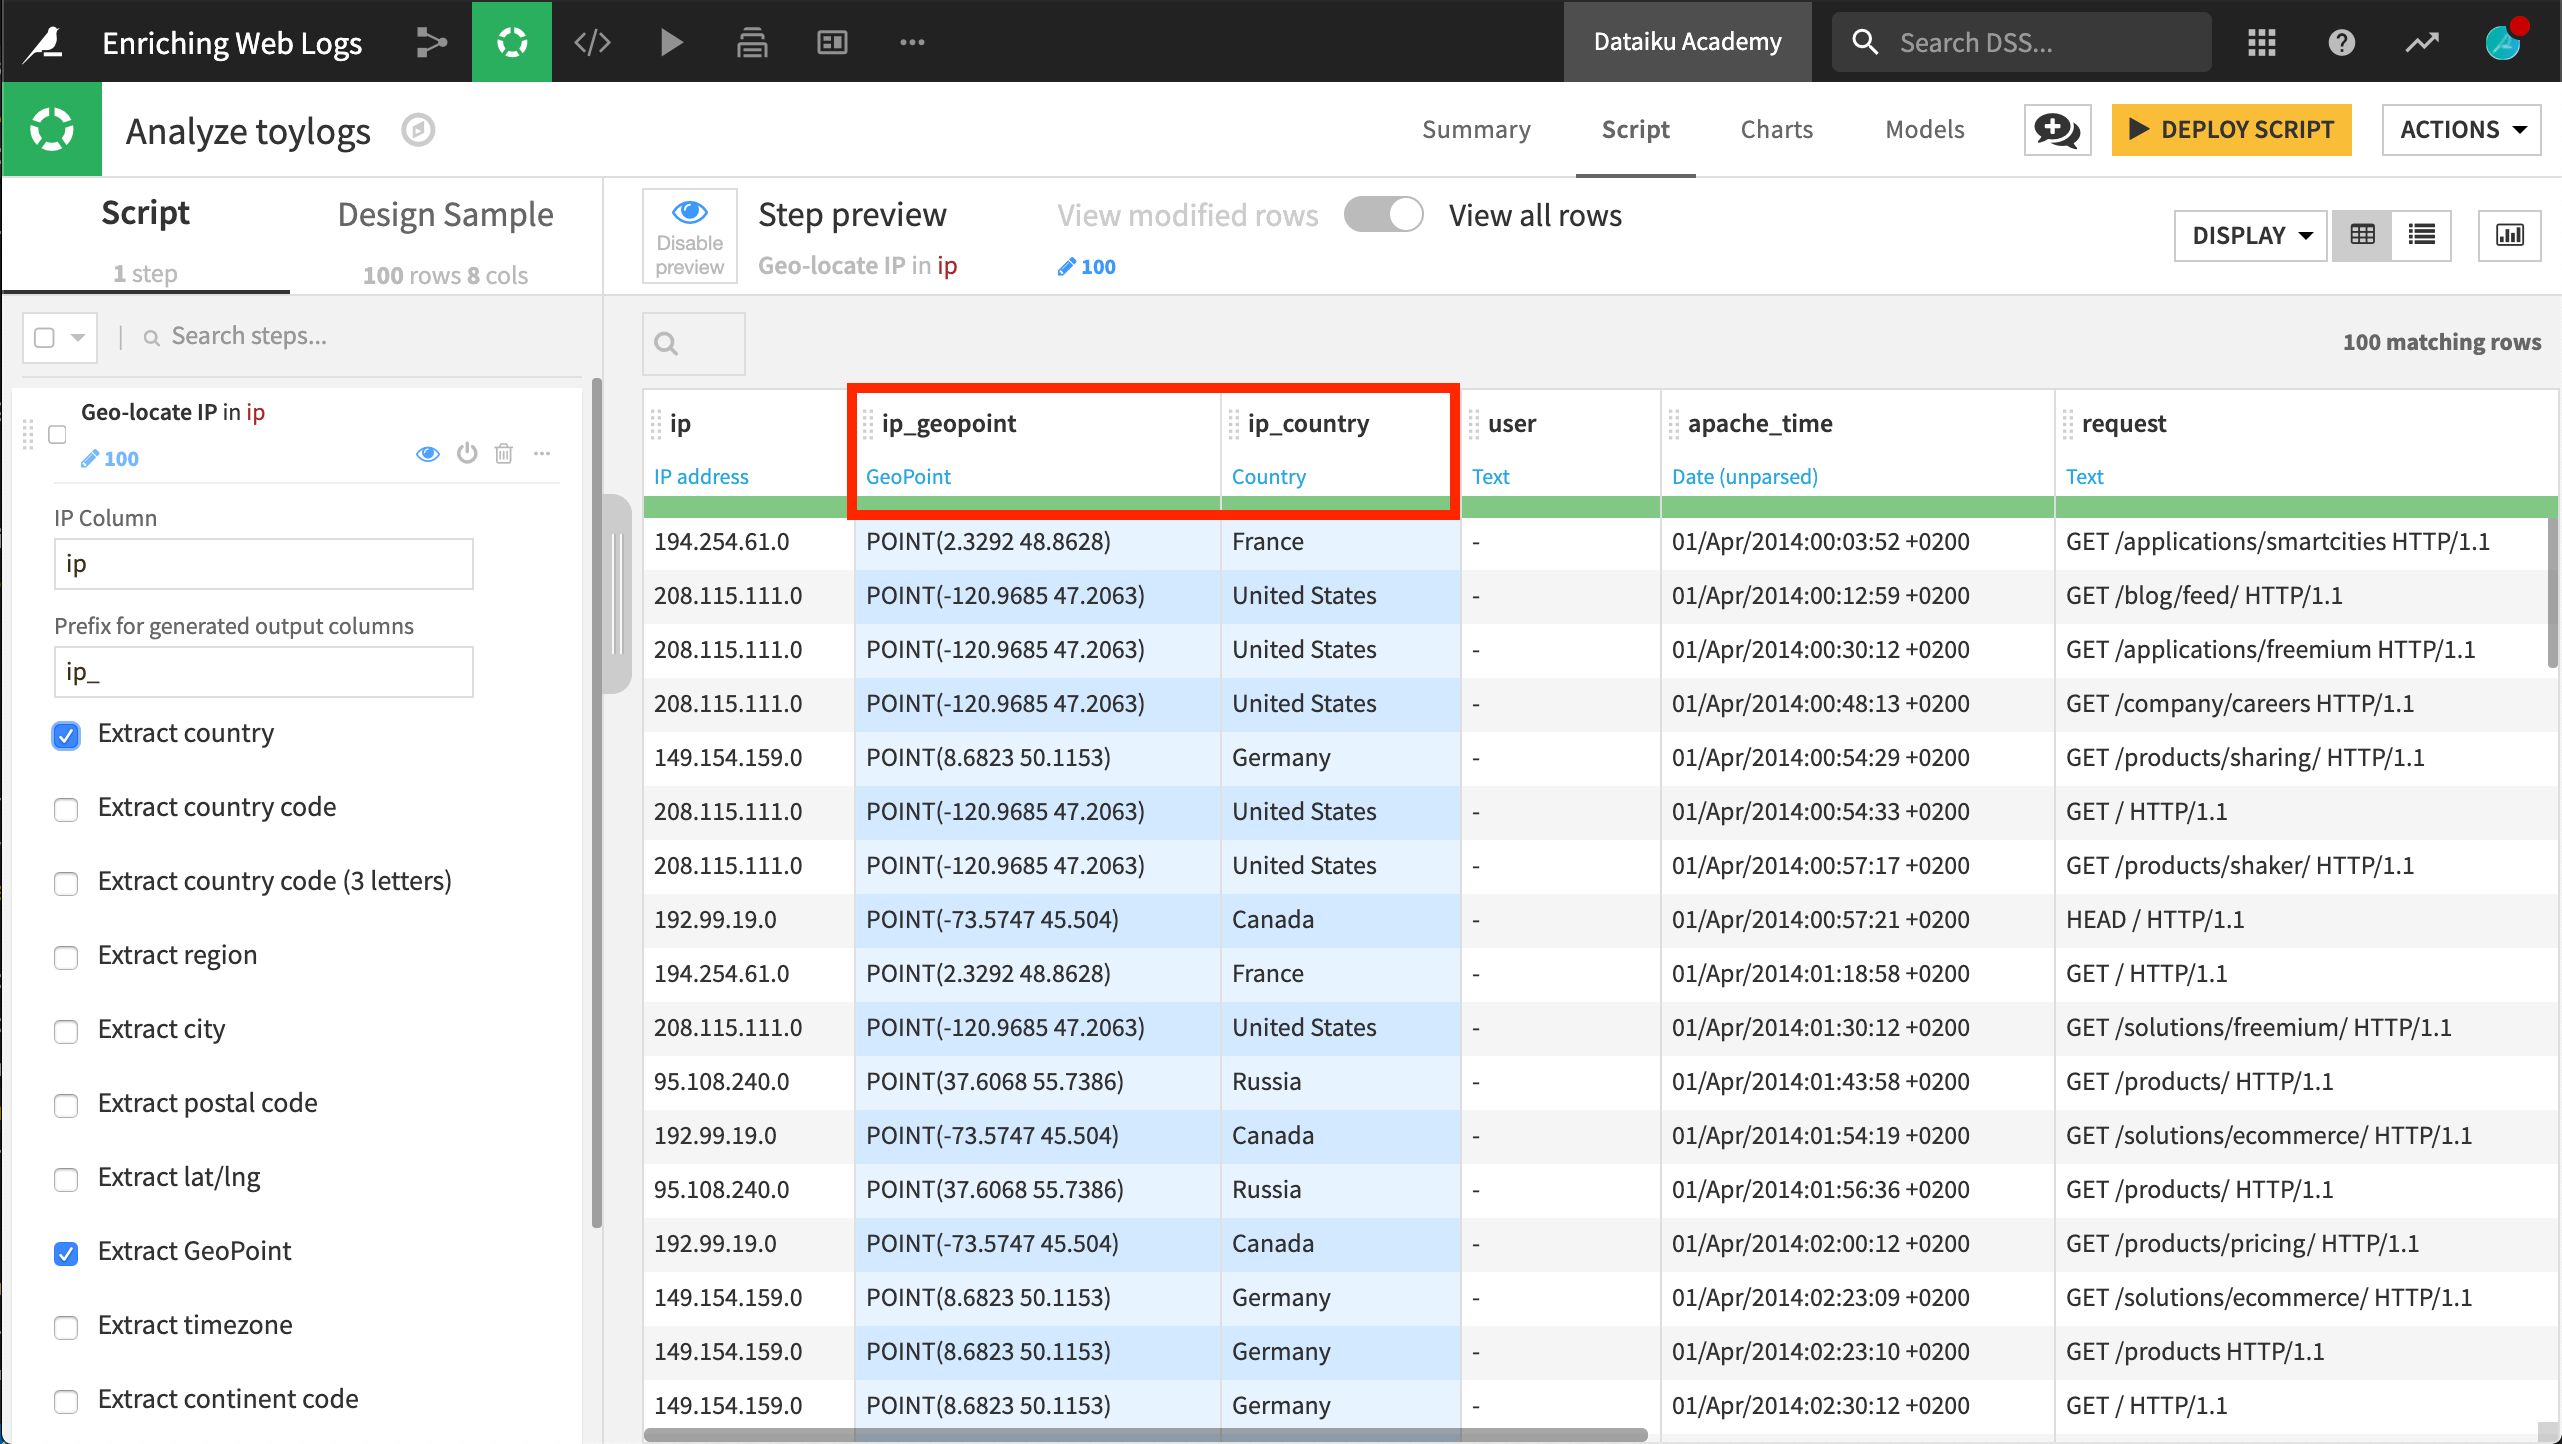
At this point, we already have enriched our logs with a country and position information without having to code anything. The country (as well as other geographic dimensions) could be used for different kinds of aggregations.
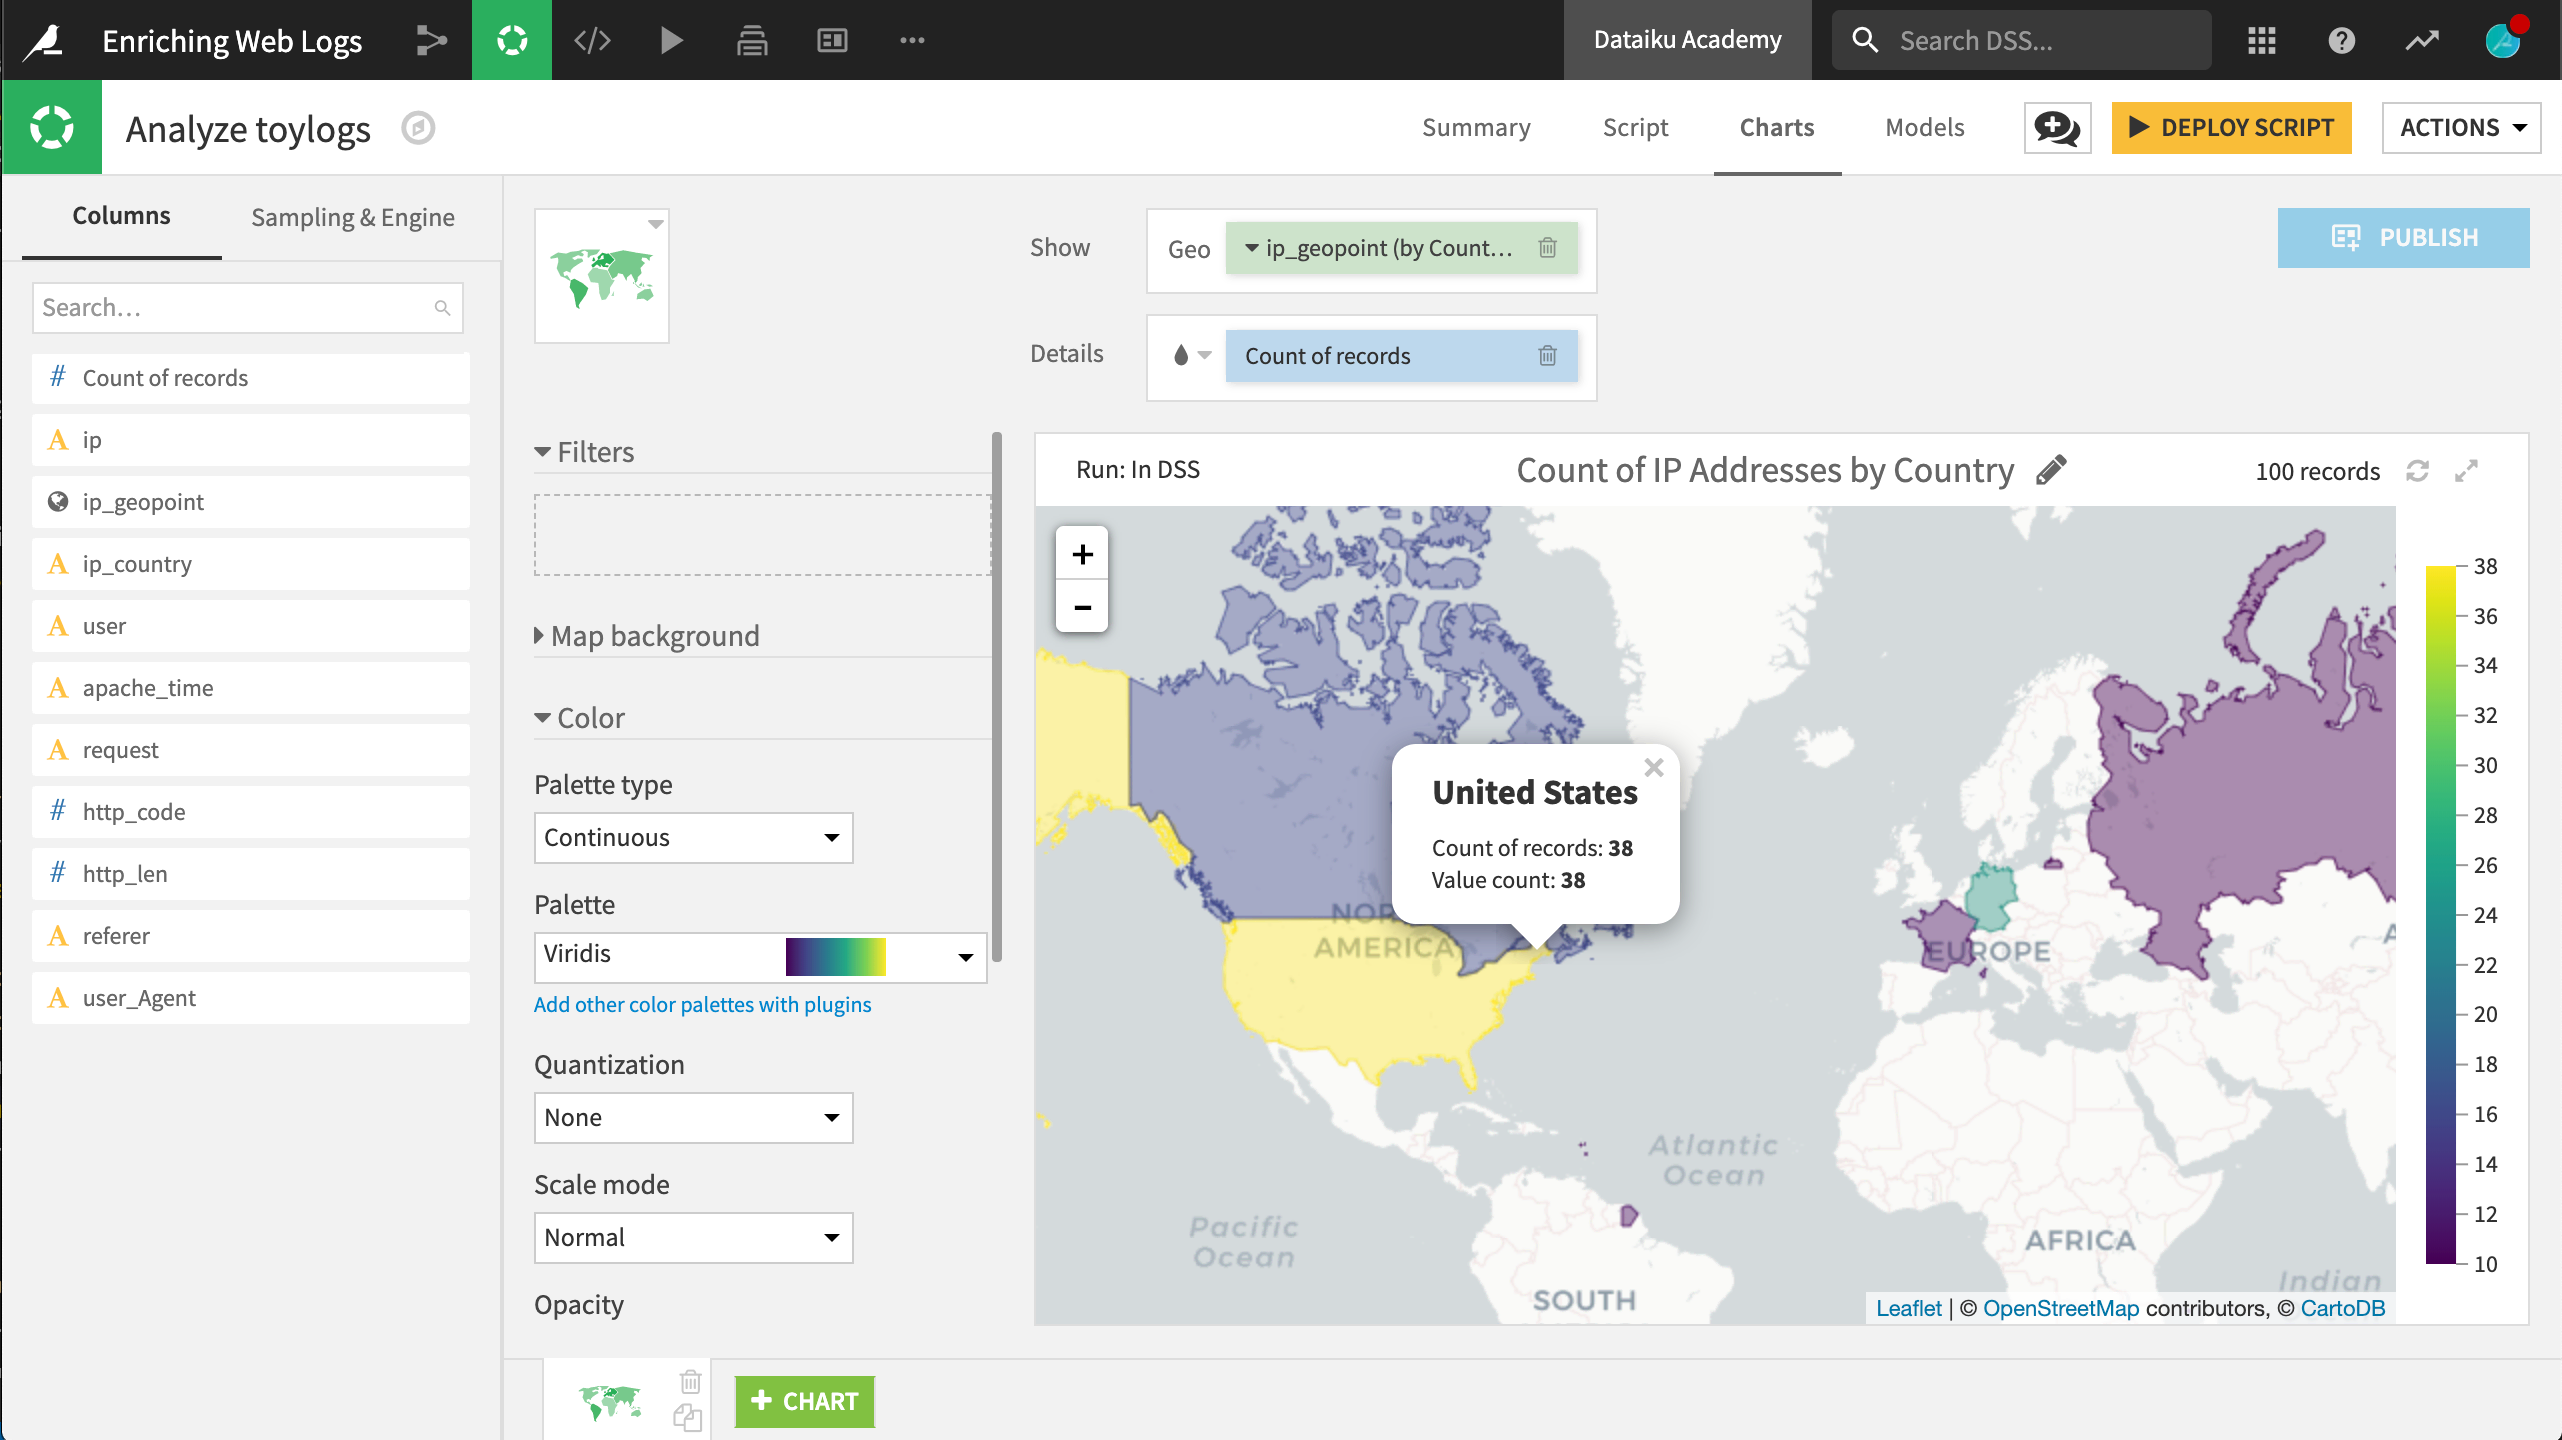
If you have installed the Reverse Geocoding / Admin maps plugin. you can easily re-create the map below in the Charts tab by dragging the ip_geopoint column into the Geo field and the Count of records into the color droplet field in a filled, administrative map.
For tutorials on working with geospatial data in DSS, please see the Geospatial Analytics course.
User-Agent Parsing
The user-agent information is important in any web log analysis. Is the user using a computer, a mobile phone, or a tablet? Which browser is the most used on a website? Which one generates the most error statuses? Is there a correlation between the device used and the probability of a sale? These are questions you can begin to answer when the user agent has been successfully parsed.
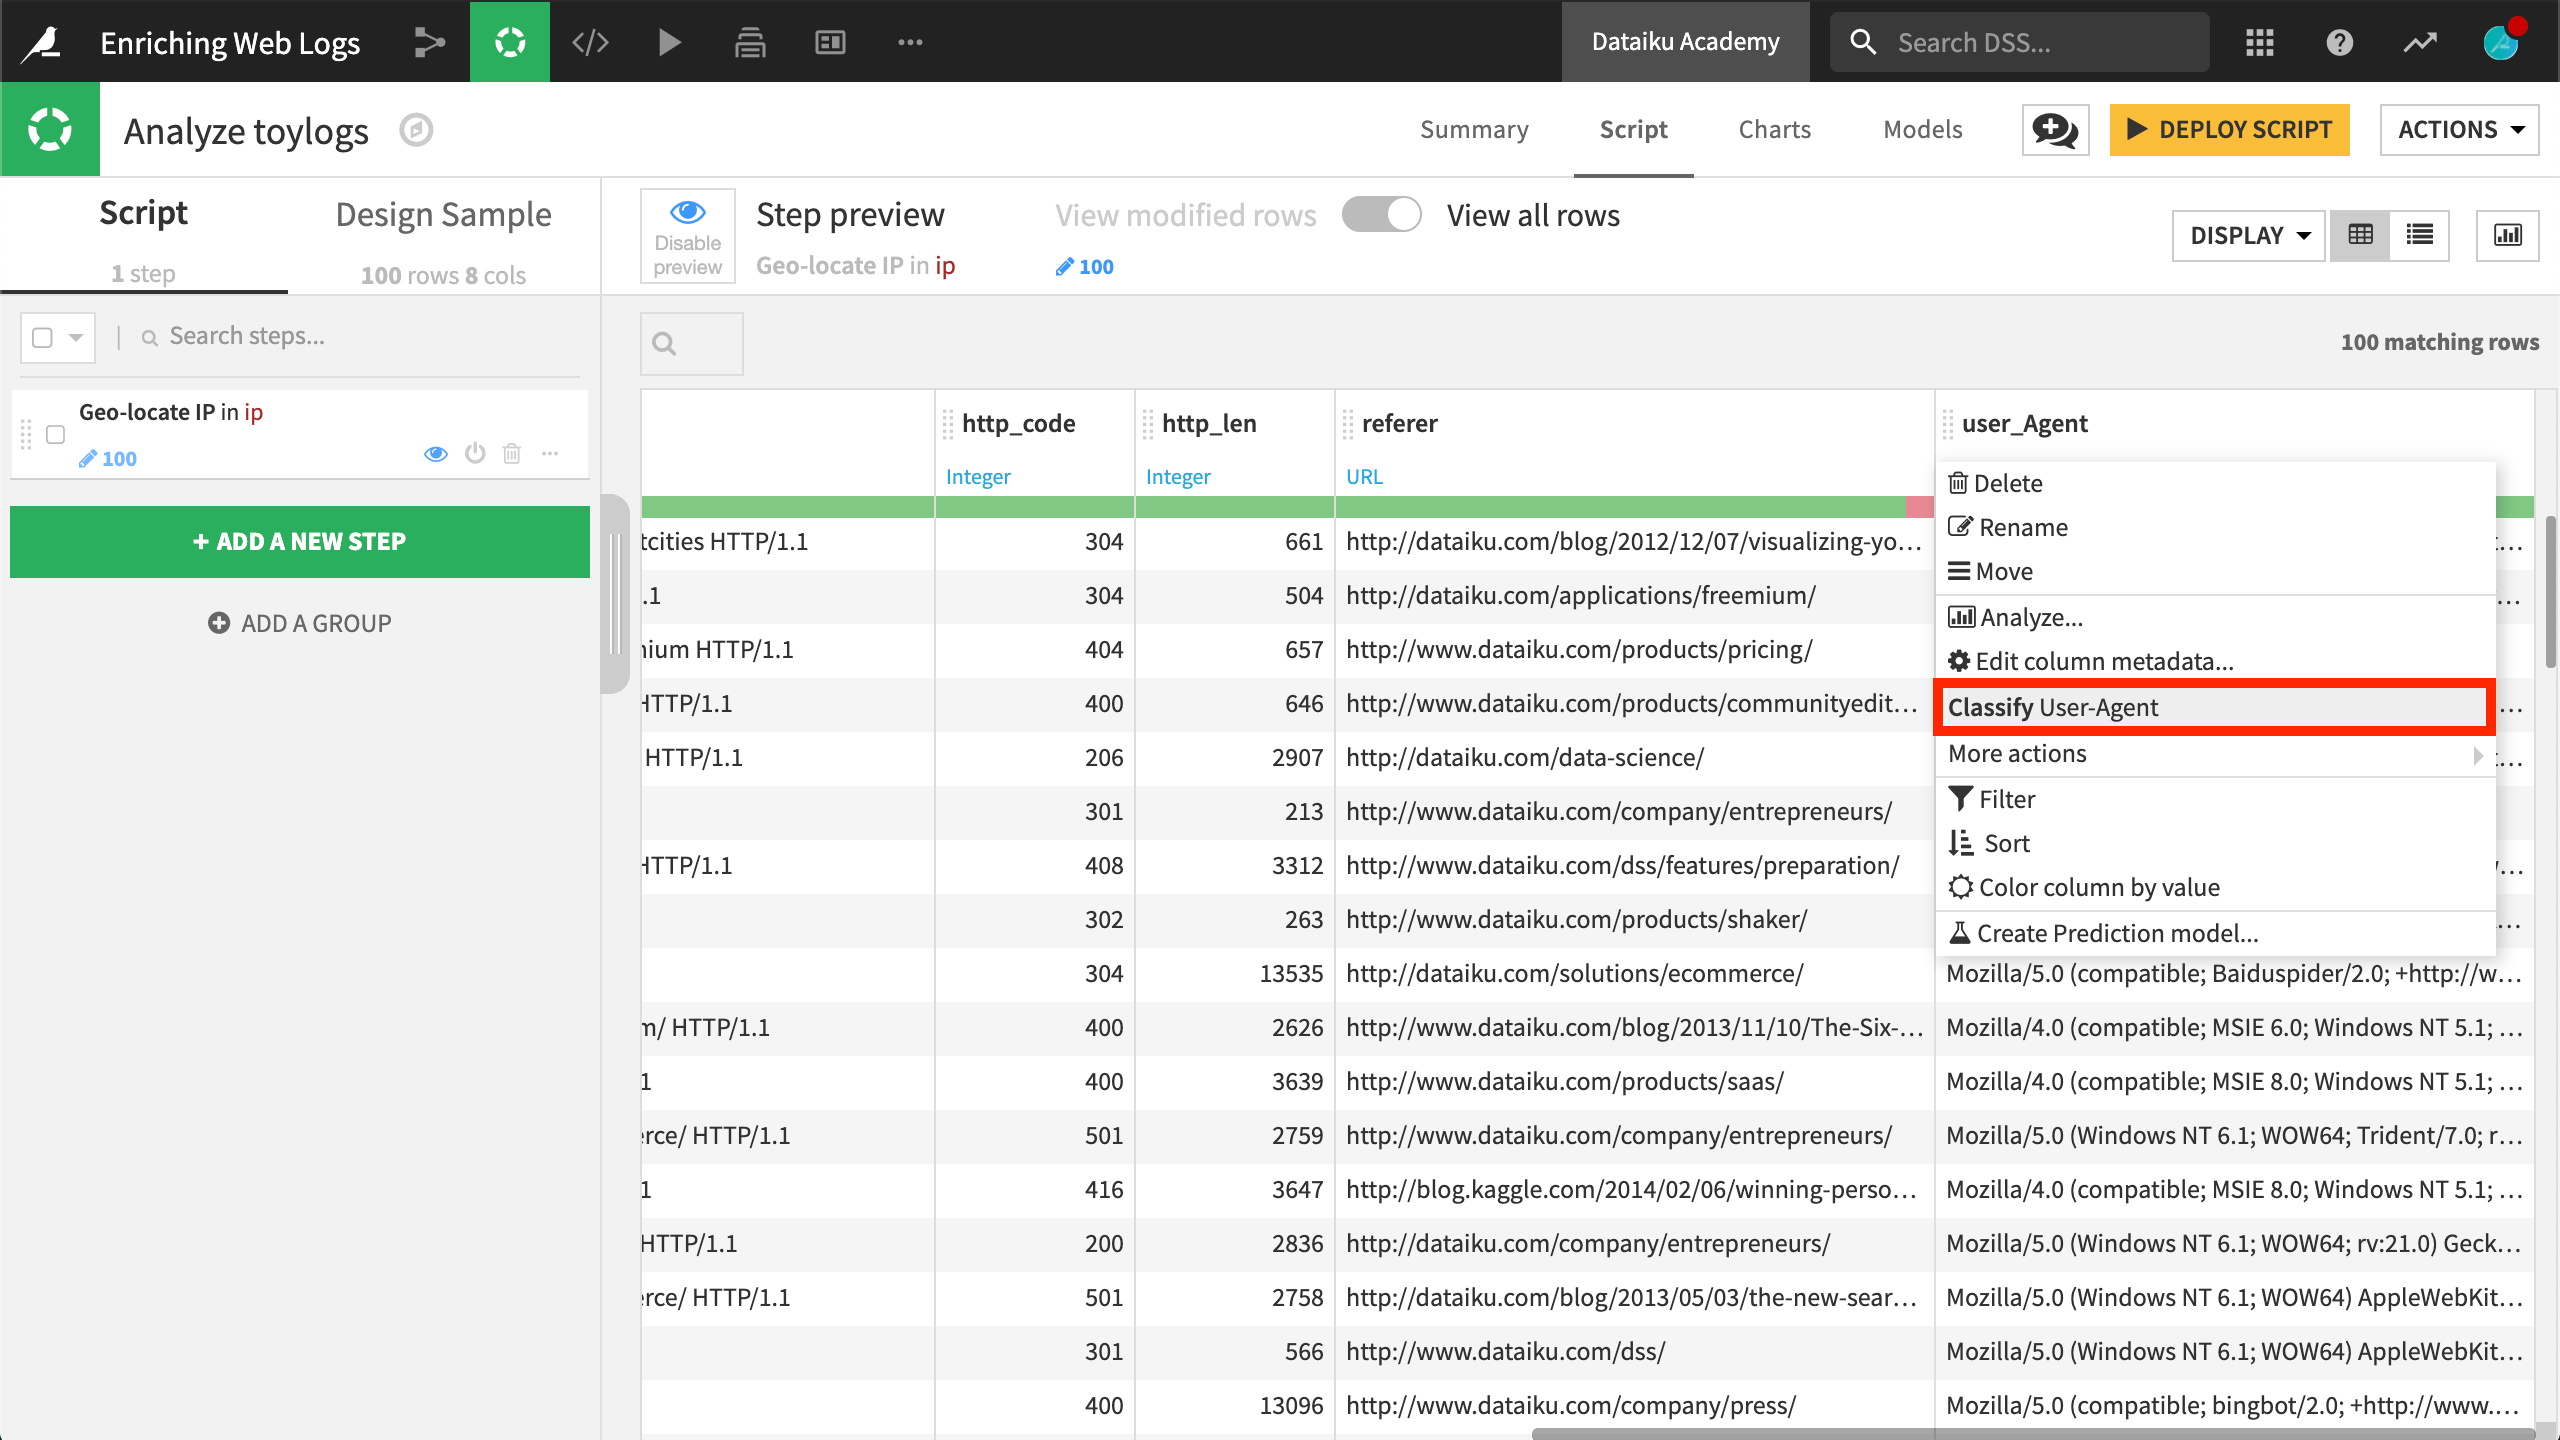
Although this field can be difficult to parse with your own regular expressions, DSS has a dedicated processor for this routine task. Begin by clicking on the user_Agent column header in the Script tab. In the context menu, select the suggested step Classify User-Agent. DSS suggests this particular step from the processor library because it has inferred the meaning of the this column to be User-Agent.
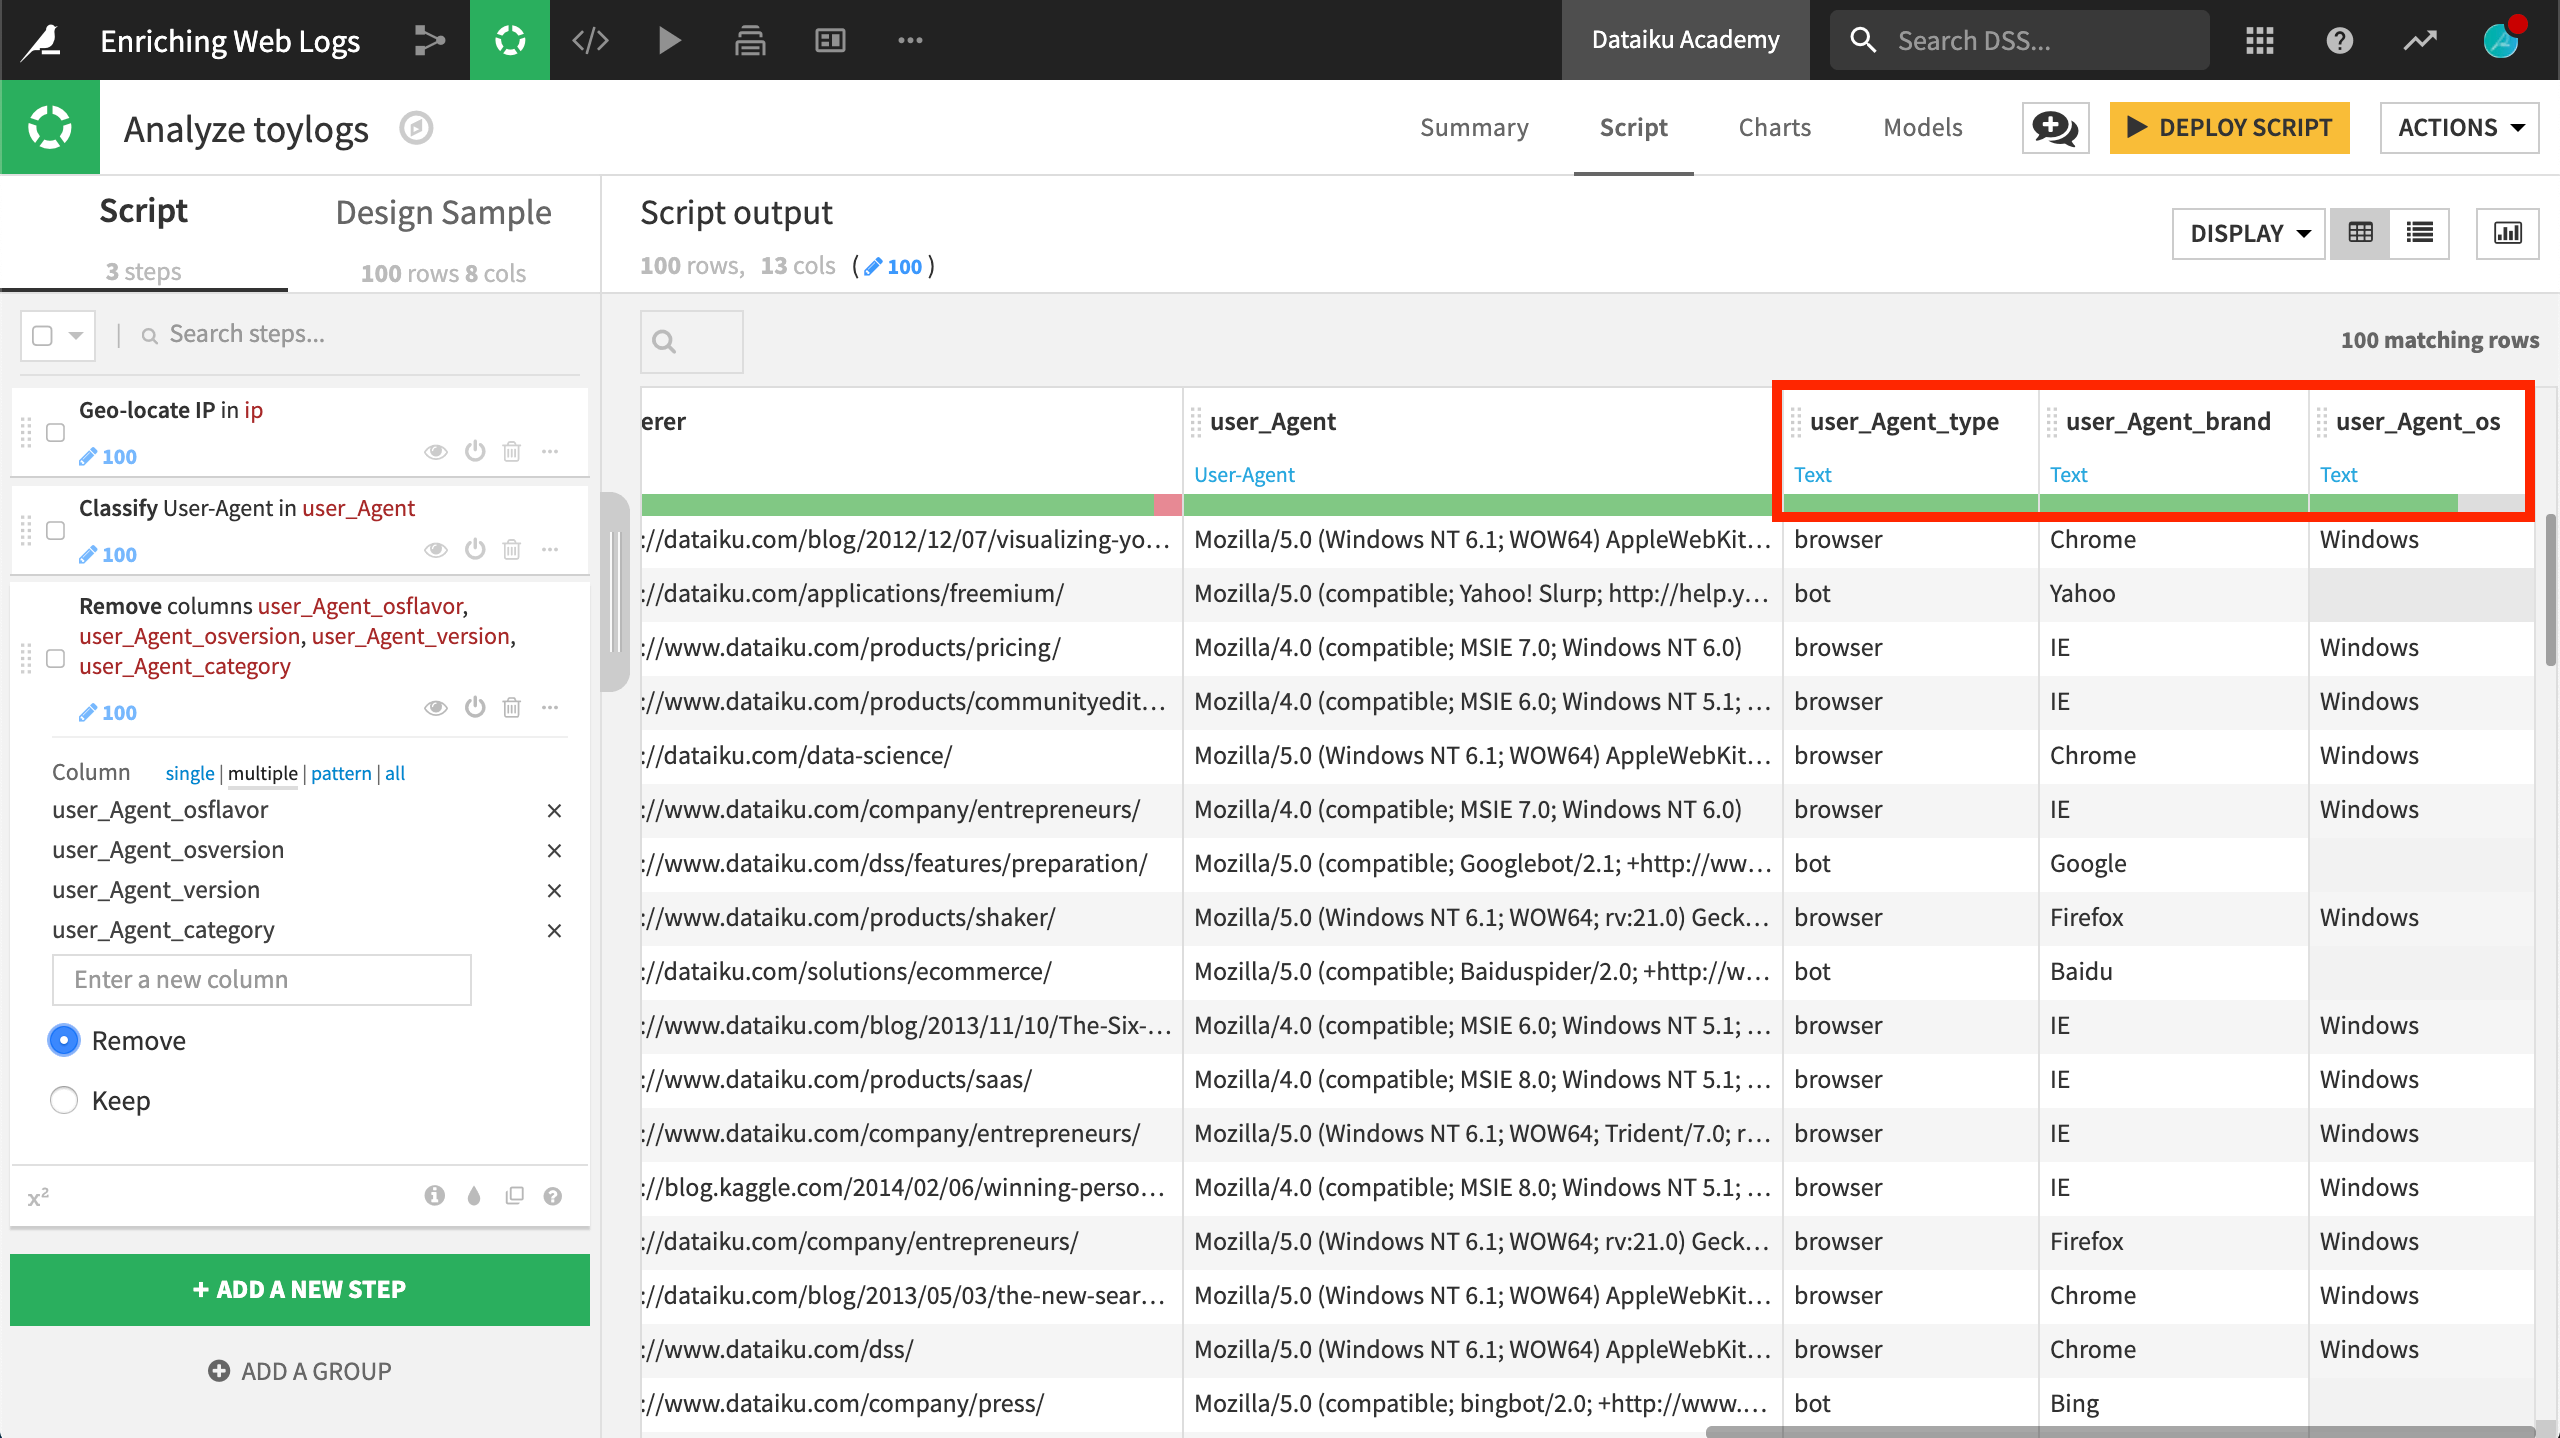
This processor extracts information into a number of new columns. In this exercise, we’ll keep only user_Agent_type, user_Agent_brand, and user_Agent_os. It seems that we only have bot or browser here, most of them via Internet Explorer on Windows.
Referer URL Parsing
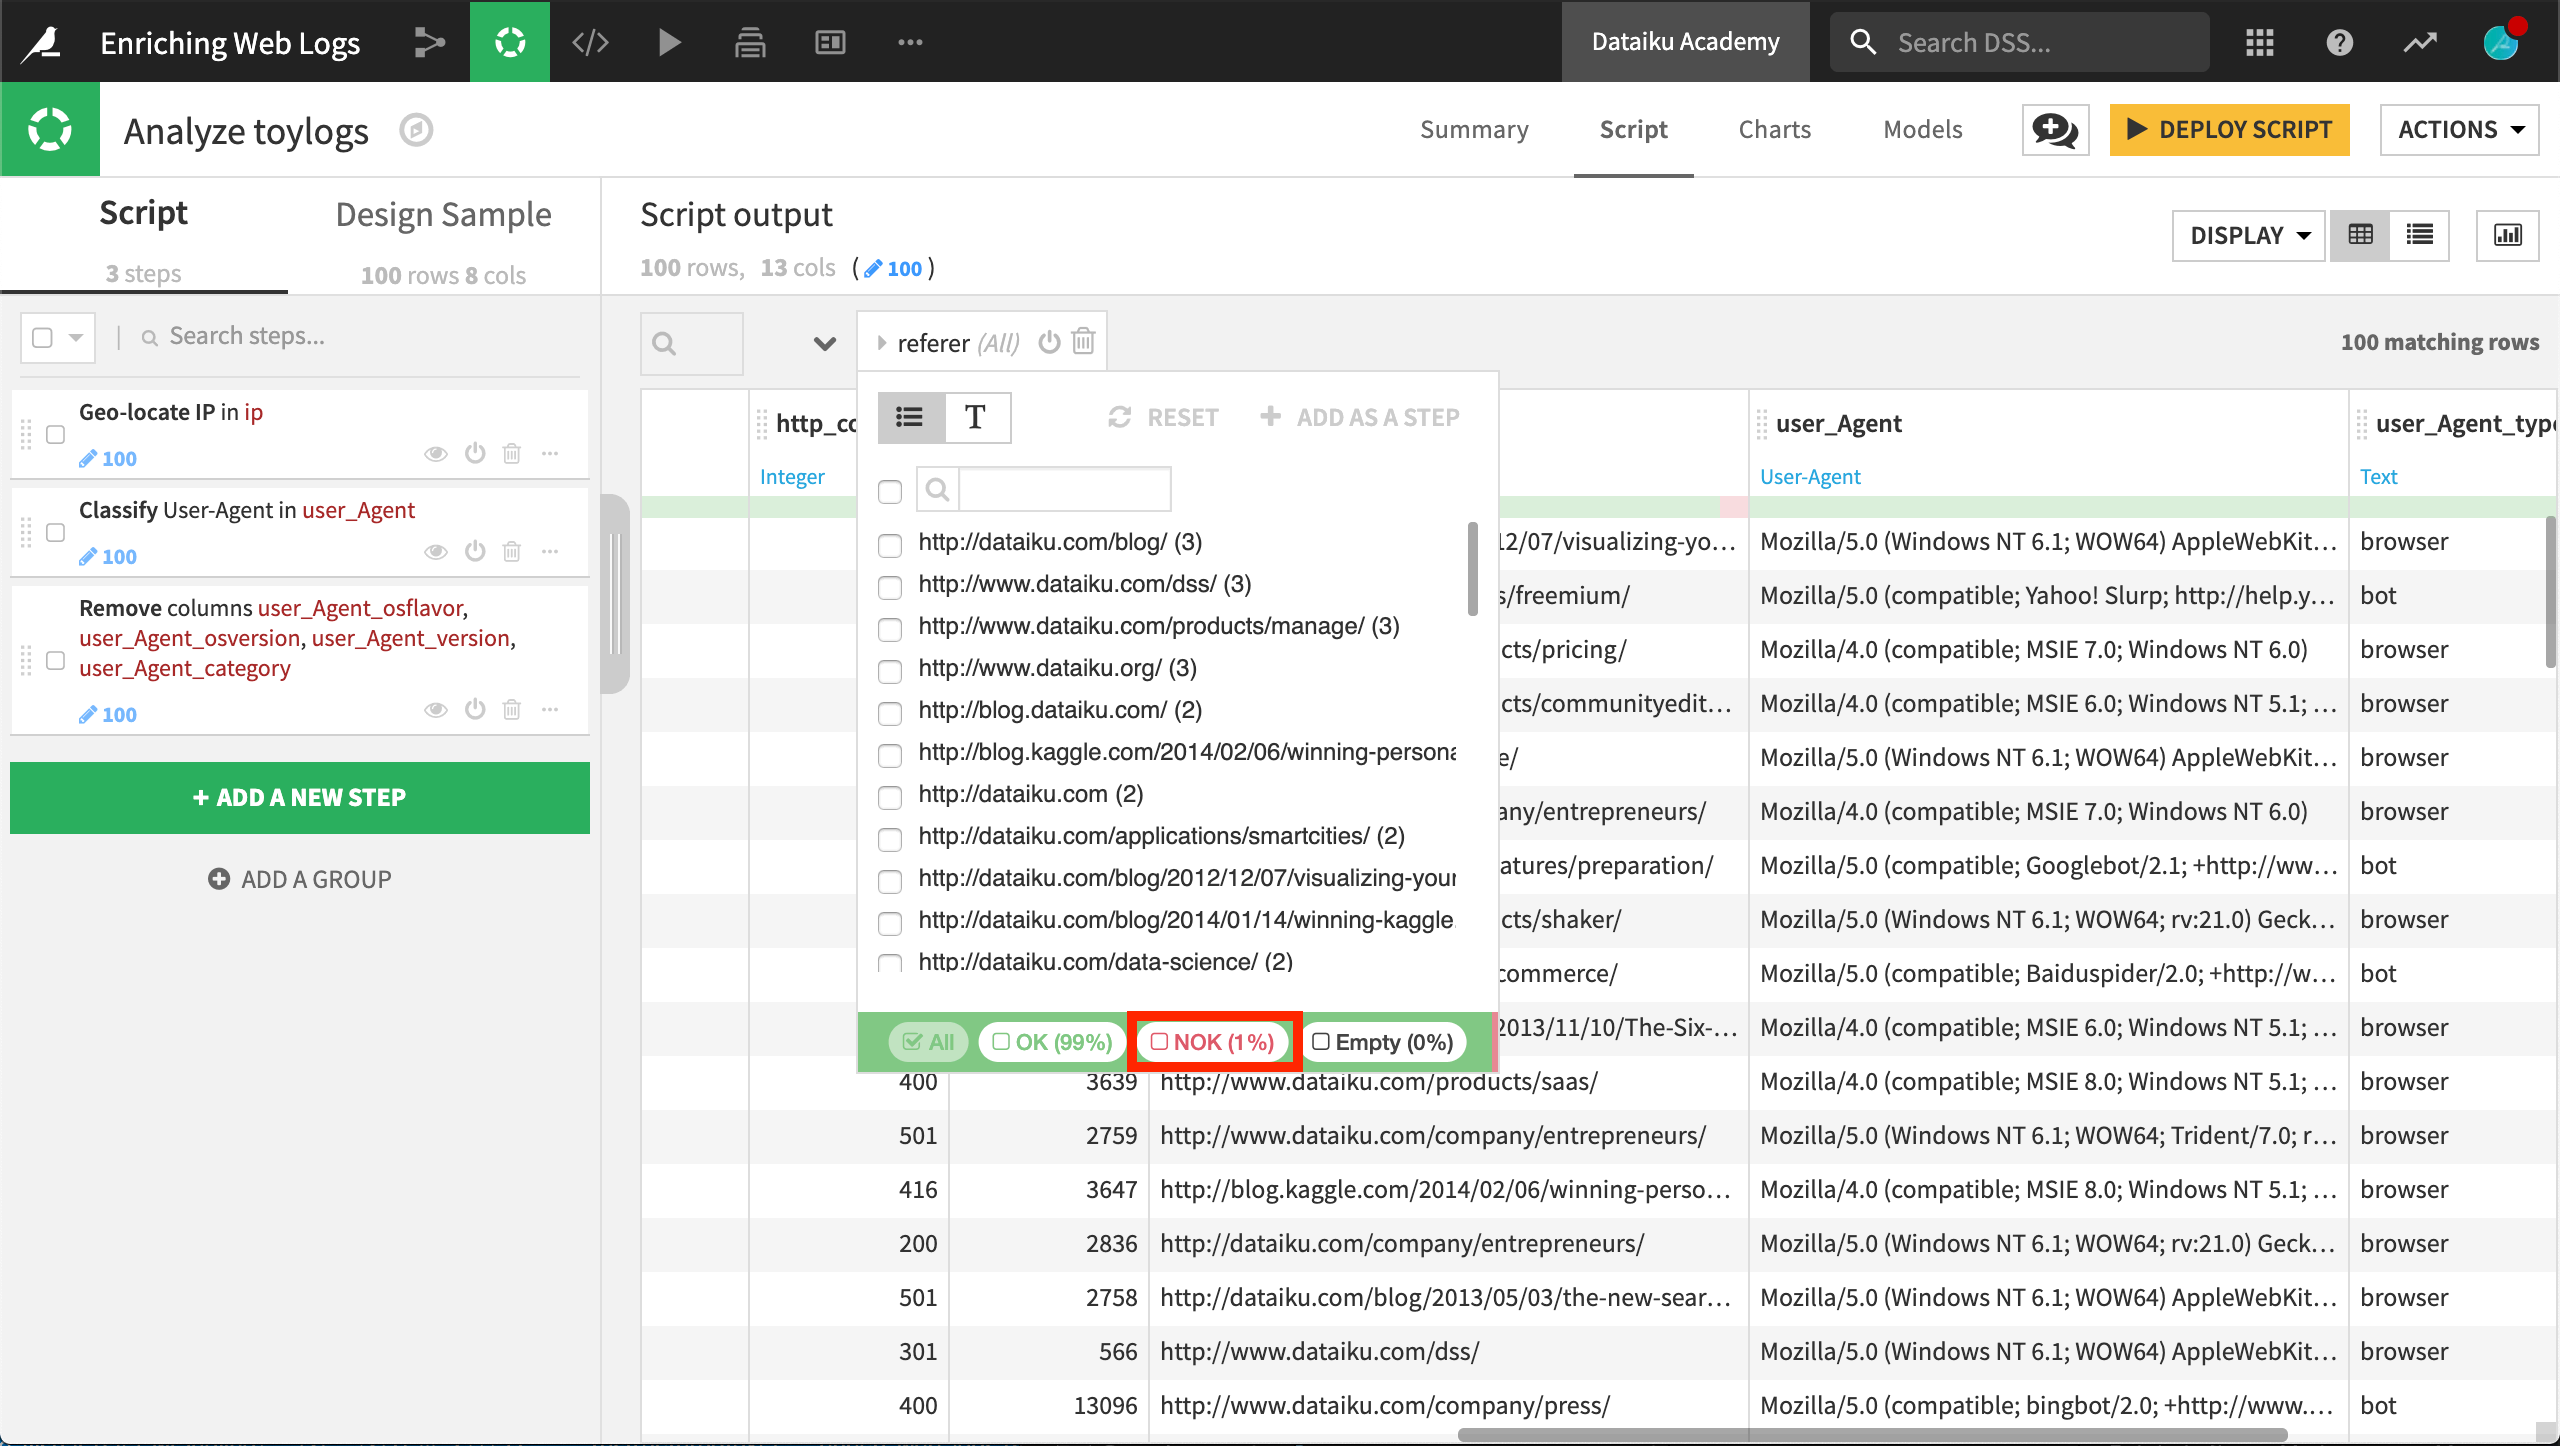
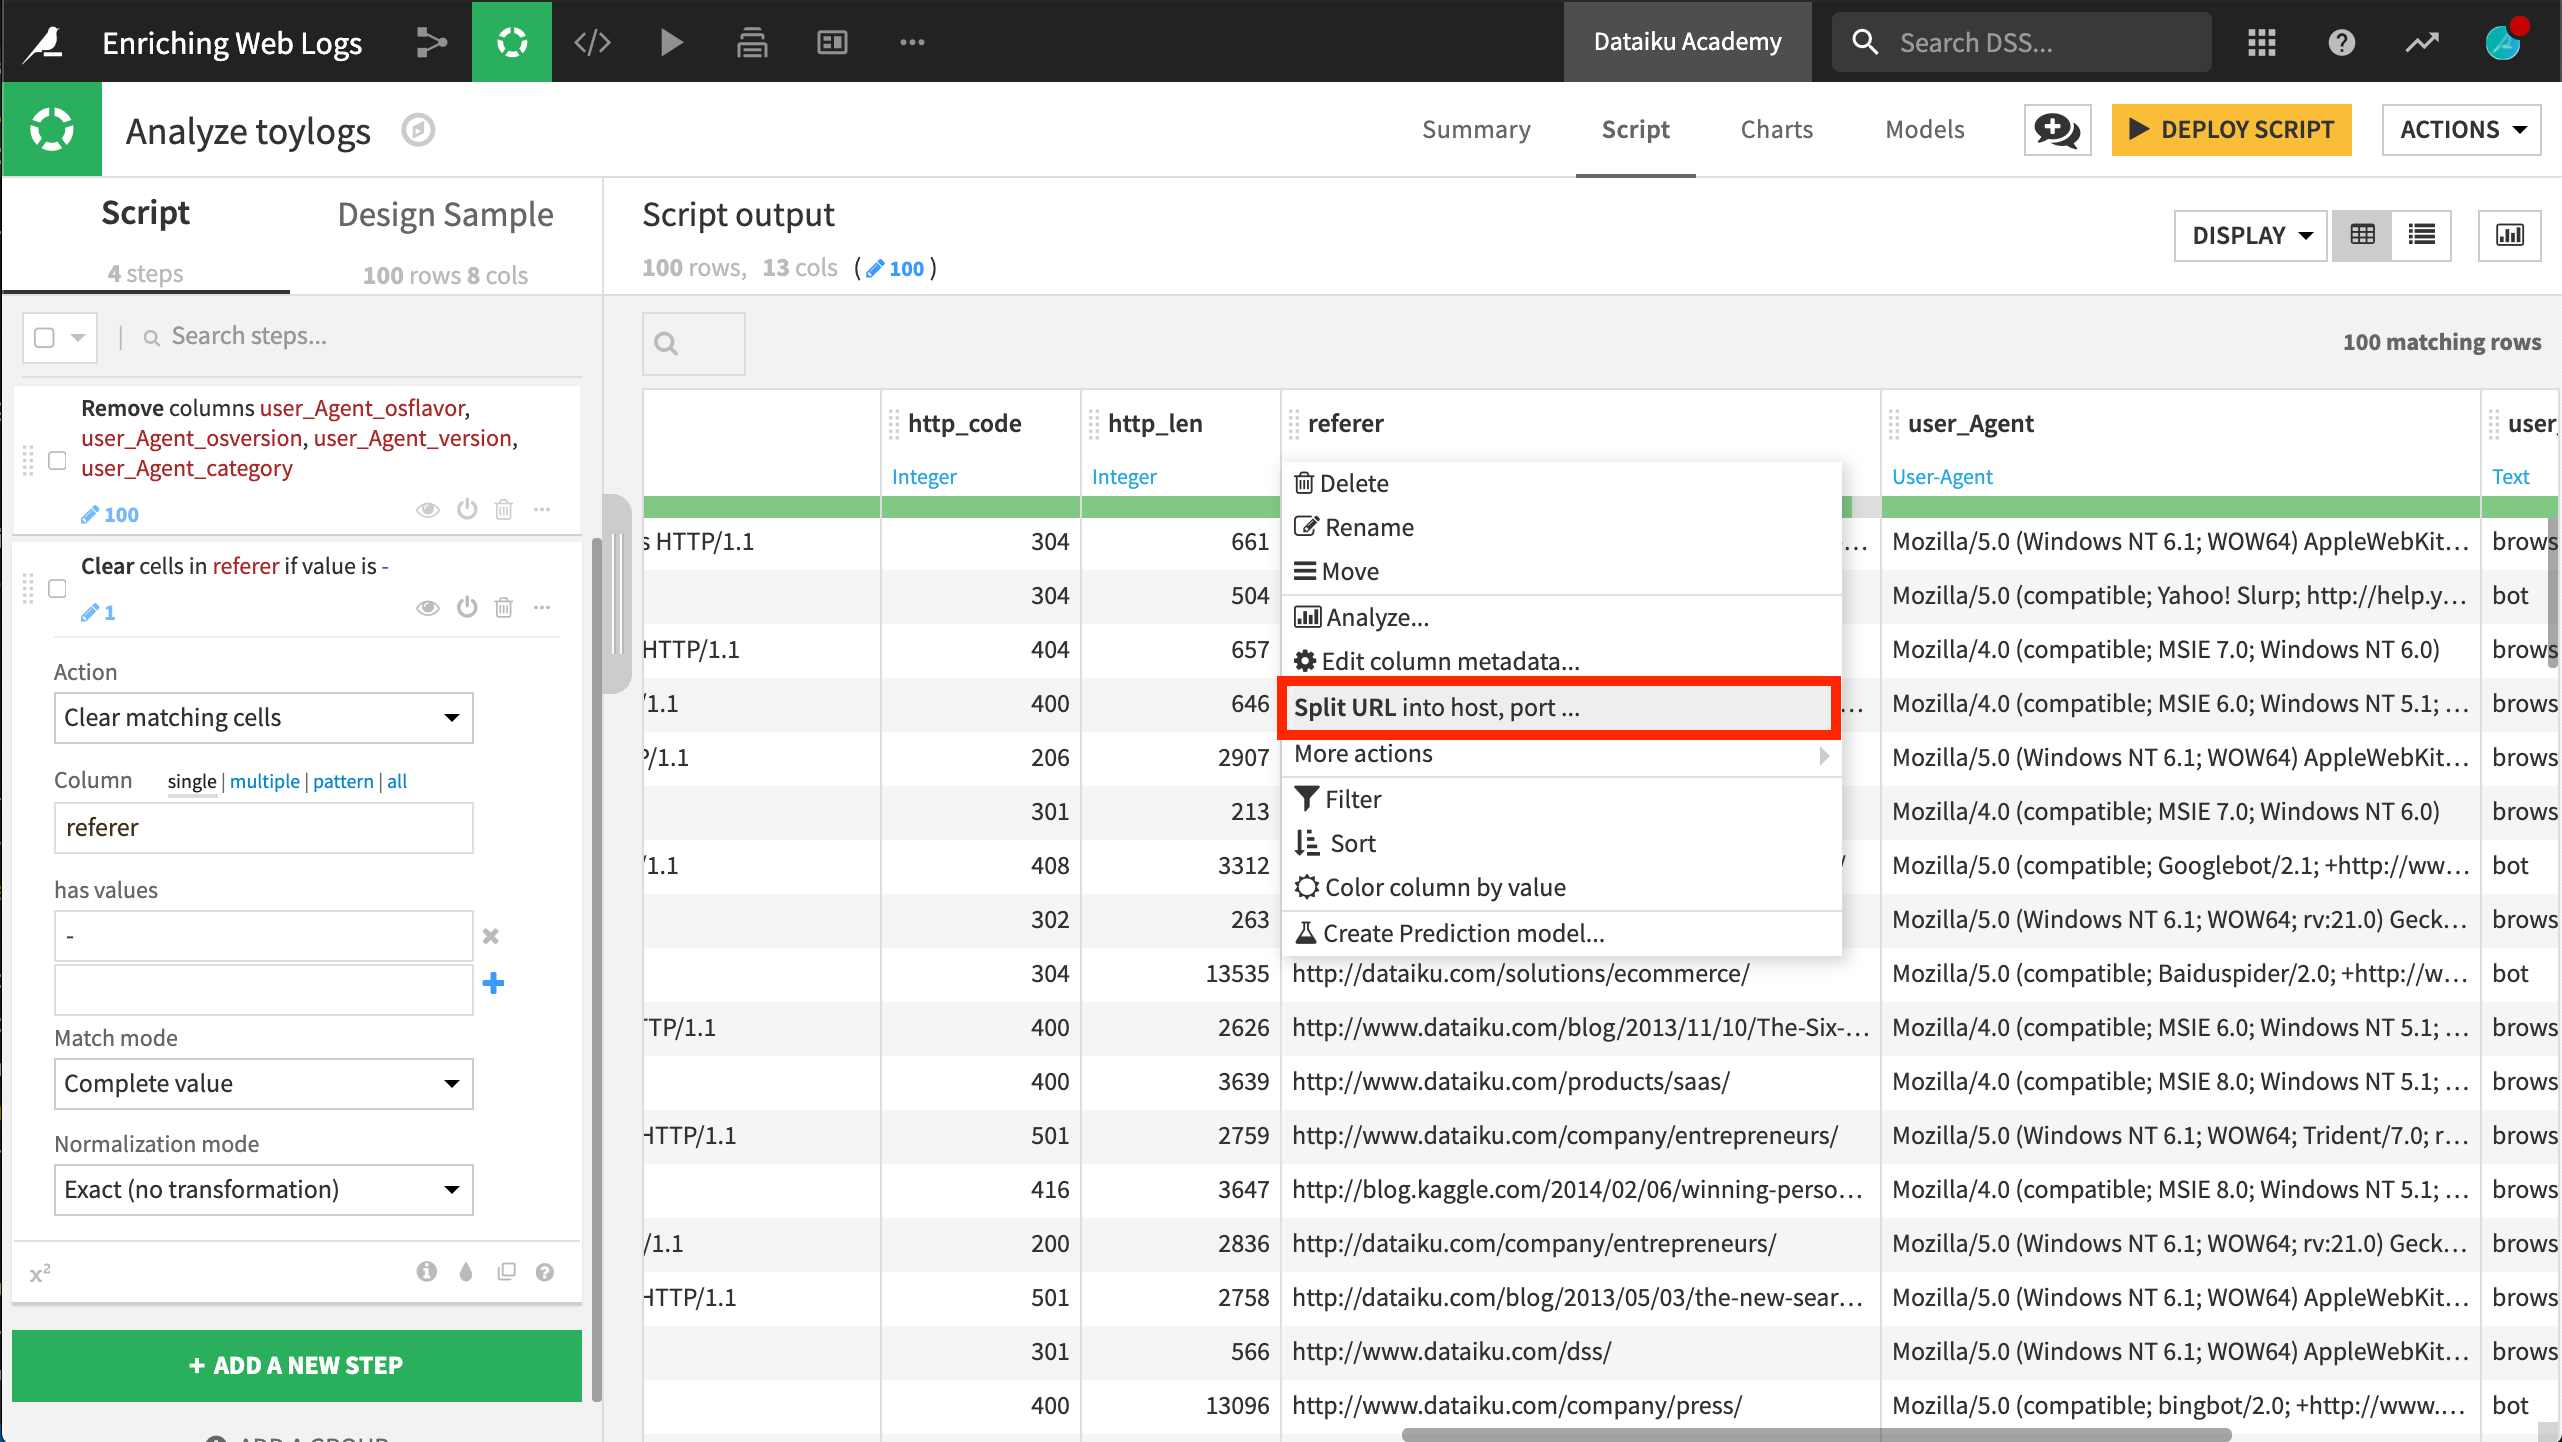
Now let’s turn our attention to the referer URL, which tells us where visitors are coming from. Despite an invalid observation as indicated by the green gauge, DSS is able to identify the meaning of the referer column as a URL. Accordingly, in the context menu, DSS suggests splitting the URL into host, port, and many other entities.
We can filter the dataset to investigate the invalid observations for this column. Selecting the “NOK” option shows one observation has the string value “-“.
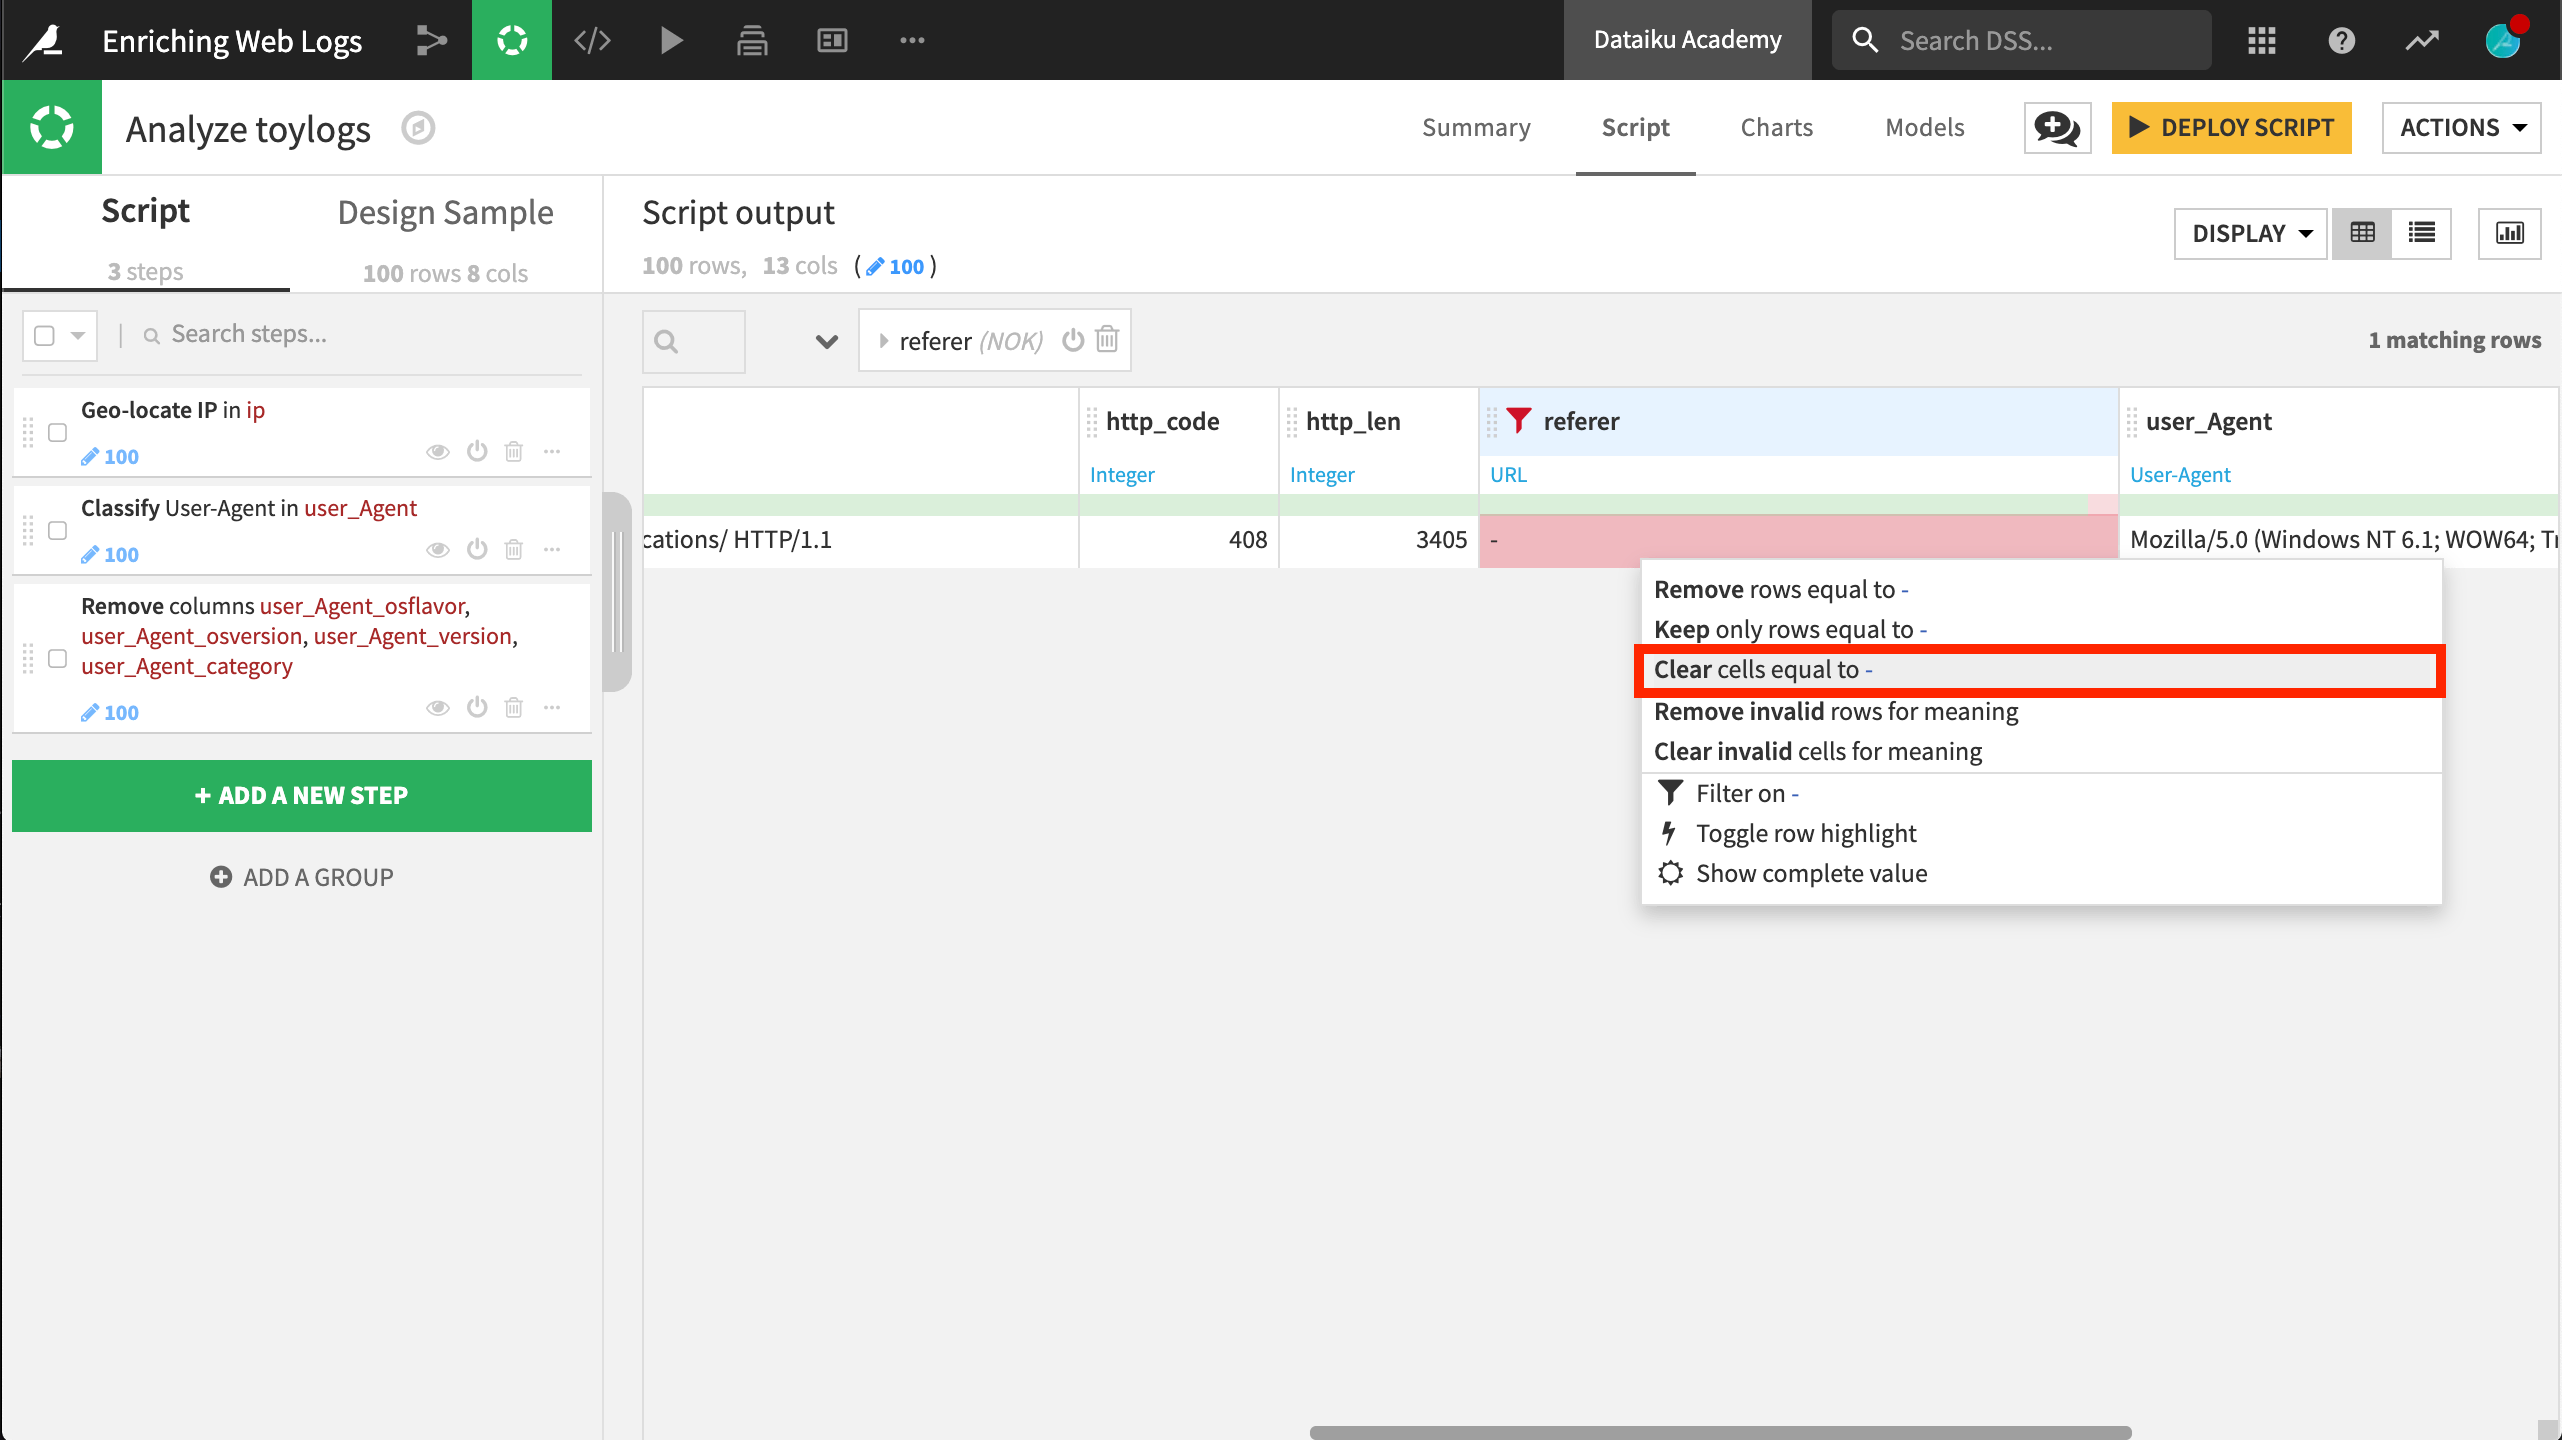
Clicking on this value produces another context menu, prompting us to “Clear cells equal to ‘-‘”. After performing this action, the red section of the gauge is now gray.
Returning to the context menu of the referer column, choose Split into host, port ….
This action produces several new columns:
scheme contains the communication protocol (http , https).
host has the website from which the request was made. A quick analysis (click on column name and “Analysis”) reveals that most queries come from the website dataiku.com.
referer_path is not as easy to analyse in its current state, but we can use its hierarchical structure to make more sense out of it.
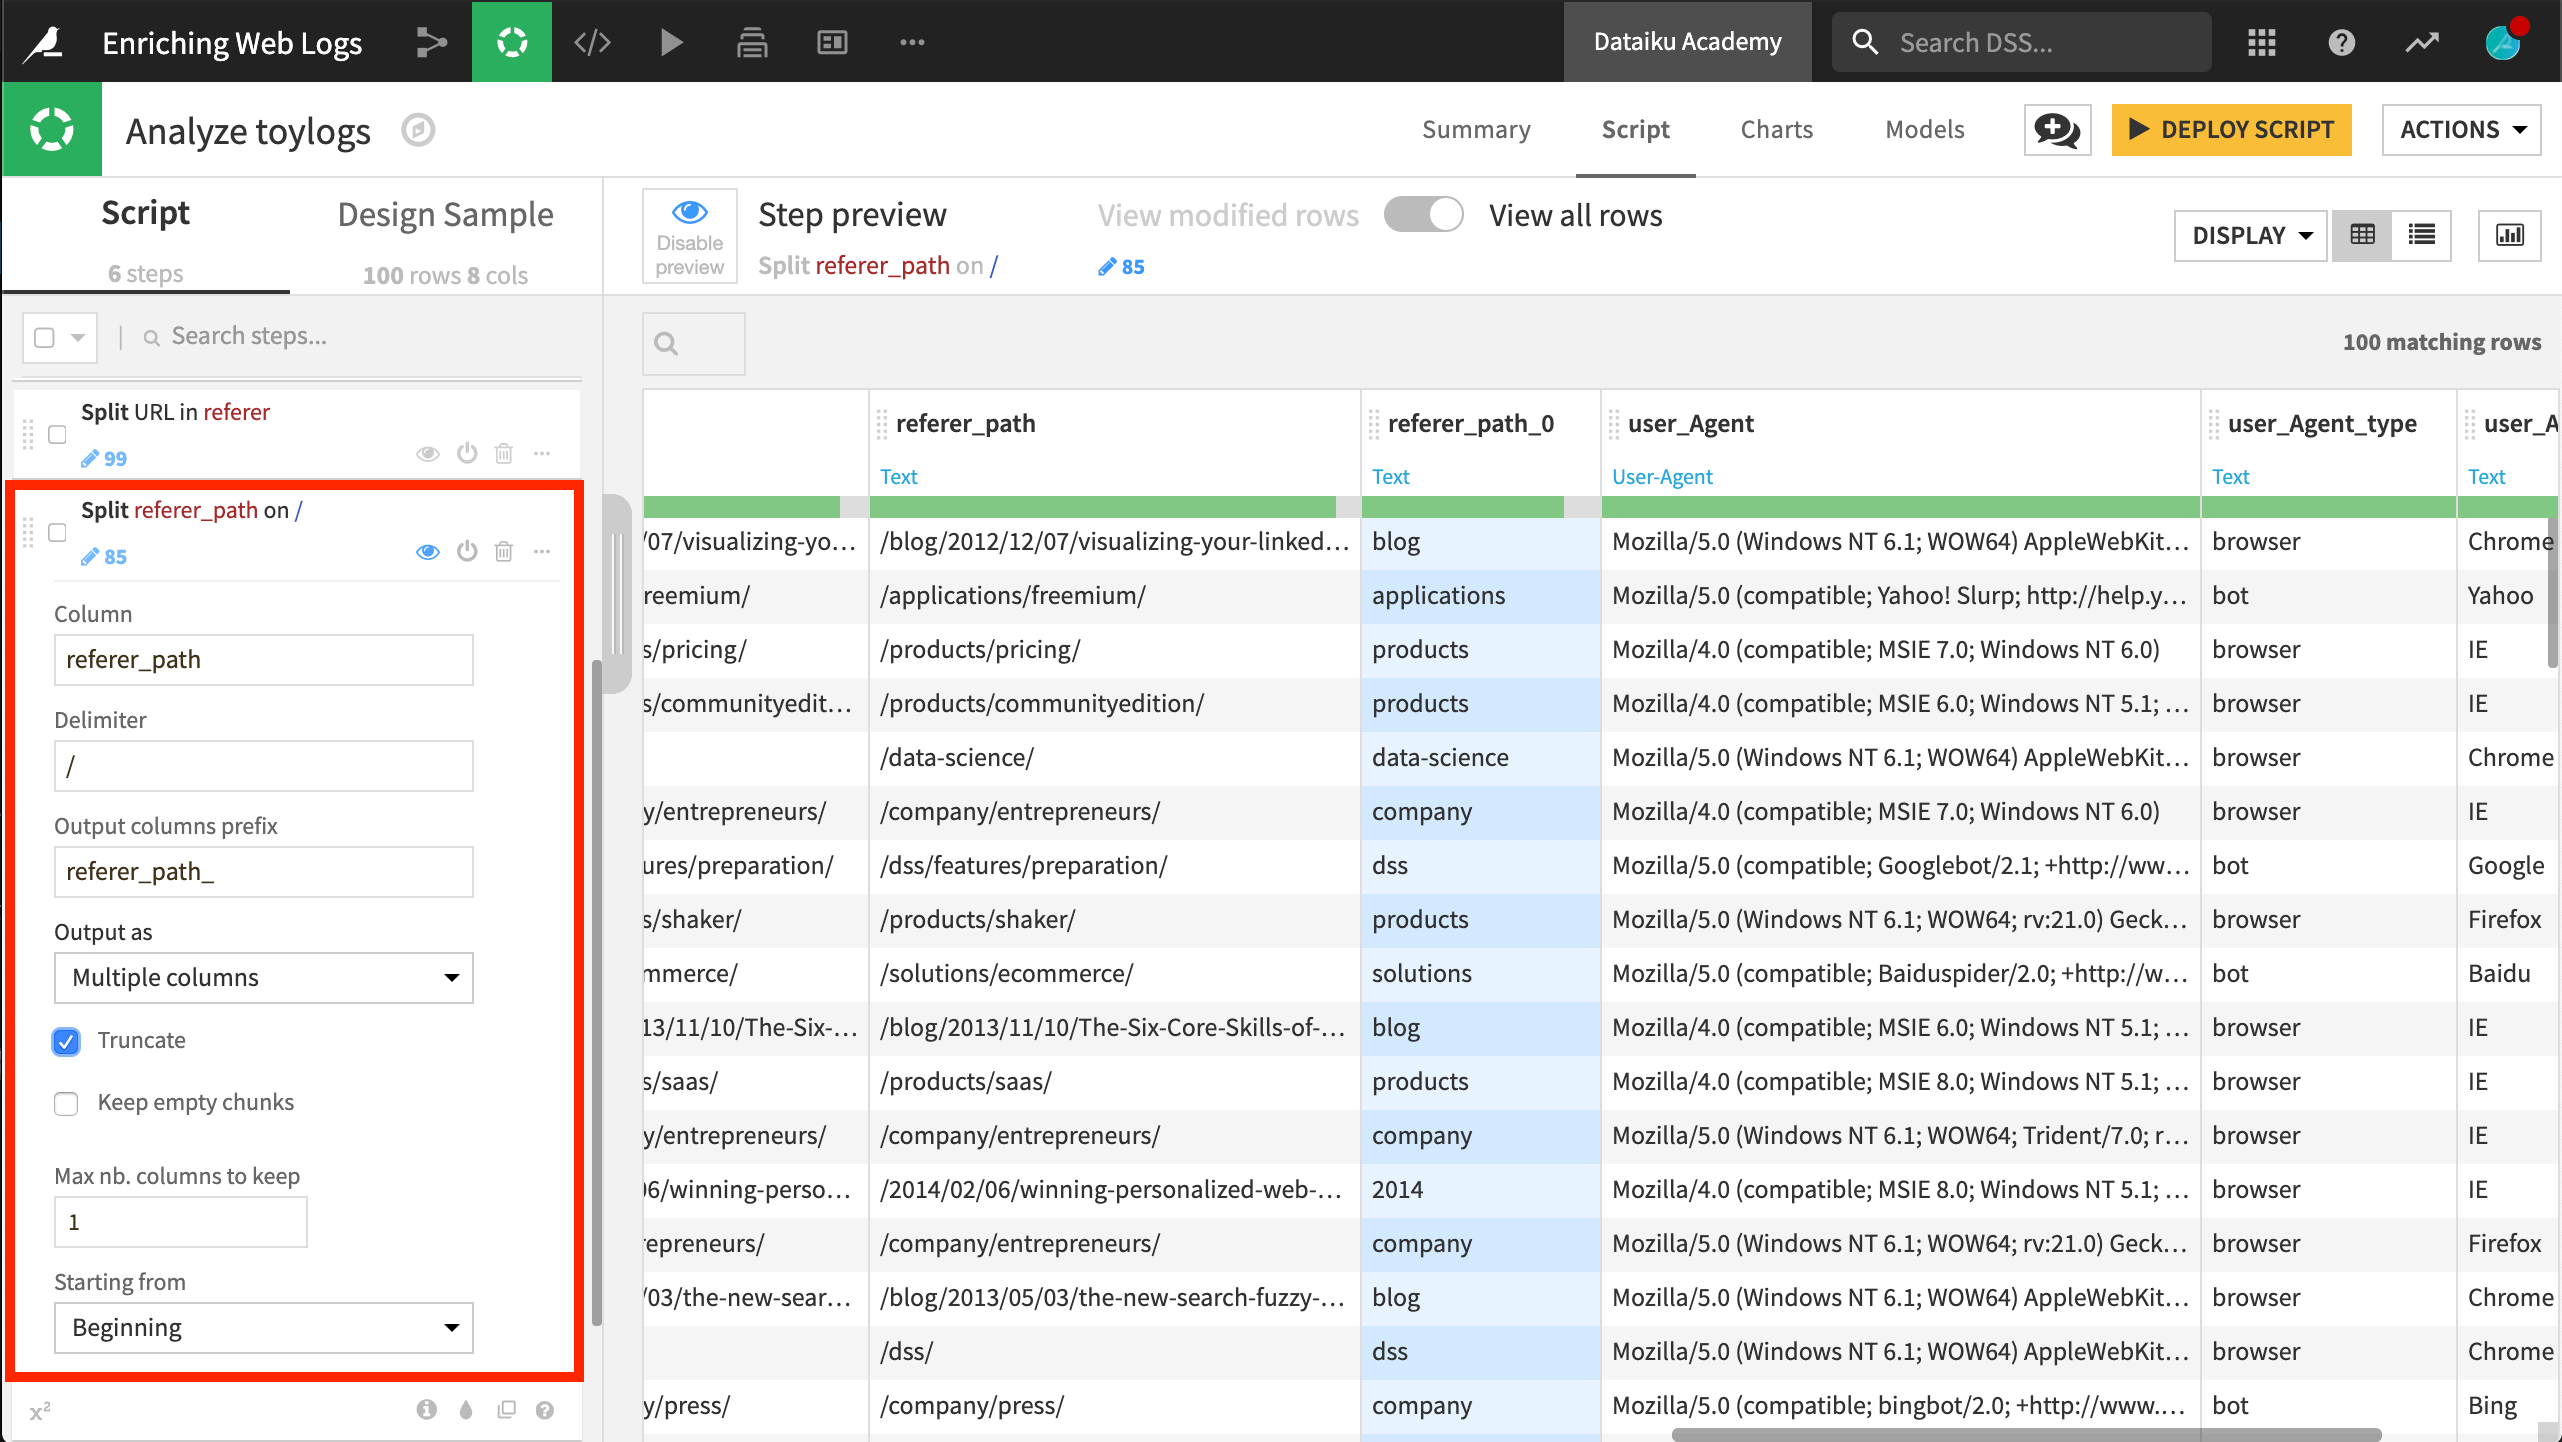
Among the new columns, you only need to keep referer_path in this case. Add a new Split column step to the Script. referer_path is the column; / is the delimiter. Check the Truncate box to keep only one new column.
Now, the referer_path_0 column reveals that most requests come from the products, blog, and applications part of the website.
Other Transformations
This is only the start of what could be accomplished. Other possible transformations not specific to web log data include:
Parse the date of the log and extract components. Is the hour of the day relevant for your traffic analysis? Probably, and so is the day of the week, and the bank holidays.
We could use the Split column processor on the request column in a similar manner as we did for referer_path.
To do so, set the blank space character between the HTTP method (GET, POST, HEAD, etc.) and the path as the delimiter. Three new columns are generated. The second one corresponds to the path requested by the user. Along with the referer path, this is the column that enables you to analyse and understand the path taken by the visitor to your website.
In this example, there is no HTTP query string, but this could contain valuable information from dynamic, user-generated data. Feel free to try the corresponding DSS processor on your own data.