Factories Electricity & CO2 Emissions Forecasting
Overview
Business Case
Demand for industrial products has risen considerably in the past two decades, along with energy consumption and CO2 emissions. All industrial companies are engaged in a race to reduce their CO2 emissions to adapt to a shift in market demand and better manage their environmental risks and obligations to comply both with financial market requests and future regulatory requirements. With this solution, companies can quickly create a unified and interactive view on their energy consumption across manufacturing sites and meters, and easily convert it to CO2 through real time carbon intensity data provided by electricityMap or RTE. Production planners are able to forecast electricity and CO2 emissions linked to their planned production plans and adjust their geographical allocation choices to optimize their footprint.
Technical Requirements
To leverage this solution, you must meet the following requirements:
Have access to a DSS 9.0+ instance.
-
This plugin is currently only installable from a github repository. It will be published to the Plugin store in the near future.
A Python 3.6 code environment named
solution_factories-electricity-co2-forecastingand the following required packages:
plotly-express>=0.4.1
nbformat>=4.2.0
Note
When creating a new code environment, please be sure to use the name solution_factories-electricity-co2-forecasting or remapping will be required.
In order to convert electricity consumption for locations other than France, you can use electricityMap API. You can get a token by completing the ElectricityMap Contact Form .
Installation
If the technical requirements are met, this solution can be installed in one of two ways:
On your Dataiku instance click + New Project > Industry solutions > Manufacturing and Energy > Factories Electricity & CO2 Emissions Forecasting.
Download the .zip project file and upload it directly to your Dataiku instance as a new project.
Note
If running a DSS 9 instance, the solution is found by navigating to + New Project > Sample Projects > Solutions > Factories Electricity & CO2 Emissions Forecasting.
Data Requirements
The solution depends on 9 input data sources:
3 Daily Electricity Consumption reports (each corresponding to a different fictional factory):
A dataset of site addresses with the postal address of all 3 fictional factories
A dataset containing the production history of the 3 factories
The price of Electricity for non-household consumers (in this solution we sourced Europe’s Electricity price from public data).
2 Datasets to show the meter distribution in the factories
A dataset representing 3 proposed production scenarios (this dataset is input to the 3 scenarios forecast flow zone unlike the other 8 datasets)
Note
This project is meant to be used as a template to guide development of your own analysis in DSS. The results of the model should not be used as actionable insights and some of the data provided with the project may not be representative of actual data in a real-life project.
Workflow Overview
You can follow along with the solution in the Dataiku gallery.
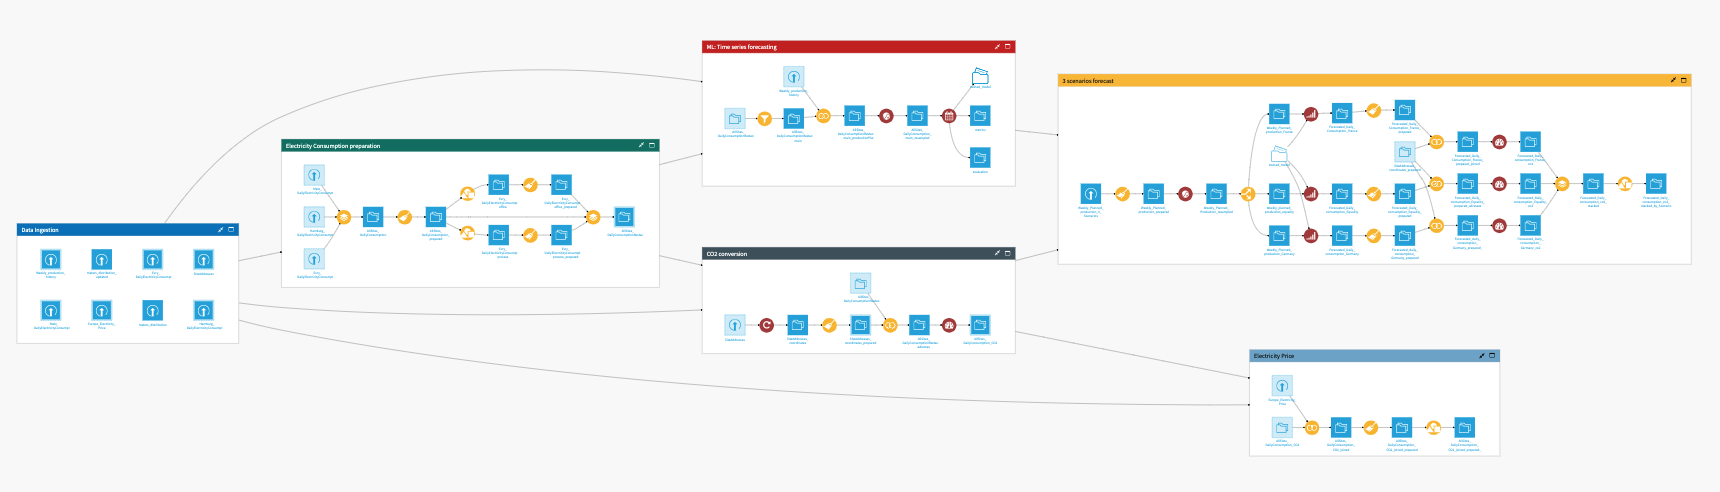
The project has the following high level steps:
Ingest and Prepare our Data
Convert Electricity Consumption to CO2 emissions
Compute the cost of electricity per factory
Train a time series model to be used in forecasting energy consumption and CO2 emissions
Forecast the CO2 emissions of 3 different production plans
Understand our factories’ CO2 emissions for the past, present, and future with Dashboard visualizations
Walkthrough
Note
In-depth technical details can be found in the wiki of the project.
Ingest and Preparing our Data
The first two flow zones of our project are fairly straightforward. We begin in the Data Ingestion flow zone by bringing in 8 initial datasets that are detailed in the previous Data Requirements section.
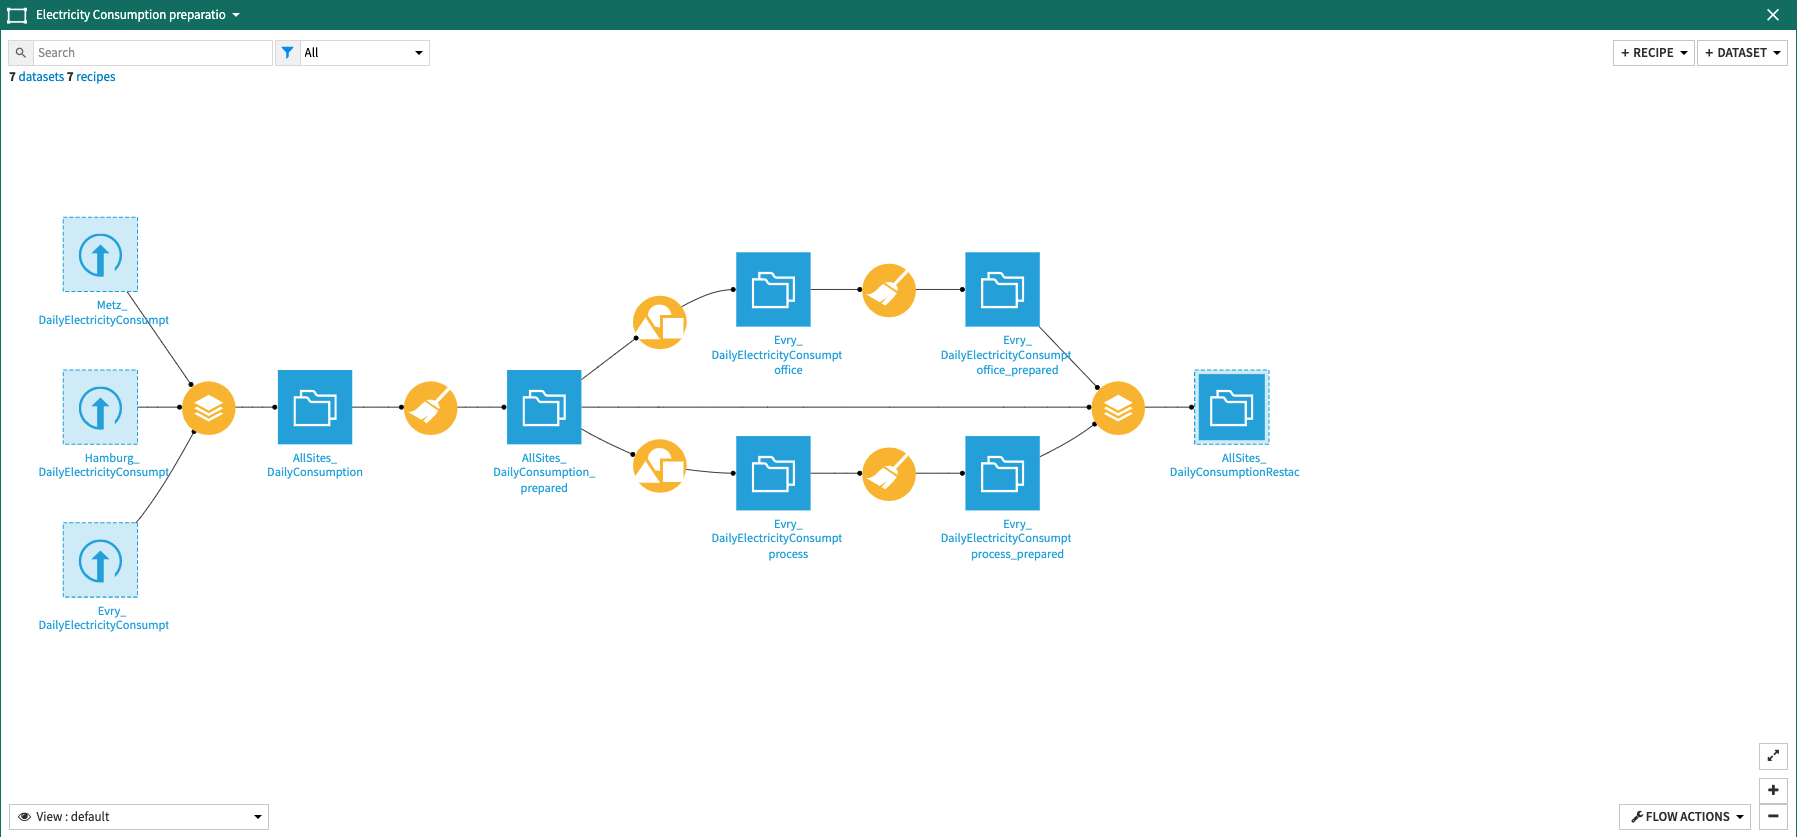
Now that we have access to all of our input datasets, we can take the 3 electricity consumption reports, each corresponding to a fictional factory, into the Electricity Consumption preparation flow zone. We first stack data from all 3 factories into a single AllSites_DailyConsumption dataset, prepare the dates, extract relevant components, and filter rows where electricity consumption is negative. When adapting this project for your own use, dates preparation and components extraction will need to be updated according to your own data. In this flow, we then create 3 sub branches in order to showcase how to create a ‘soft sensor’ meter that aggregates consumptions from different meters. All data is then restacked to have a finalized dataset containing electricity consumption values for all 3 factories.
The Costs of Electricity Consumption: CO2 Emissions and Monetary Value
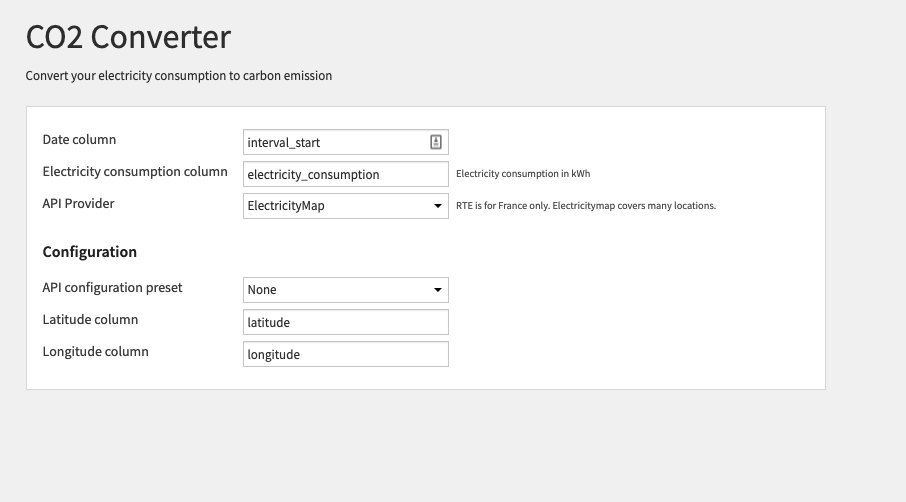
Now that we have a dataset with electricity consumption for all factories (AllSites_DailyConsumptionRestac), we can convert our electricity consumption into its resulting CO2 Emissions. Computation of CO2 Emissions, however, also relies on knowing where the Electricity was consumed. Therefore, we begin in the CO2 conversion zone by taking the SiteAddresses input dataset as an input to the Geocoder Plugin to retrieve the latitude/longitude coordinates of our 3 factories. We then append this location data to the dataset containing our factories’ electricity consumption before, finally, using the CO2 Converter Plugin to convert electricity consumption to CO2. The resulting dataset, AllSites_DailyConsumption_CO2, contains 3 new columns:
co2_date_time
carbon_intensity (gCO₂eq/kWh)
co2_emission (kgCO₂eq)
In addition to computing the CO2 emissions of all our factories, we can also get an understanding of the monetary costs generated by our factories’ electricity consumption. By joining the AllSites_DailyConsumption_CO2 dataset with the Europe_Electricity_Price dataset in the Electricity Price flow zone we can compute the total price per factories and aggregate per factory on a year by year basis.
Smart Production Planning: Forecasting the Future
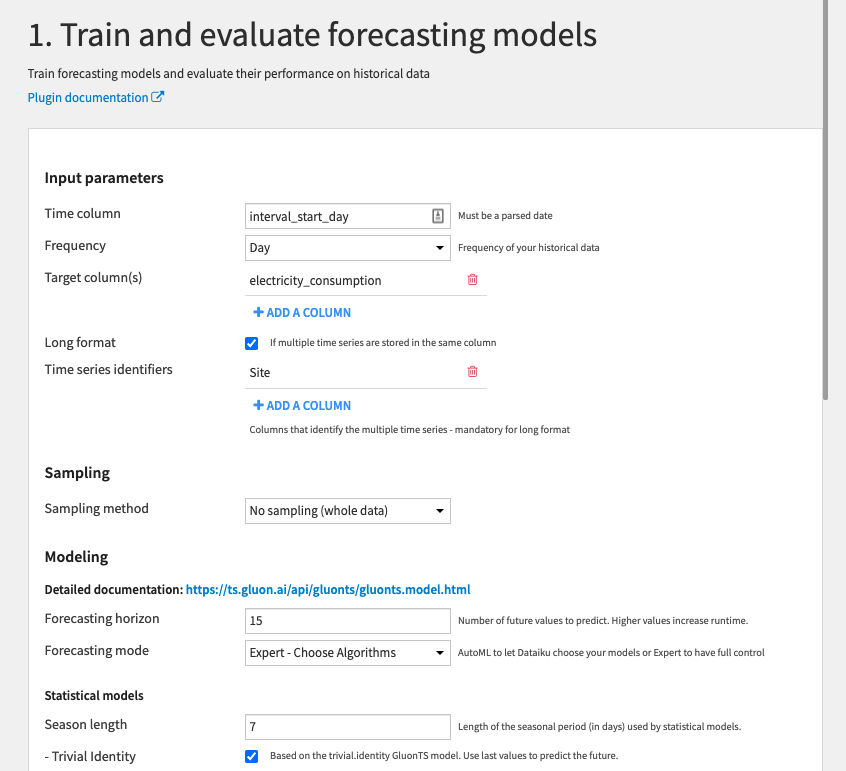
The ML: Time series forecasting flow zone sees us training a time series forecasting model using the Time series plugin. Before training, however, we first filter the electricity consumption dataset on the main meters of the 3 factories: process_main, main_a, and factory_main. While the prediction in this project will be made at a site level, a prediction could also be done at the meters or workshops levels. Post-filter we bring in the Weekly_production_history dataset to be used as an external feature for forecasting so that the model can better decompose the input signal. We also use the Time Series Preparation Plugin to interpolate the data to align our time series on a fixed sampling rate. With our data sufficiently prepared, we are ready to train a forecasting model. The outputs of our trained model are:
Evaluation dataset: Evaluation forecasts used to compute the performance metrics. This dataset is used to build a visualization representing the model fitting performance.
Metrics dataset: Resulting evaluation of the models using the historical dataset.
Trained model folder
In this solution we use the model in order to forecast the daily electricity consumption, and resulting CO2 emissions of 3 different production plans. In doing so smarter decisions can be made with regards to selecting production plans that will result in a lower amount of CO2 emissions. The 3 scenarios forecast flow zone looks very complex at first but is actually a repeating pattern. To begin we upload a dataset containing 3 possible production scenarios which is then resampled and split by each scenario into 3 branches. Each branch employs the same 4 steps:
Use the trained model to forecast future consumption values
Prepare the forecasted data to have all electricity consumption (past and future) in the same column
Enrich the prepared data with coordinates of the factories
Convert Electricity Consumption into CO2 emissions using the plugin
After completion of these 4 steps in parallel, the 3 scenarios are stacked into a single dataset and aggregated by factory and scenario.
Reducing Our Carbon Footprint: Past, Present, and Future Emissions
This solutions come with 5 tabs in a pre-built dashboard meant to enable central energy managers to understand the global consumption and emissions of multiple sites by visualizing the resulting analytics of the flow in a clear, interactive, and shareable manner.
The Carbon intensity in Europe tab was built by ElectricityMap who enabled us to embed their interactive Carbon intensity map in the first tab of our dashboard. With this tab, you can confirm whether or not the location of your factory is included in the ElectricityMap API
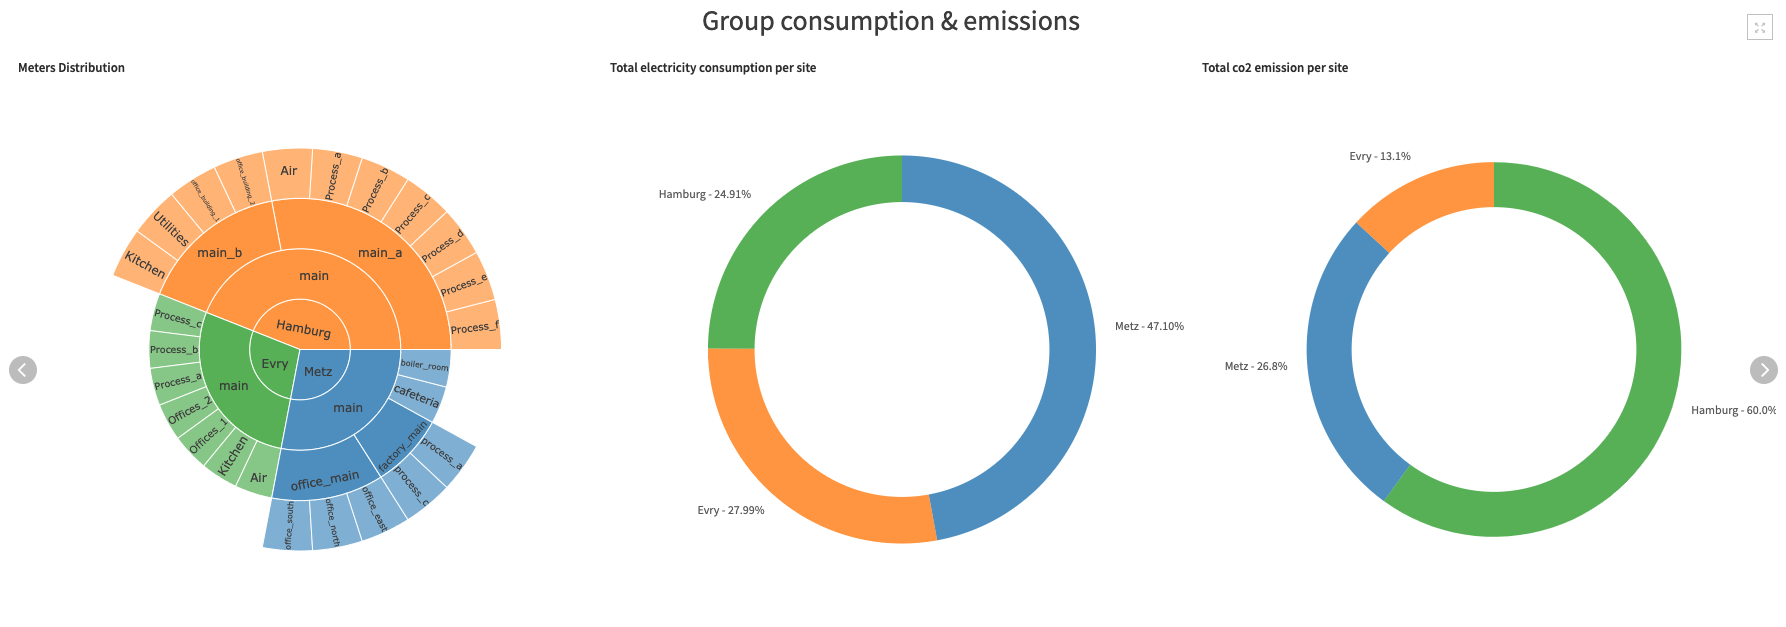
The second tab Group consumptions and emissions includes several visualizations that show the total electricity consumption and CO2 emissions per site, as well as the impact of production in different countries. Additionally, an interactive sunburst chart can be used to understand the initial distribution of the meters in the 3 factories.
We can drill down to a per factory level with the Main consumers per factories tab in order to see the main consumers of each production site. A second sunburst chart can be interacted with to see the update distribution of the meters at each factory.
The Machine learning evaluation tab shows the current quantity produced by each site, the result of the model, and the resulting prediction for each site.
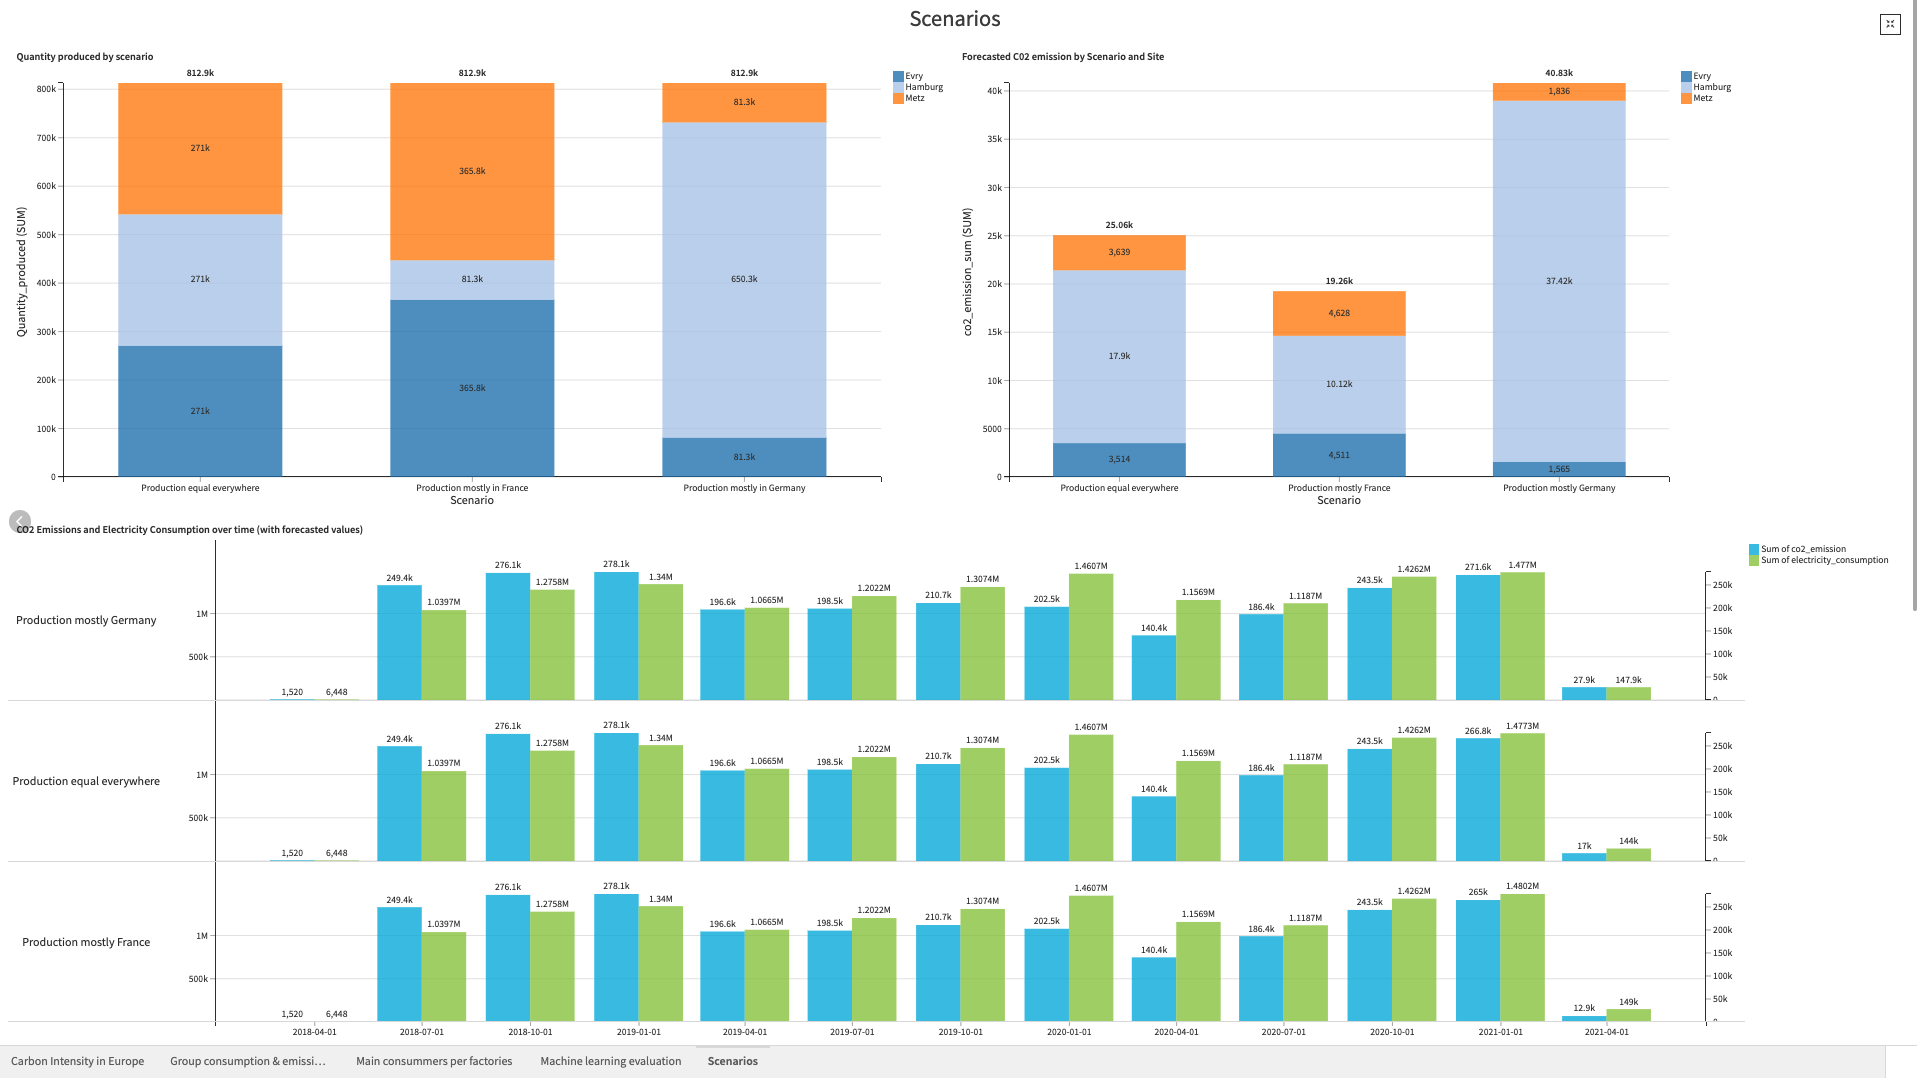
Lastly, the Scenarios tab can be used to view a summary of the 3 production plans, as well as a visualization comparing production in Germany vs. France.
Some additional insights that were not included in the dashboard due to redundancy are available in the Charts tab of the AllSites_DailyConsumption_CO2_joined_prepared_ dataset.
Reproducing these Processes With Minimal Effort For Your Own Data
The intent of this project is to enable understanding of how Dataiku DSS can be used to create analysis of global consumption and CO2 emissions in order to reduce cumulative CO2 emissions of factories. By creating a singular solution that can benefit and influence the decisions of a variety of teams in a single organization, smarter and more holistic production plans can be developed and tested.
We’ve provided several suggestions on how to use electricity consumption and pricing data to compute and predict CO2 emissions. If you’re interested in adapting this project to the specific goals and needs of your organization, roll-out and customization services can be offered on demand.