Concept: Analyze

Tip
This content is also included in the free Dataiku Academy course, Basics 101, which is part of the Core Designer learning path. Register for the course there if you’d like to track and validate your progress alongside concept videos, summaries, hands-on tutorials, and quizzes.
From the Explore tab of a dataset, you can begin to investigate the values of any column in your dataset using the Analyze window. You can access the Analyze window from the context menu of a column header. By default, DSS calculates statistics shown in the Analyze window using the dataset sample.
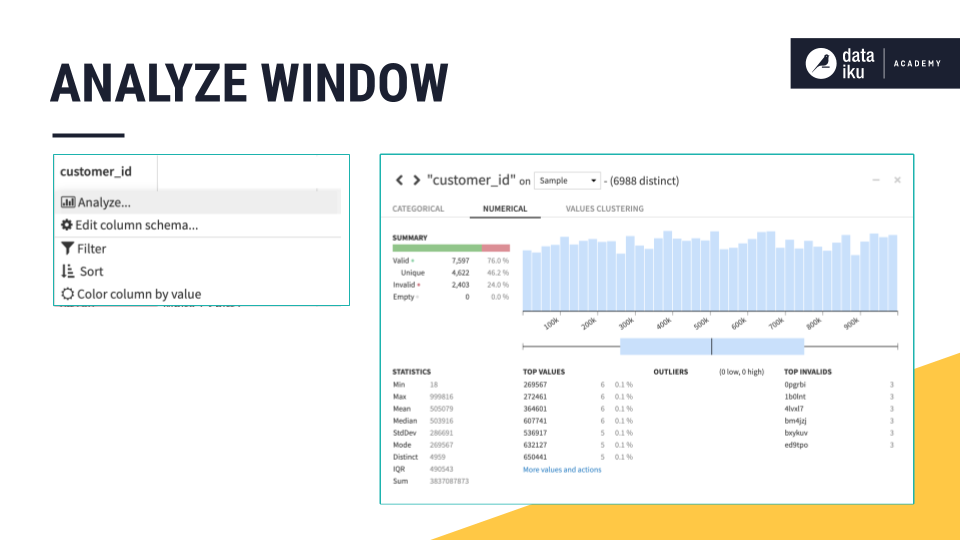
Data quality is one area into which the Analyze window provides insight. It reveals the number of valid, invalid, and empty values, as well as those values which appear only once.
Numeric columns plot a histogram and boxplot of the distribution. Categorical columns plot a bar chart, sorted by the most frequent observations.
The window also provides summary statistics, counts of the most frequent values, and recognition of outliers.
By default, these statistics are calculated from the current sample configured in the Explore tab. It is also possible, however, to compute them on the whole dataset.
Learn More
In this lesson, you learned how to access the Analyze window from the Explore tab of a dataset to see statistics and the quality of a data sample. Continue learning about the Basics of Dataiku DSS by visiting Concept: Charts.