Hands-On Tutorial: Create a Visual Dataiku Application
Create Your Project
From the Dataiku homepage, choose +New Project > DSS Tutorials > Advanced Designer > Dataiku Applications (Tutorial).
Note
You can also download the starter project from this website and import it as a zip file.
This project has a fully built-out Flow that:
Downloads data from the UCI Machine Learning Repository.
Lightly processes the data in a Prepare recipe, then branches into two sub-Flows:
The Monthly Forecasting sub-Flow models the monthly sales and produces forecasts from the for_predictions dataset.
The One Customer’s Invoices sub-Flow contains a filter to look at historical data for a given customer.
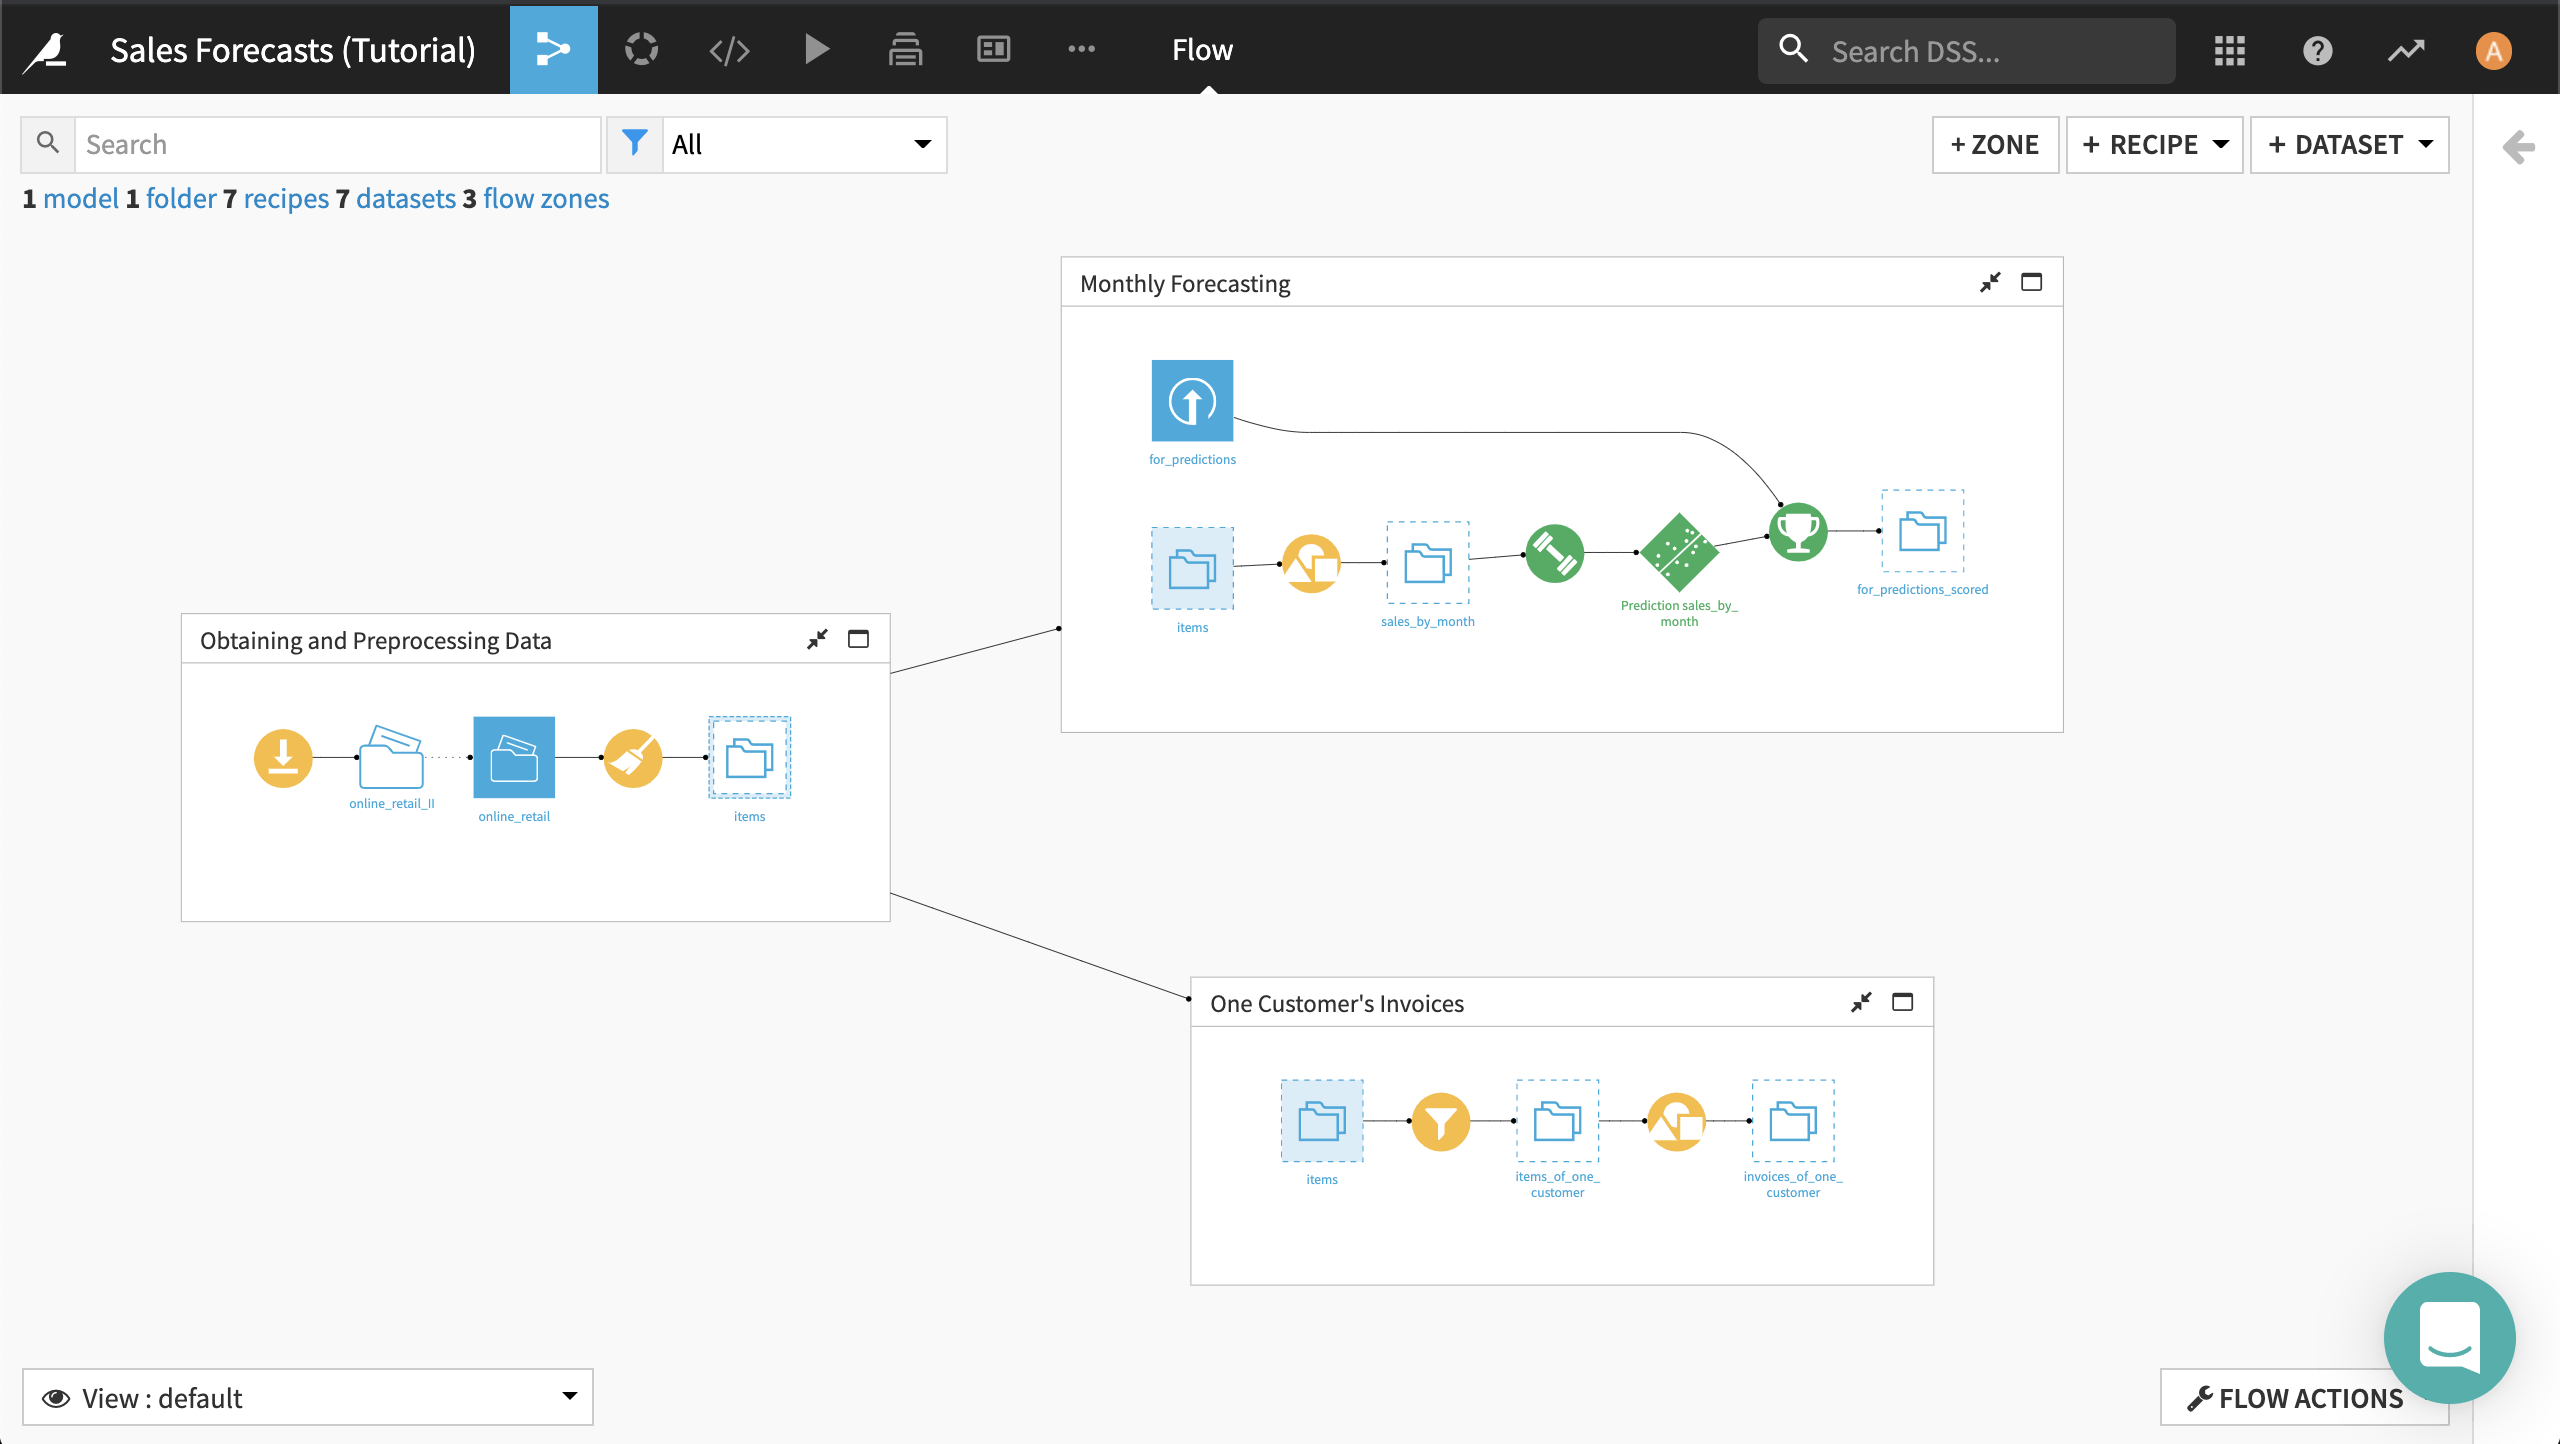
Build out the entire Flow, such as through the Flow Actions menu in the bottom right corner.
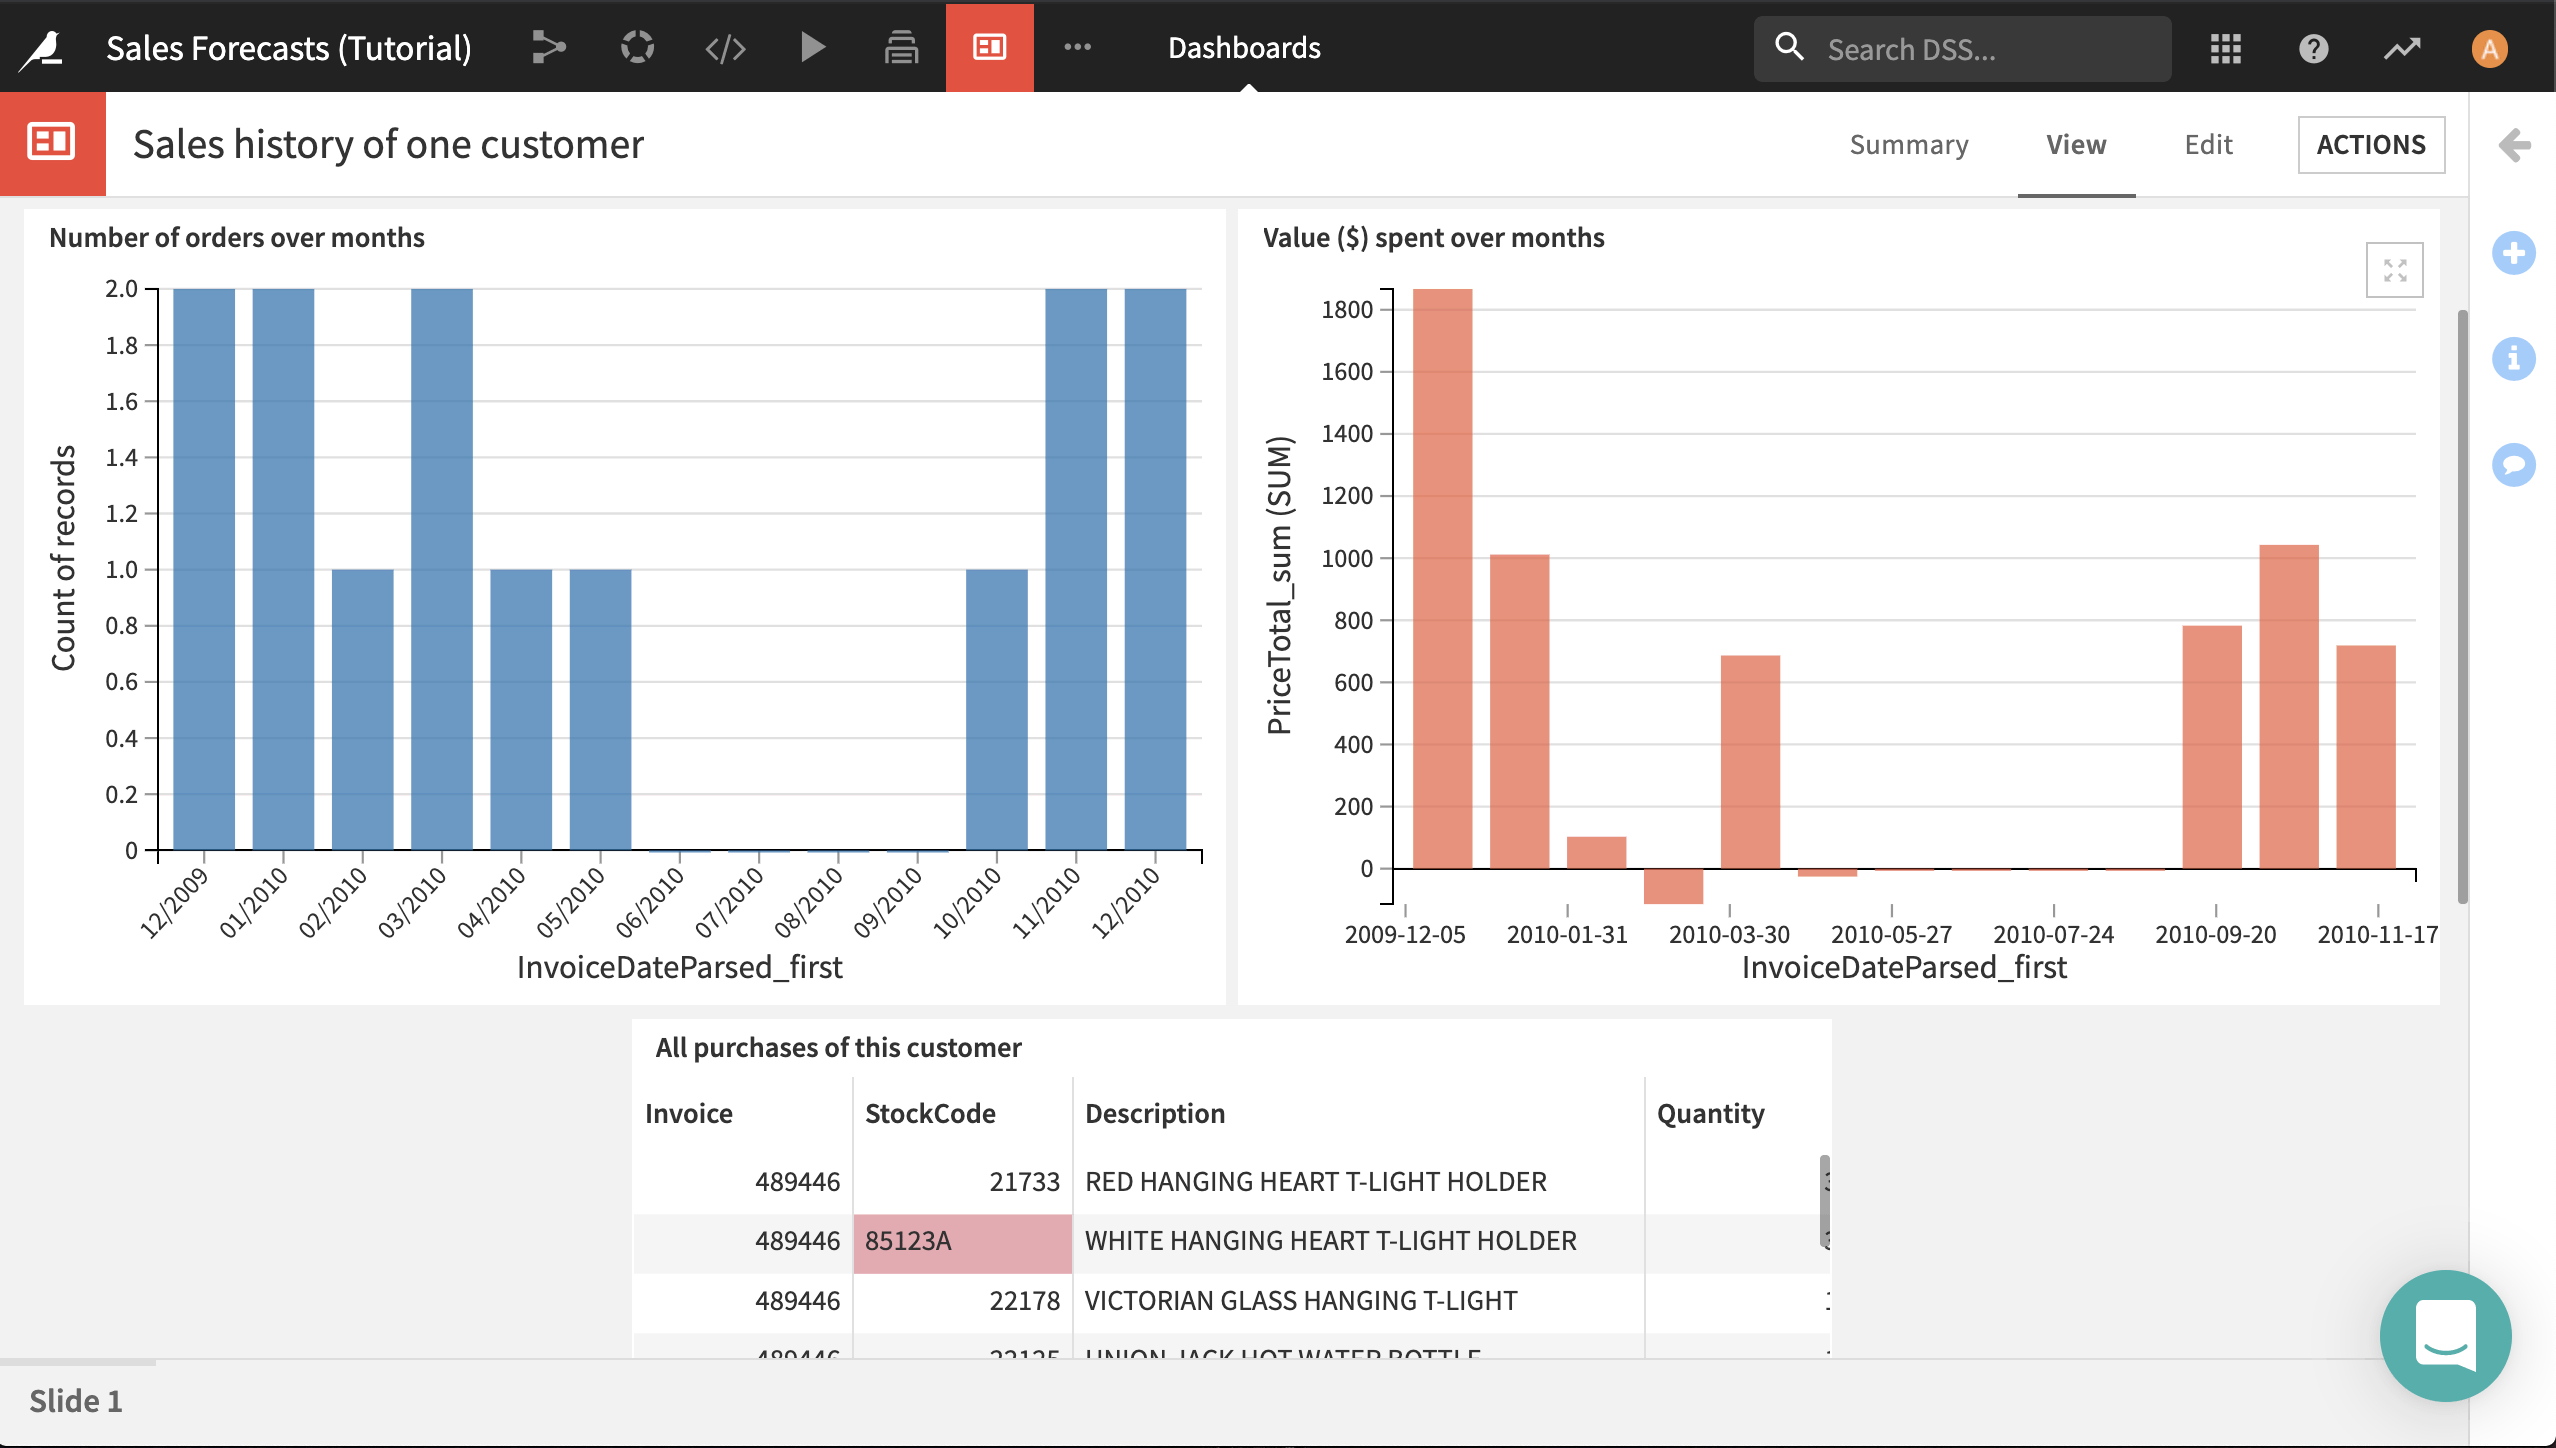
Look at the two dashboards, one for each sub-Flow.
We’re going to turn this project into a Dataiku Application so that colleagues can make use of the project without needing to understand the details of the project.
First we’ll make the scoring available.
Then we’ll add the historical order data for a single customer.
Convert to a Dataiku App
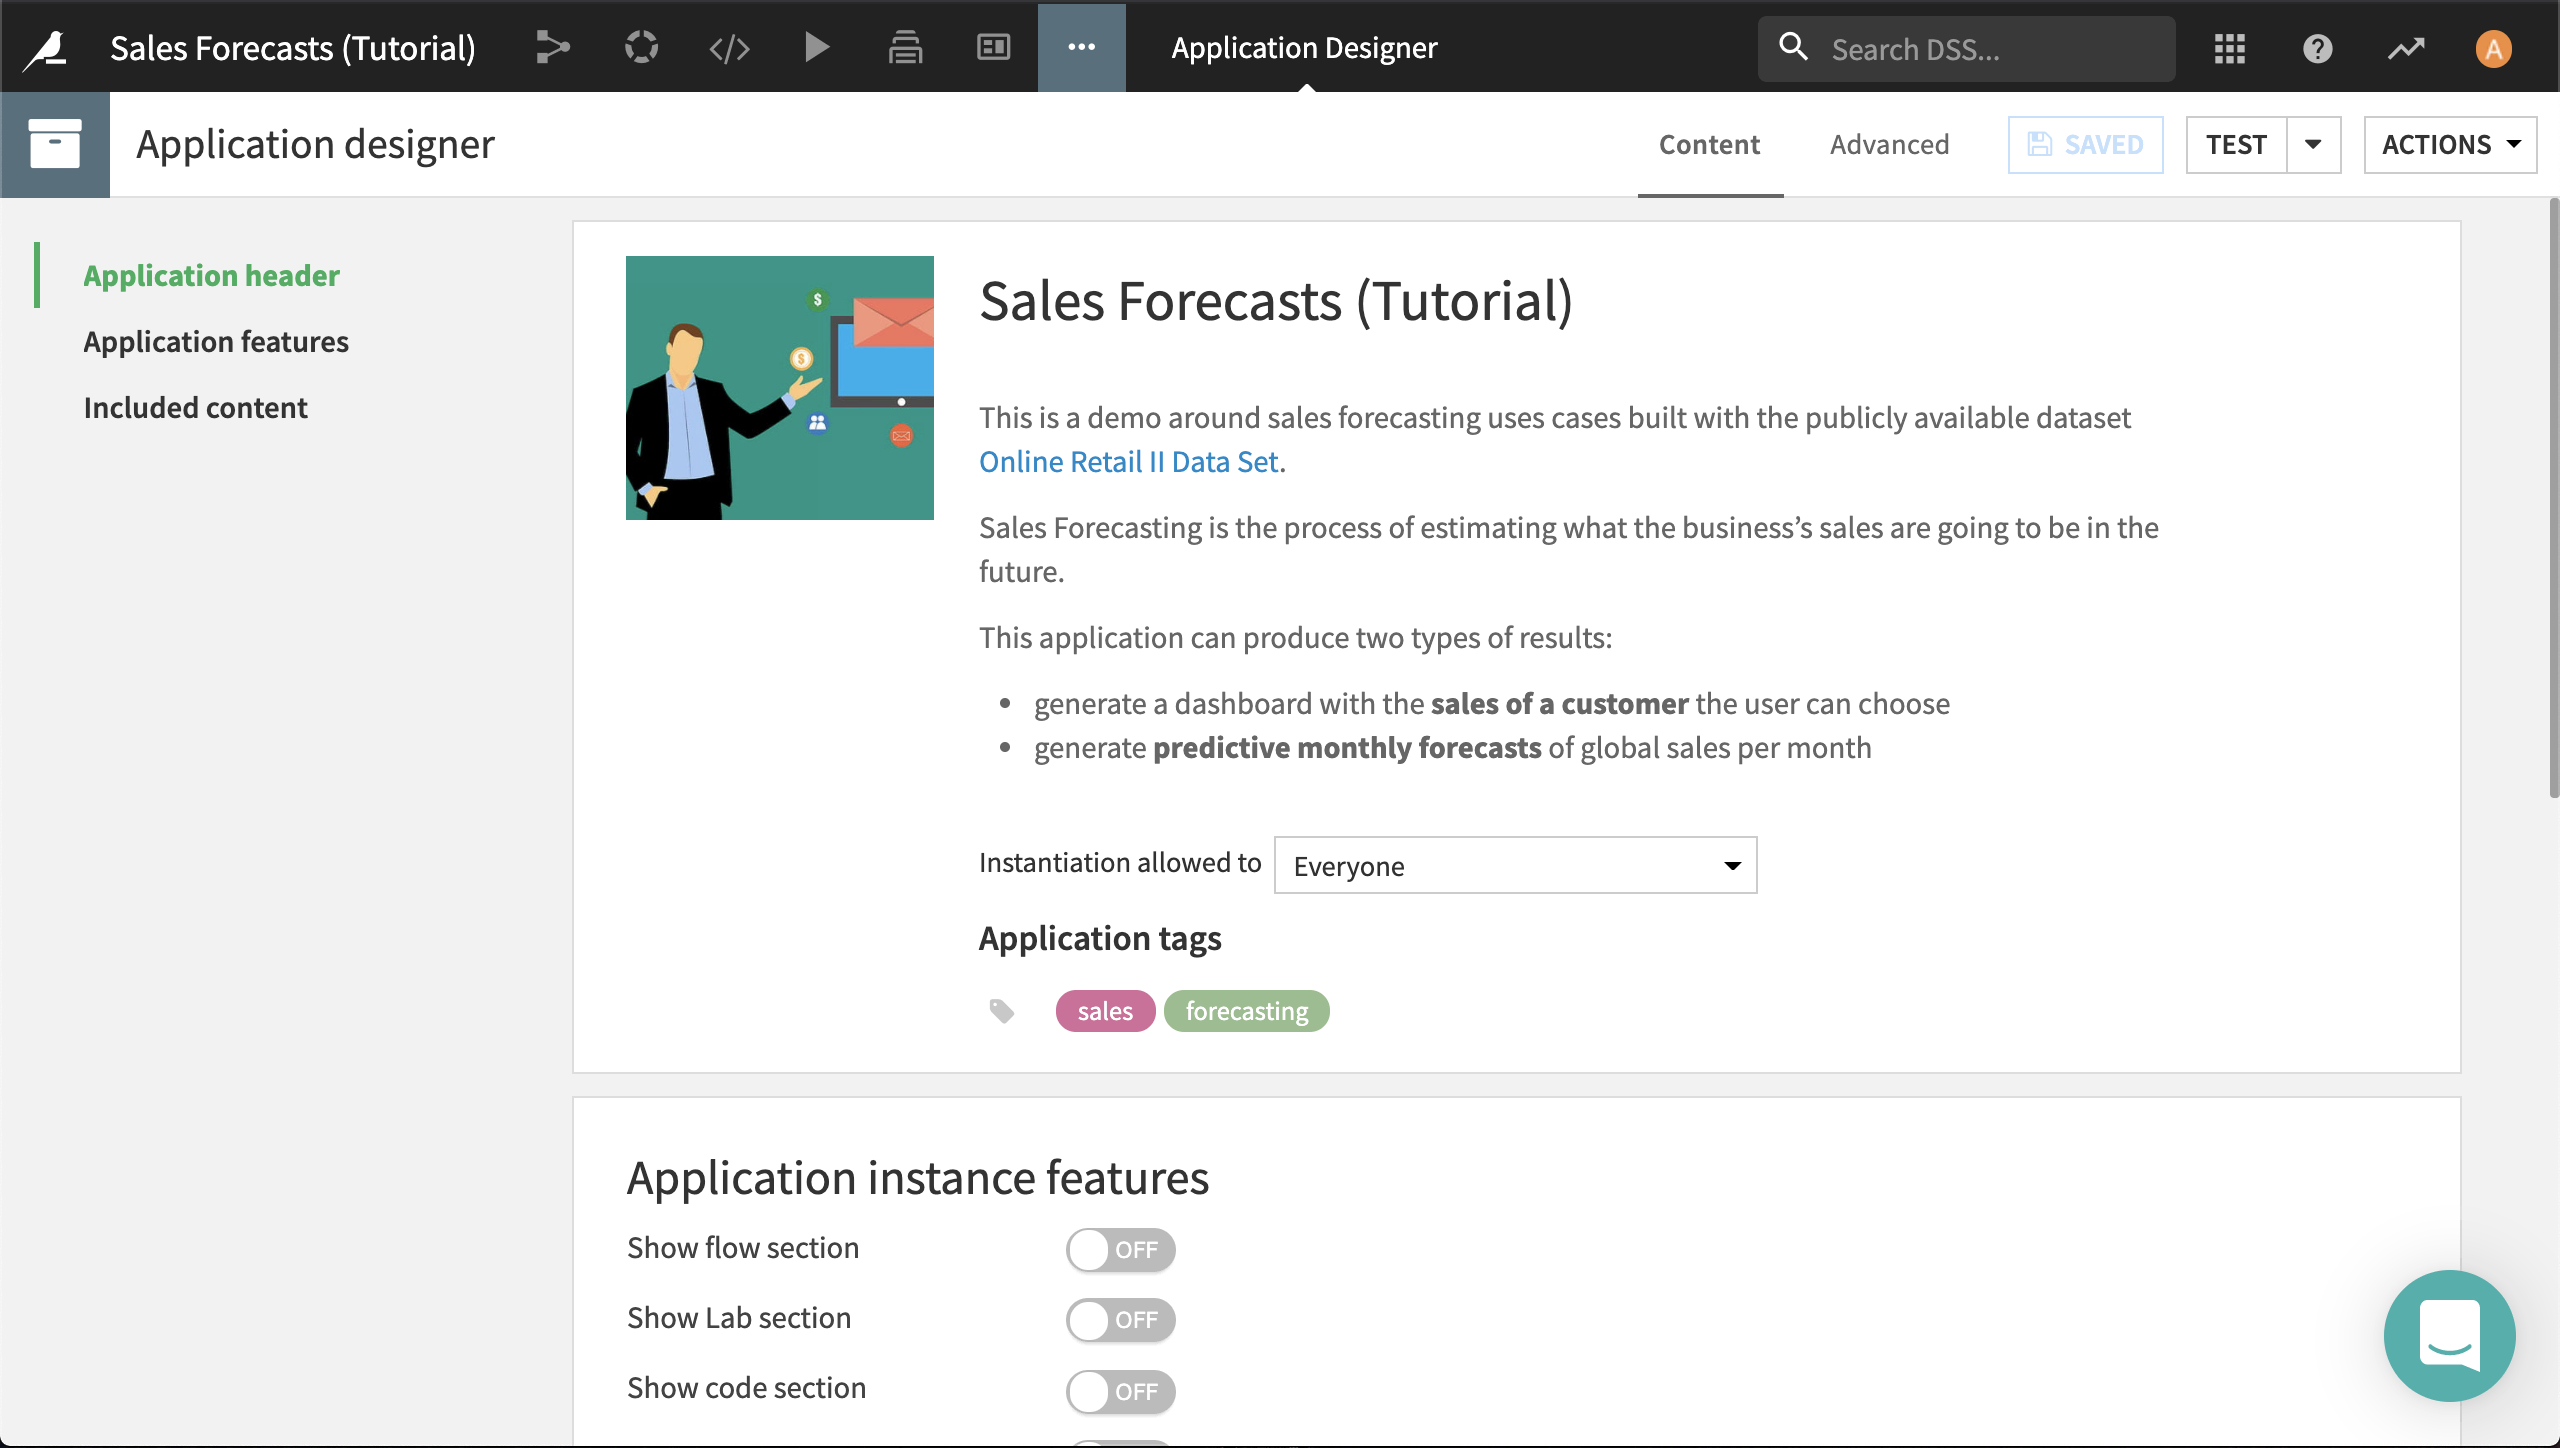
From the top navigation bar, select the More Options menu (…) > Application Designer, and select Convert into a visual application.
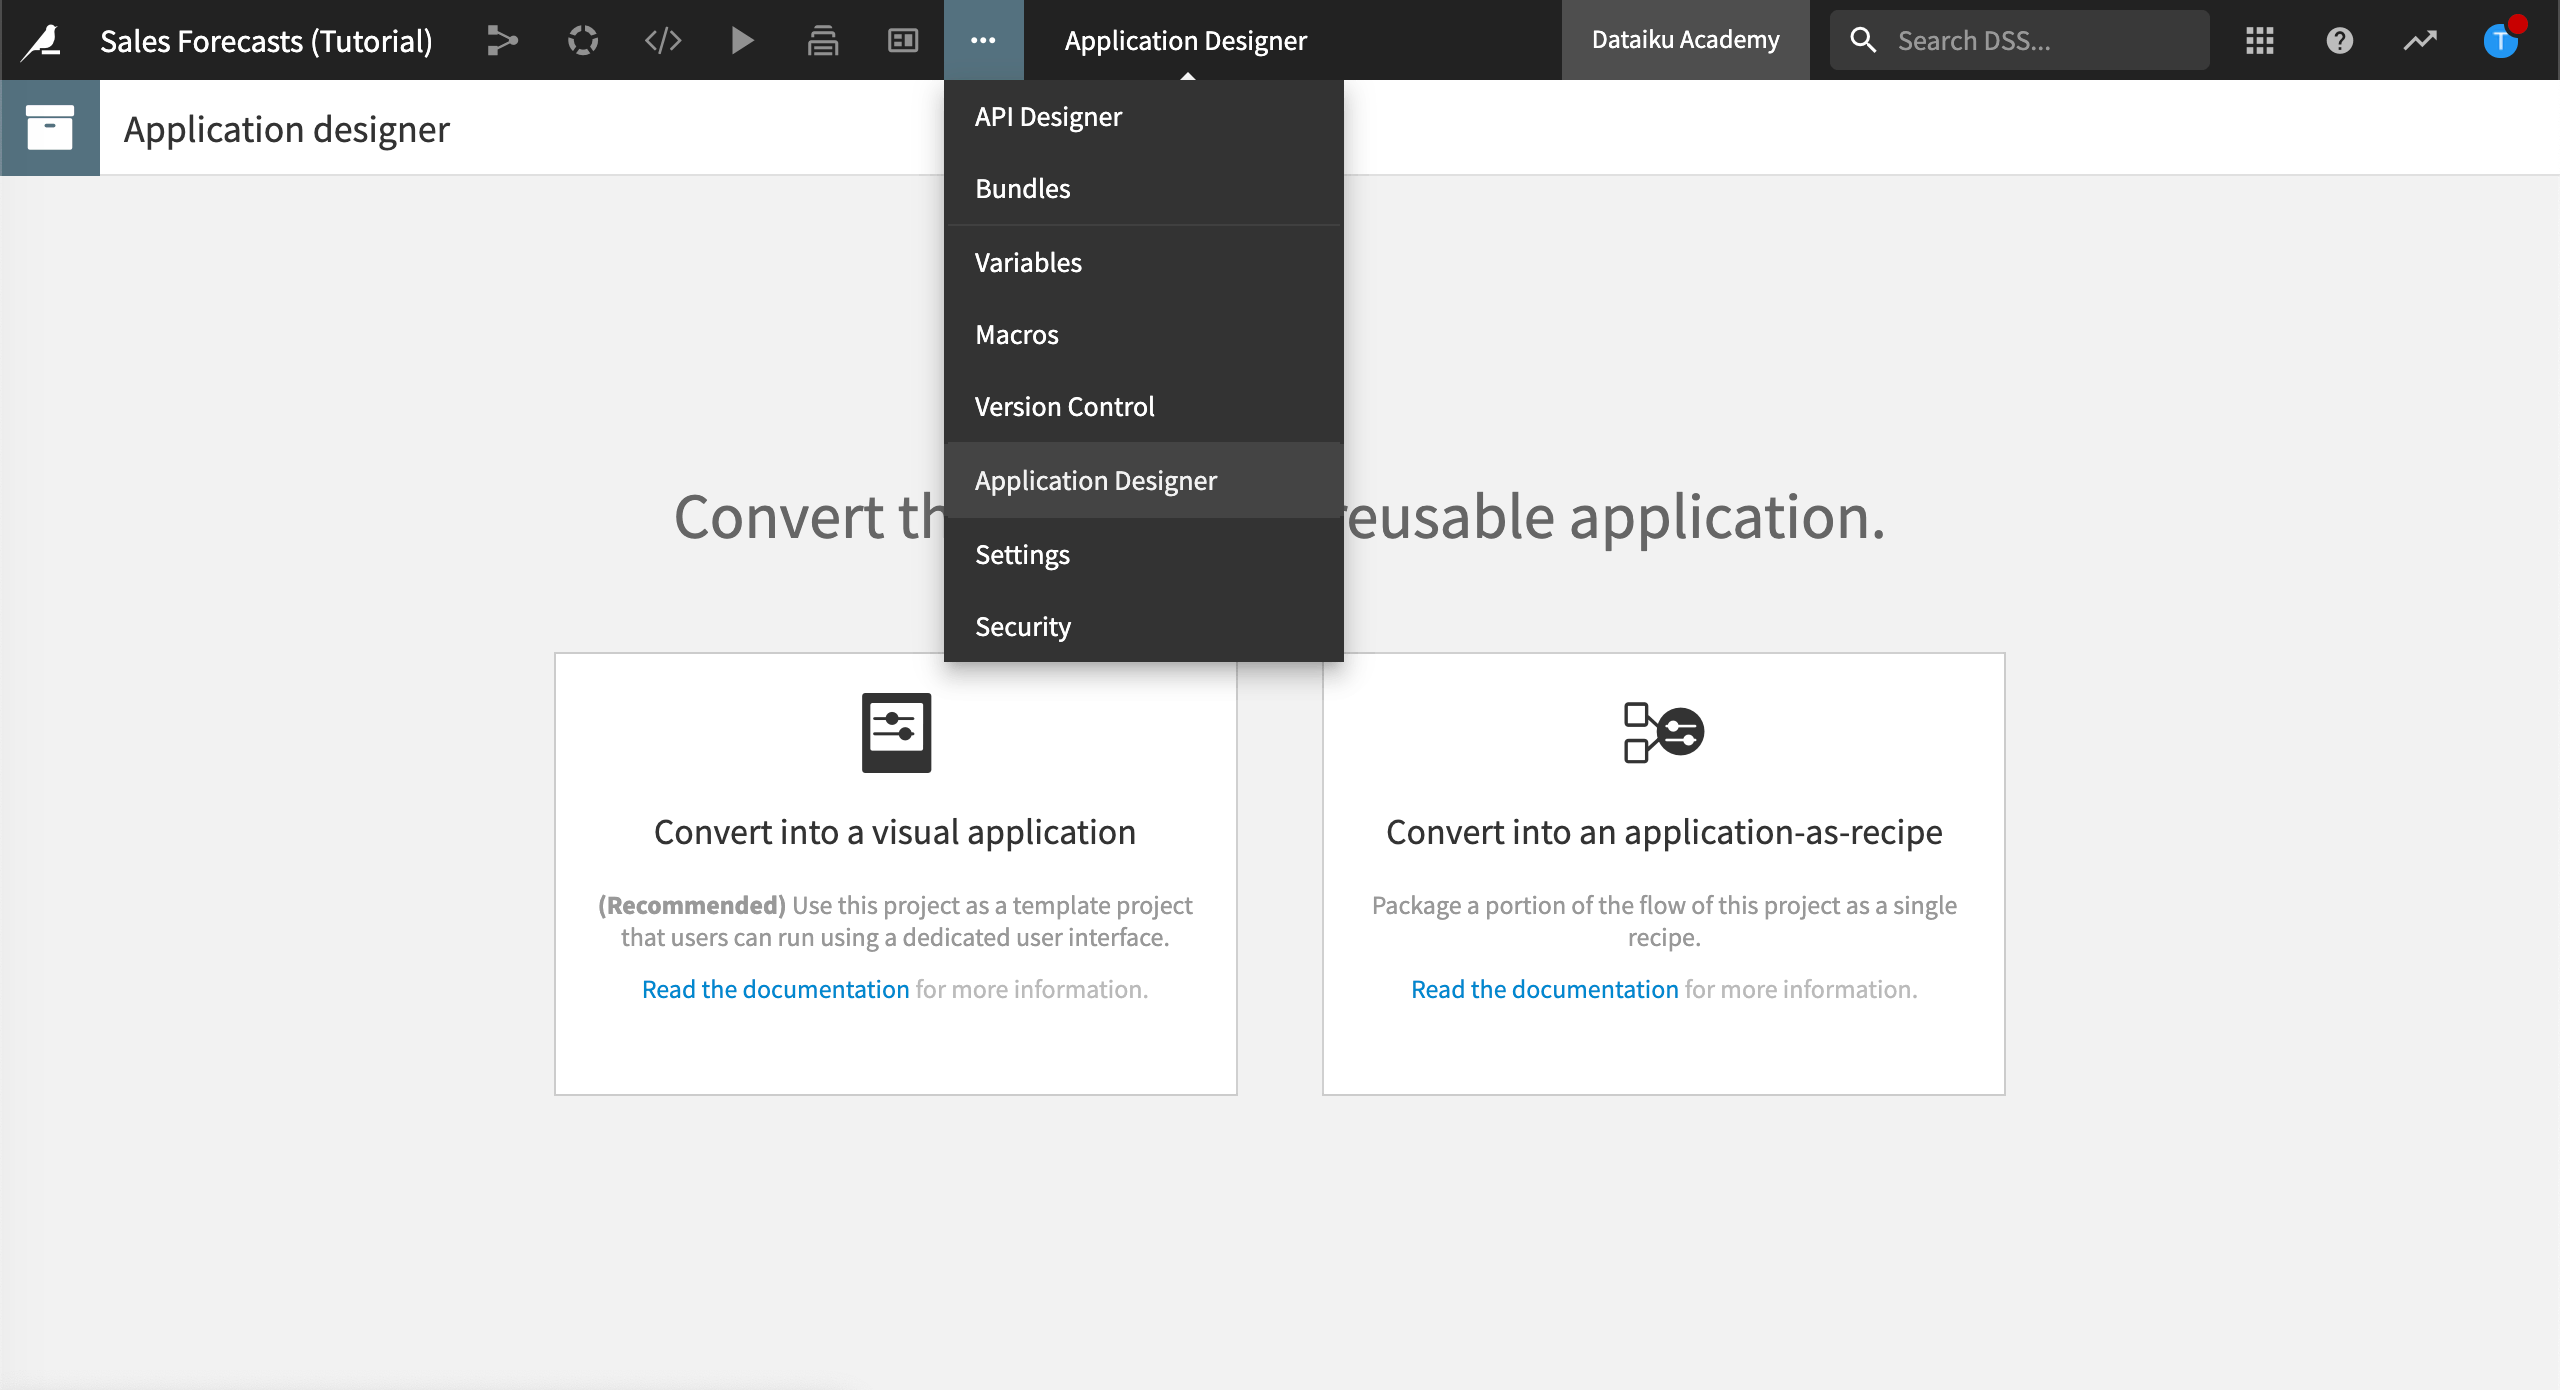
Instead of certain users, allow Everyone to instantiate the app.
Add tags like
salesandforecasting.Optionally, give the application a description, like in the image below.
Generate Forecasts
Now let’s define the application UI for generating forecasts.
Click Add Section at the bottom of the page.
Name it
Monthly sales forecast.Give it a description like
Generate predictive sales by month for the total sales of goods.Click Add Tile > View dashboard.
Give it a title like
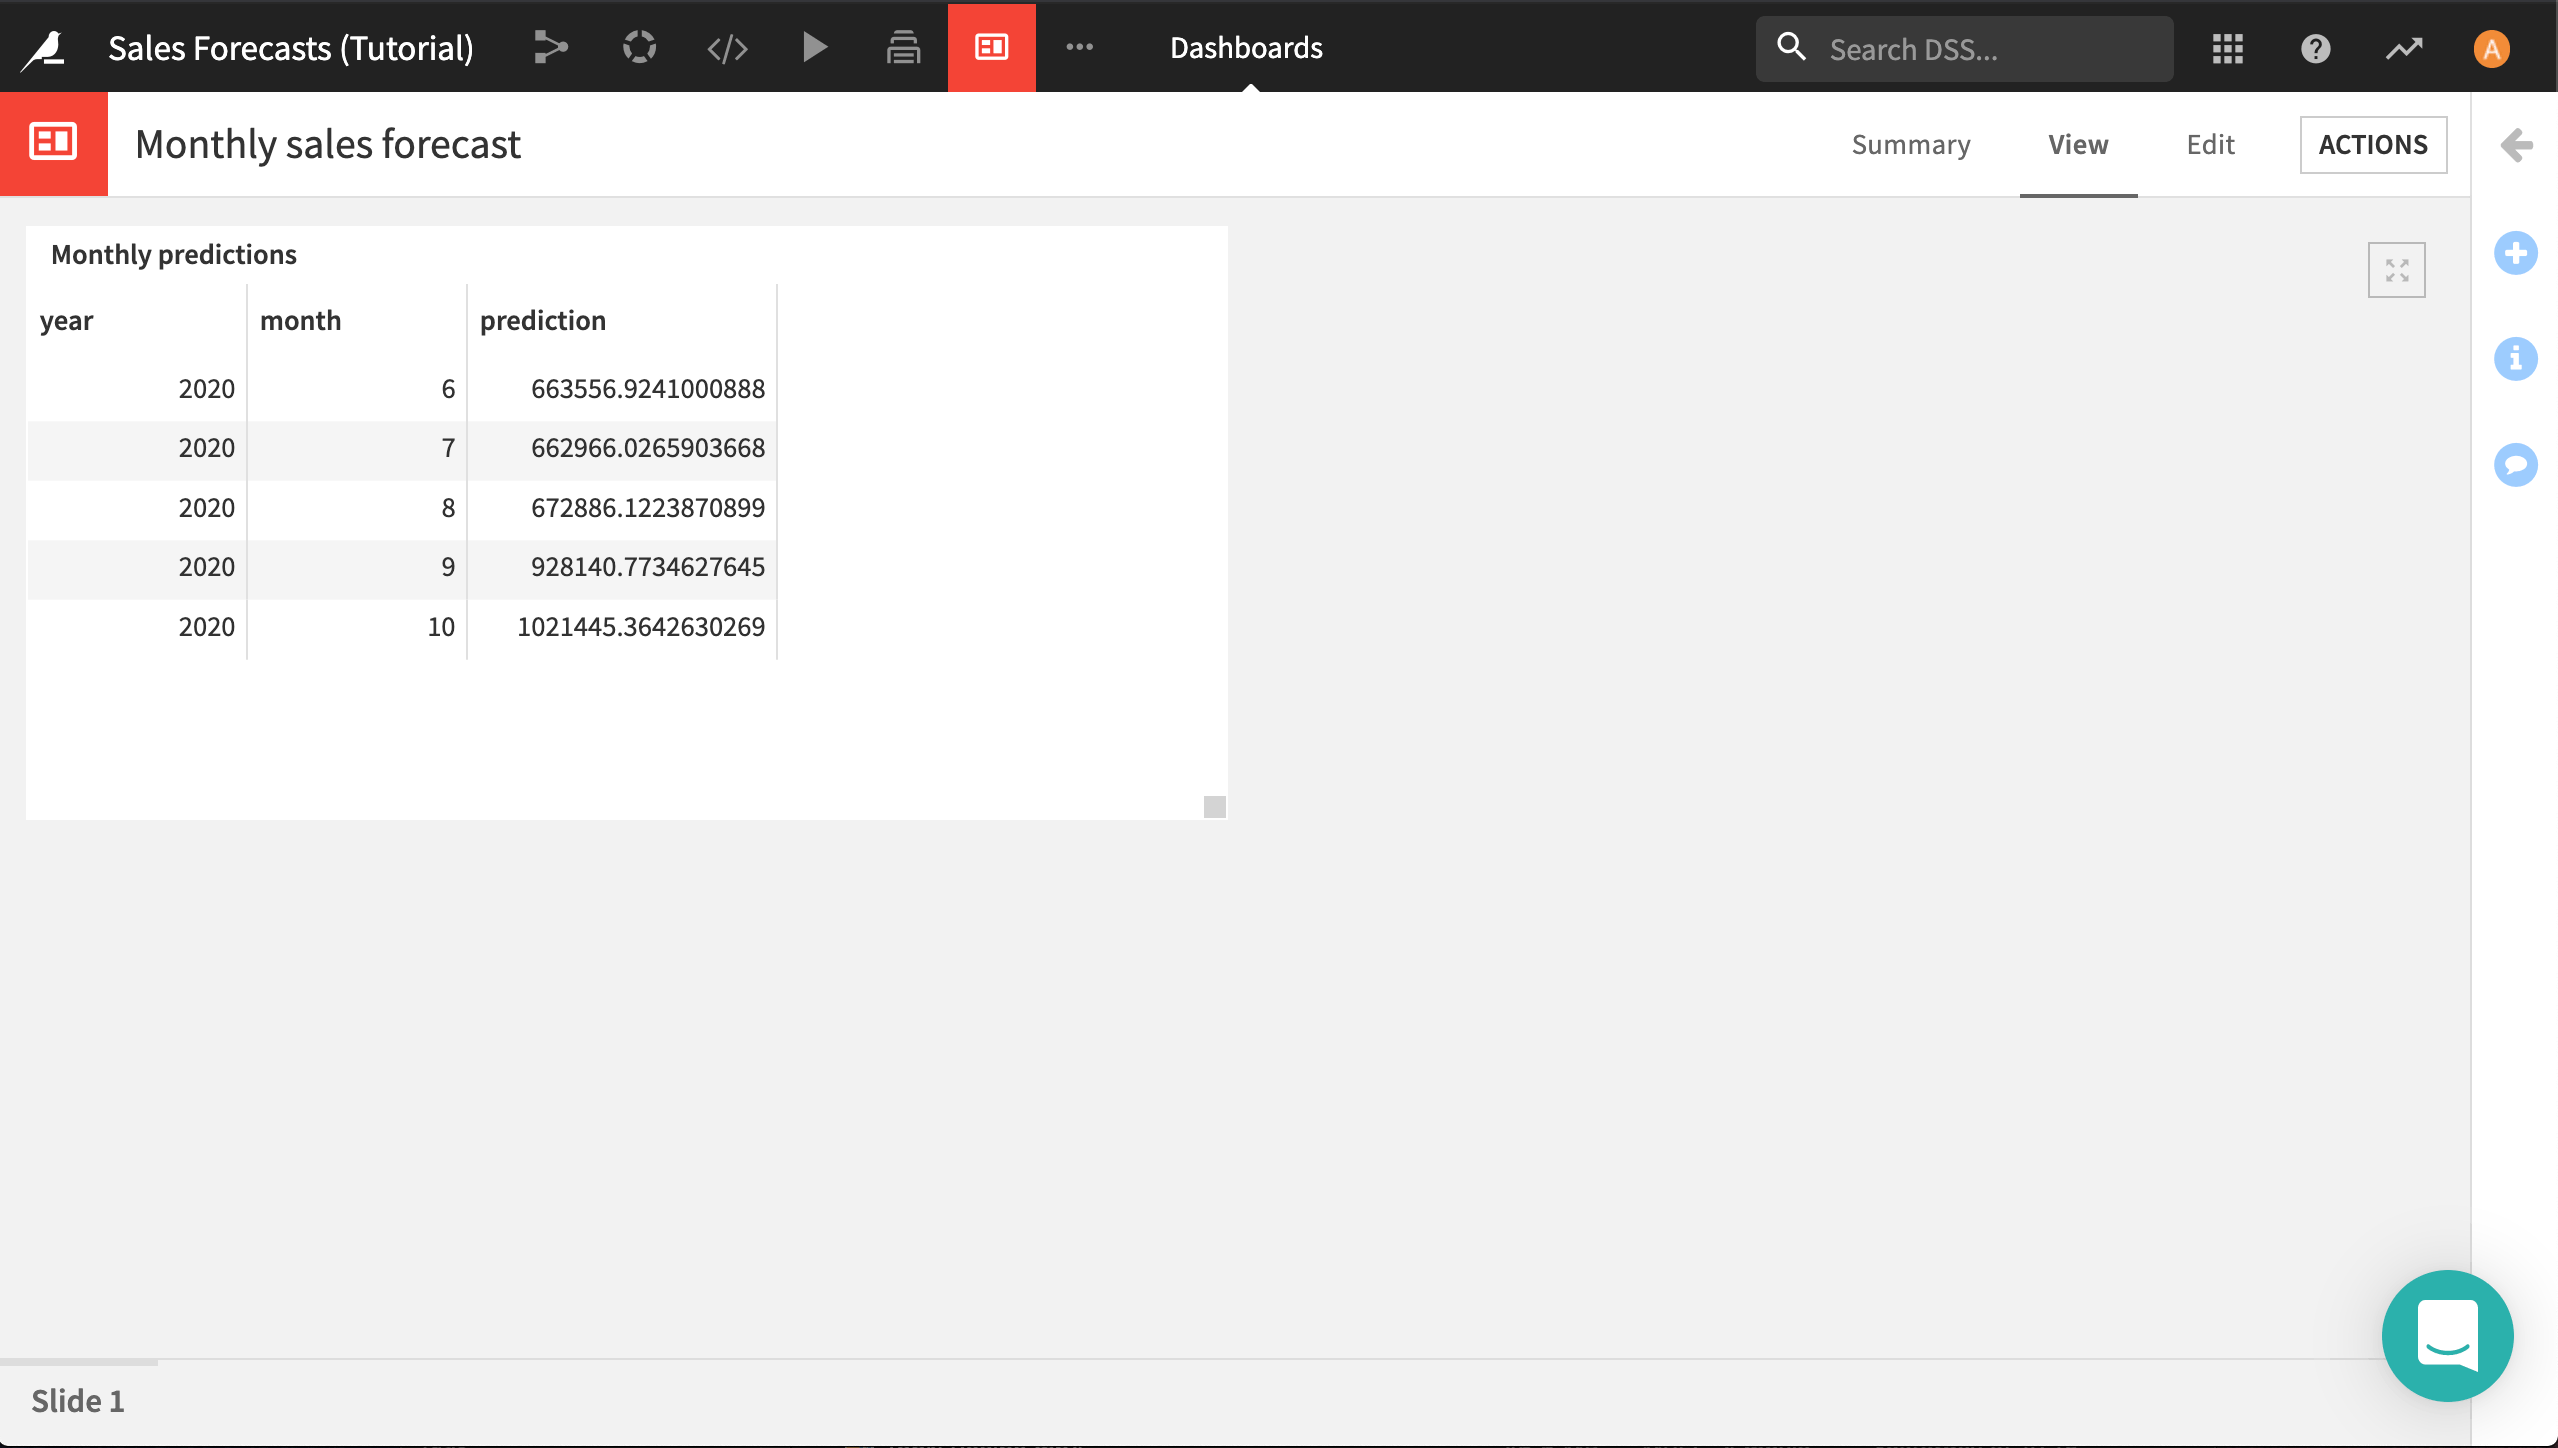
See results in dashboard.Choose the “Monthly sales forecast” dashboard.
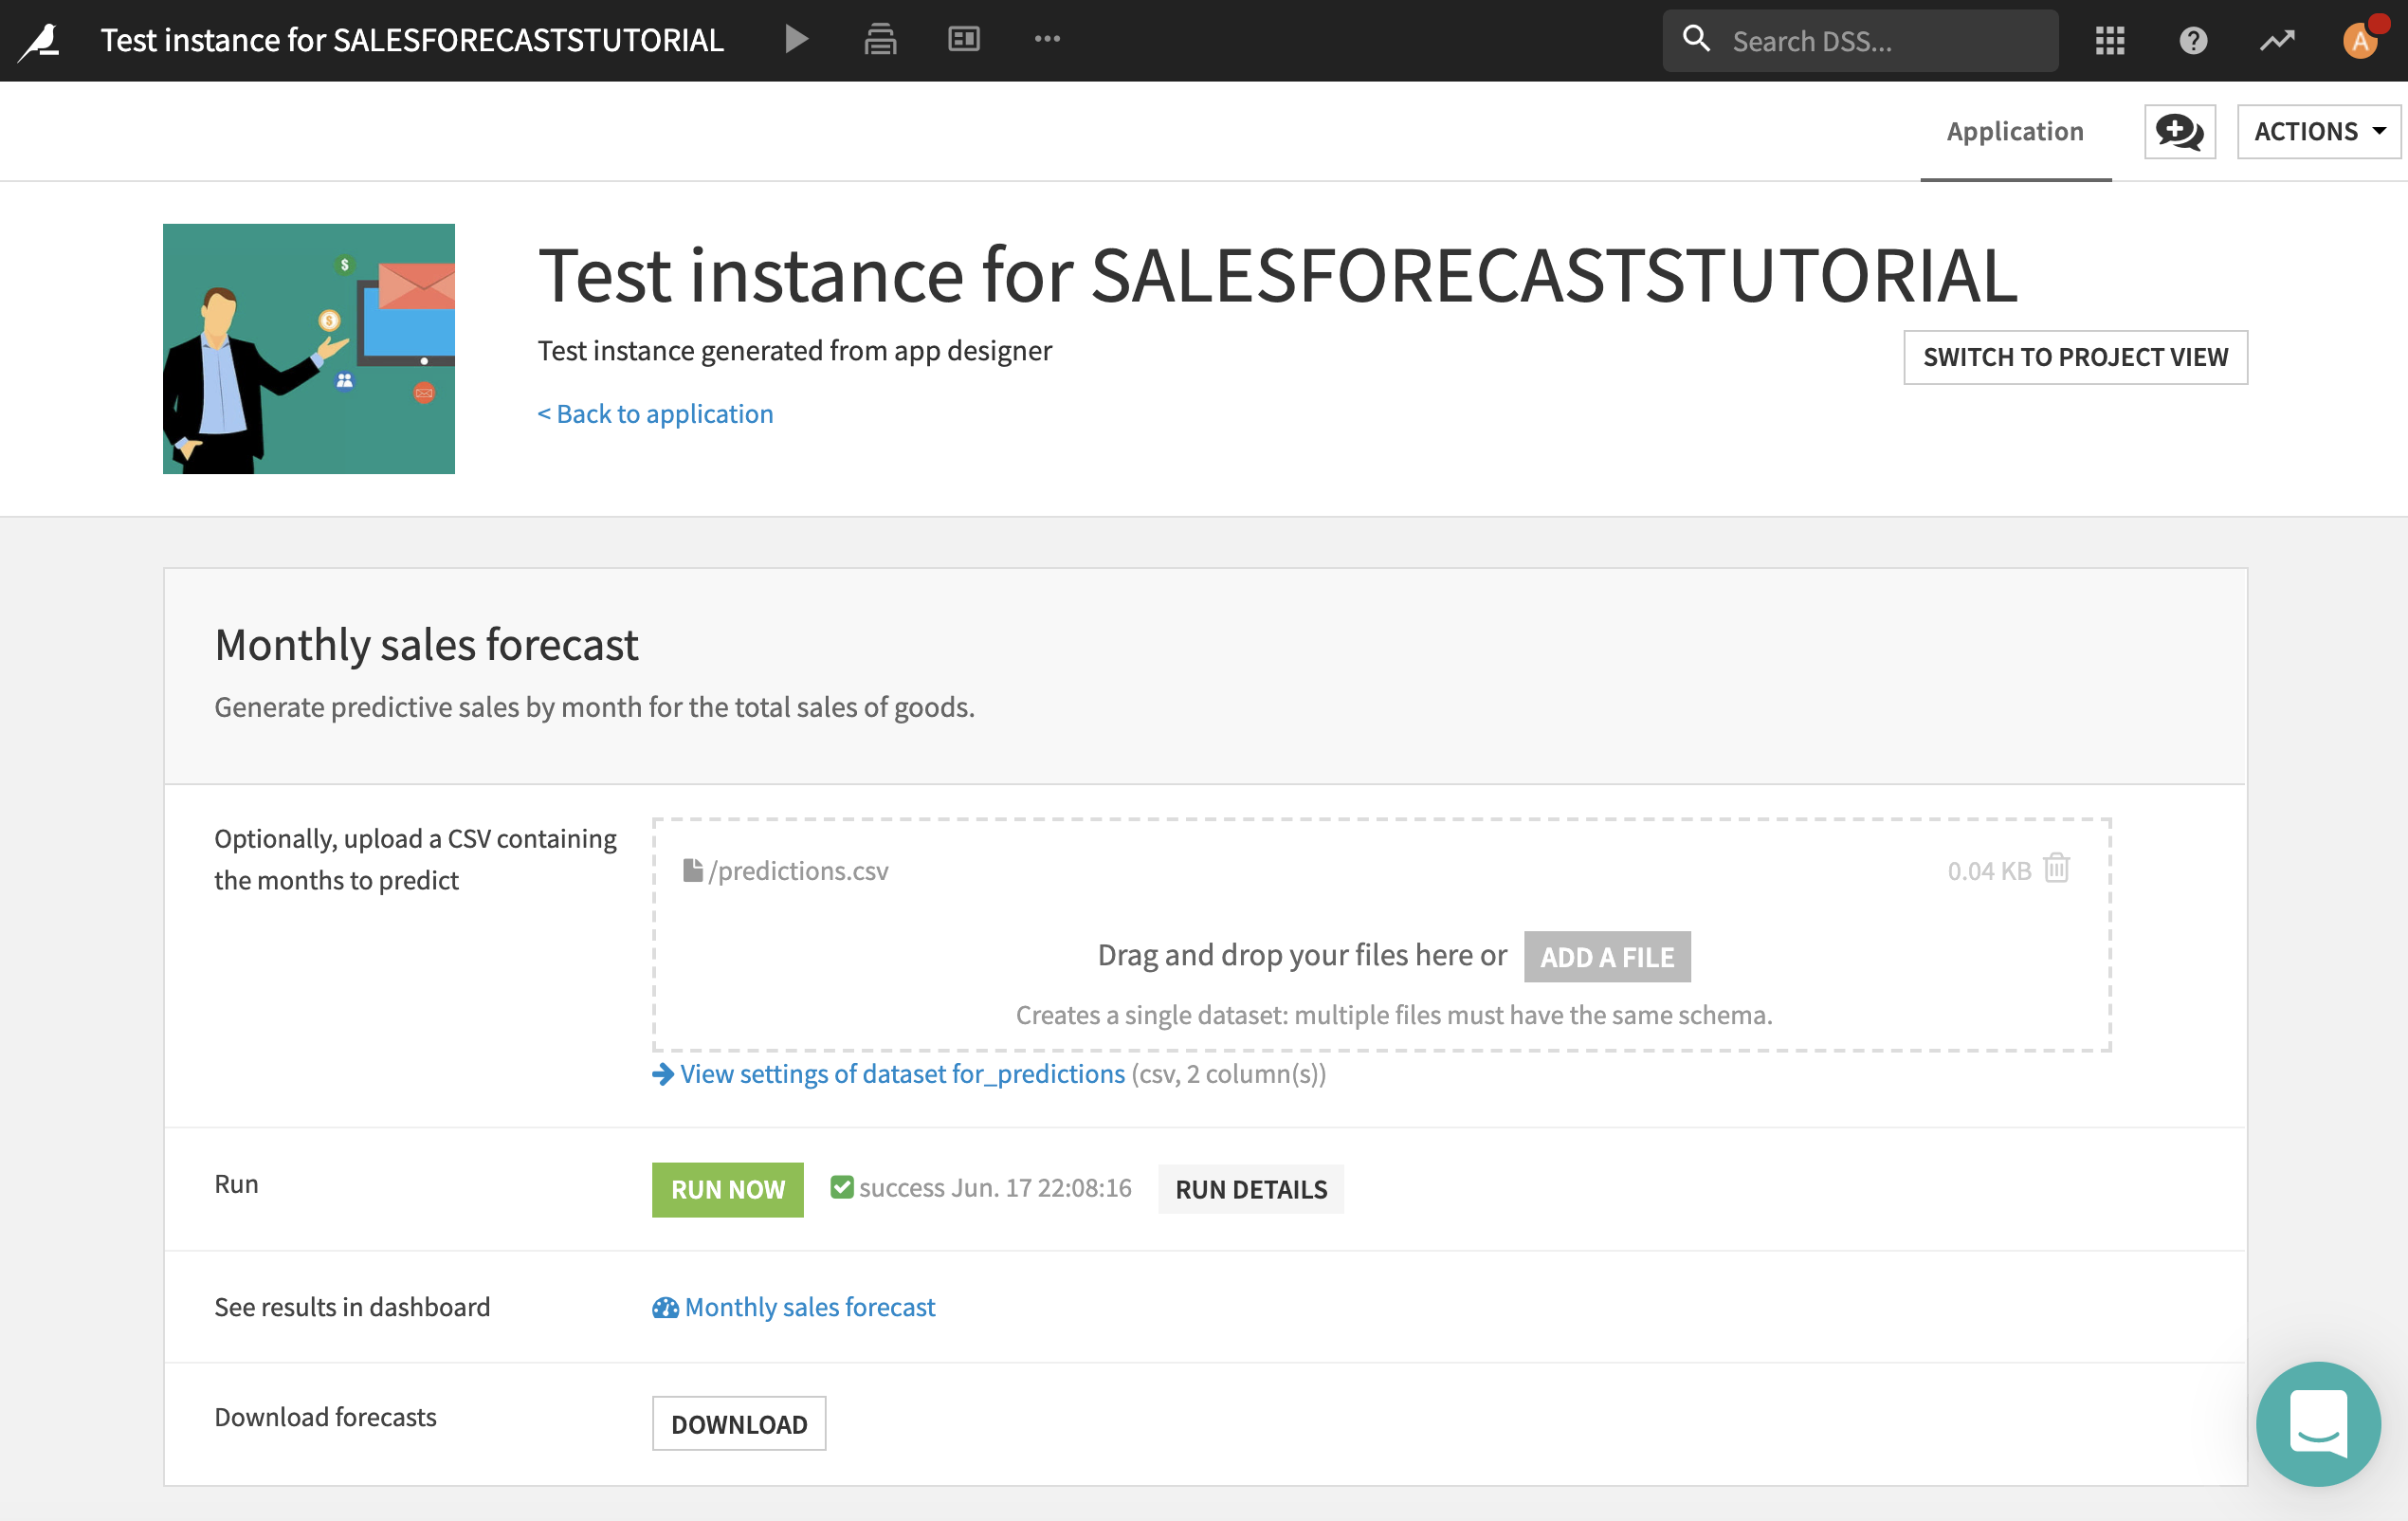
Click Save, and then click Test.
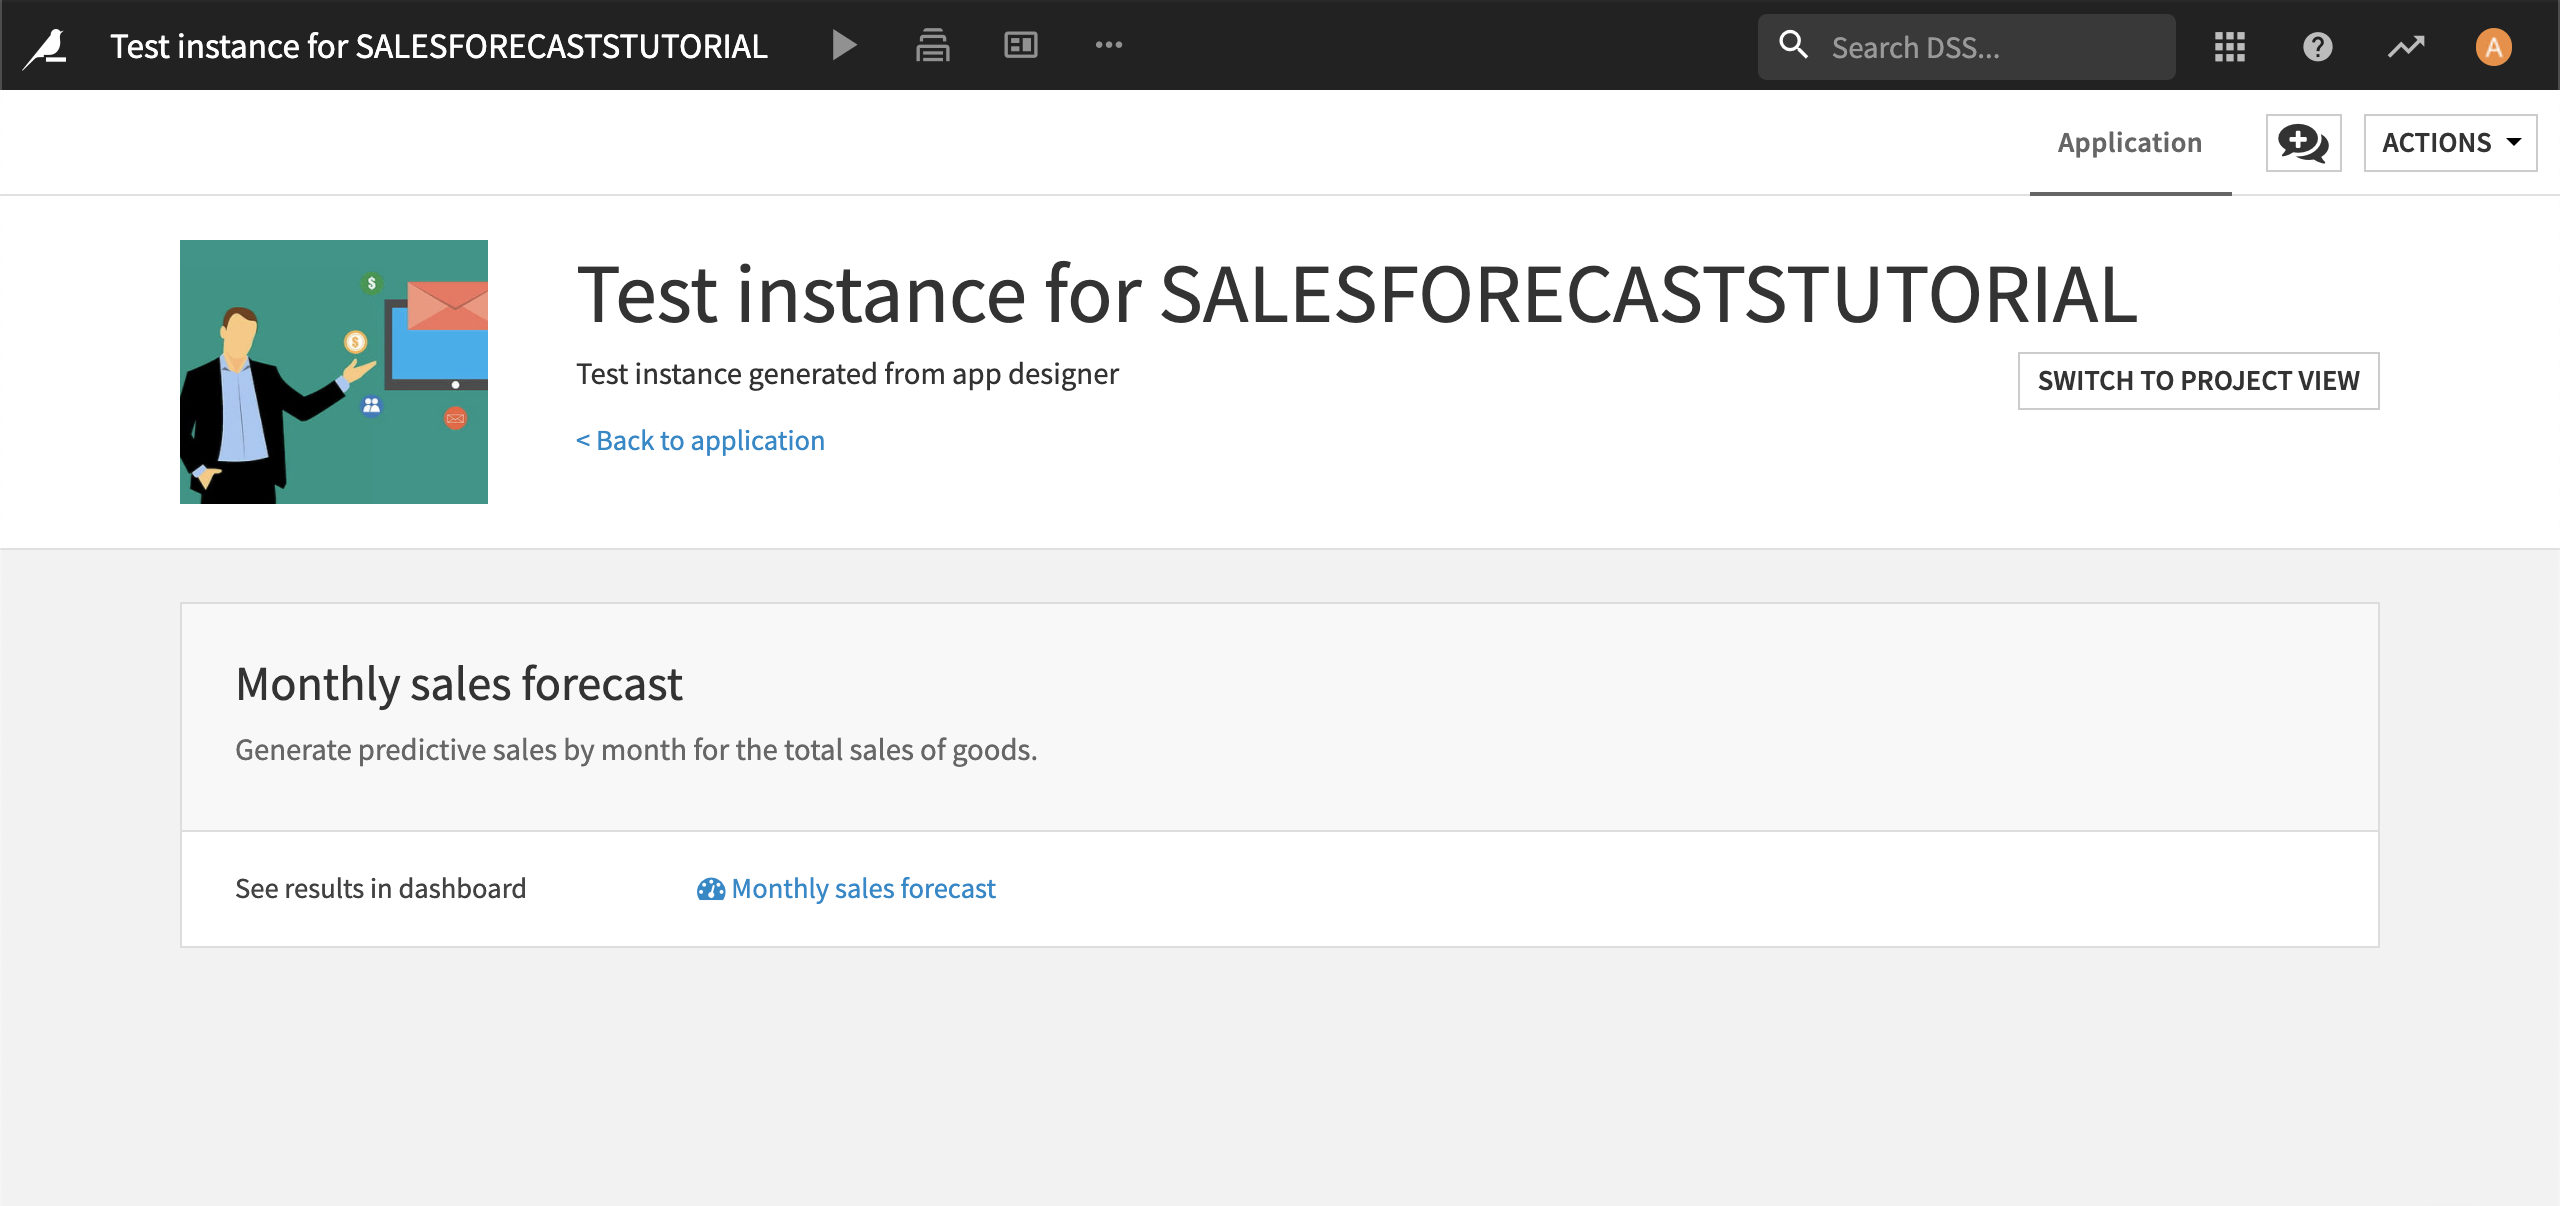
This gives us a view of what the app currently looks like to the end user. If you click on the link, it takes you to the dashboard. This is a good first step, but offers no interactivity for the user.
Next, let’s add the ability to specify your own forecast horizon.
Return to the Application Designer (using the Back button in your browser for example).
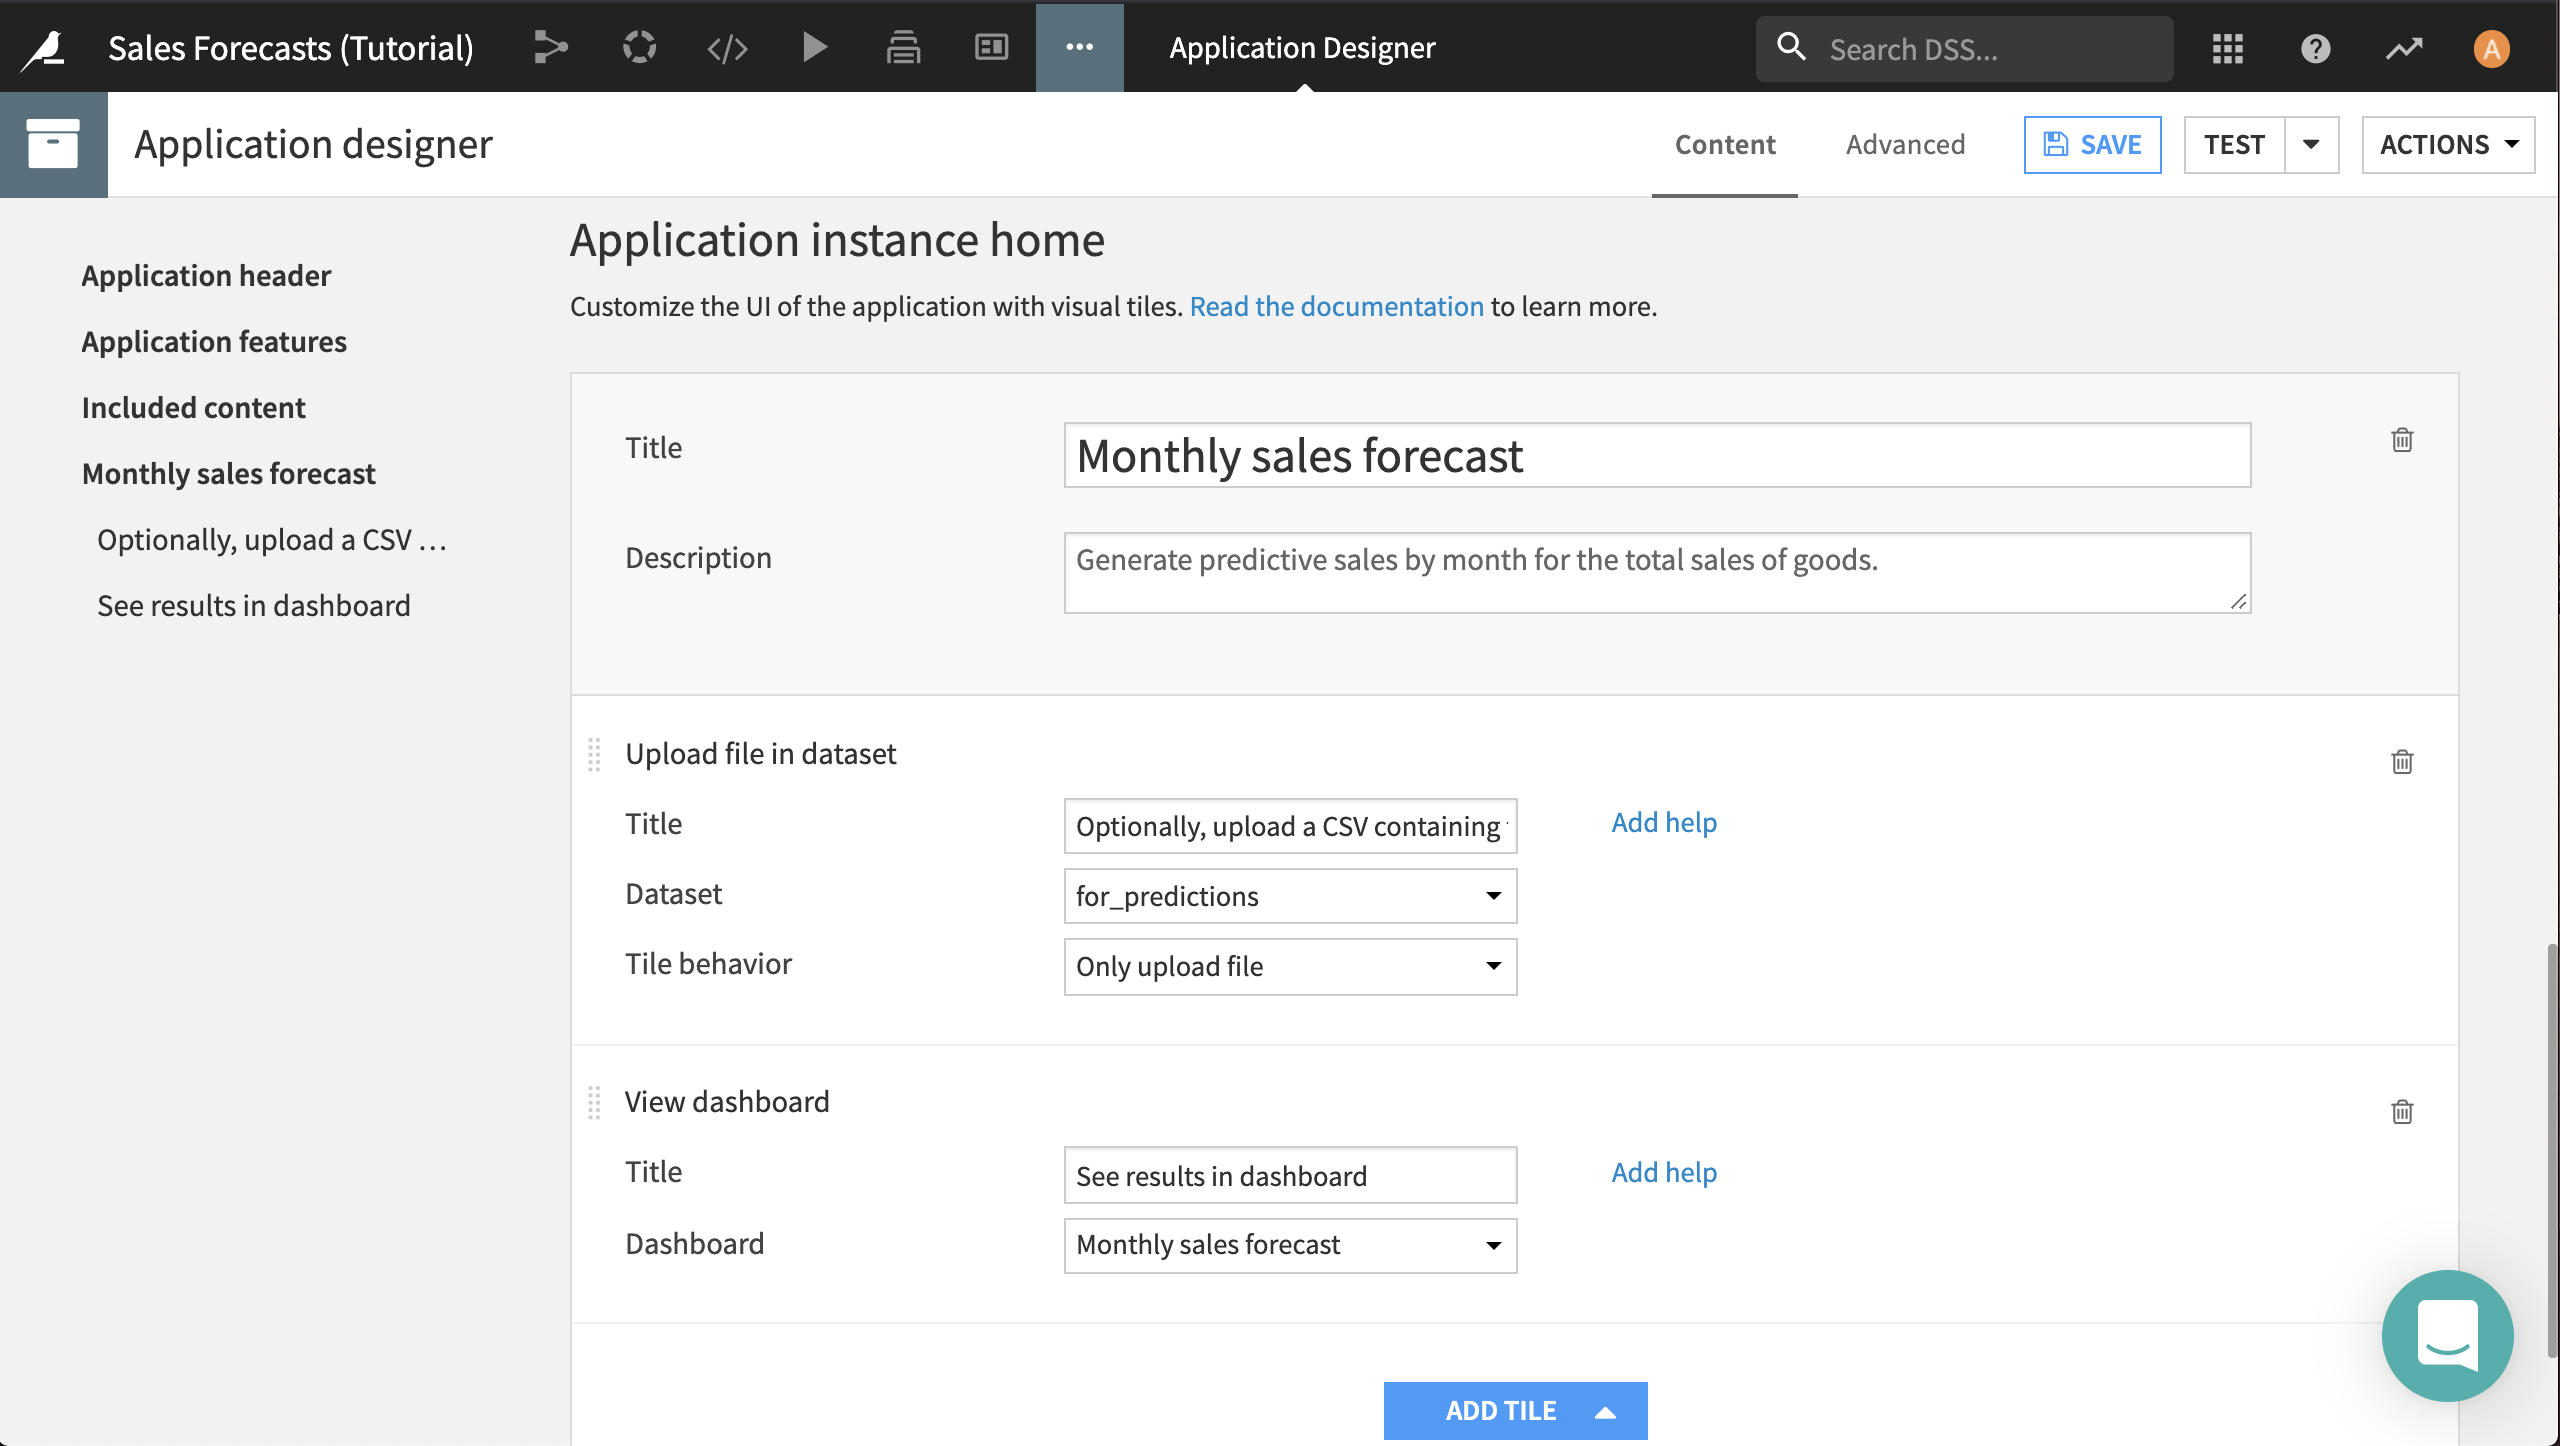
In the same “Monthly sales forecast” section, click Add Tile > Upload file in dataset.
Give it a title like
Optionally, upload a CSV containing the months to predict.Click Add help, and make the help text
The format of the CSV should be: year,month.Select for_predictions as the dataset.
Select Only upload file as the tile’s behavior.
Finally, drag up the new tile so that the file upload comes first.
Click Save and Test again to check the current status of the UI.
This allows the application user to specify their own forecast horizon, but now we need to add a mechanism to score this dataset and update the dashboard. We can do this with a scenario.
Return to the Application Designer if viewing the test instance, and go to the Scenarios page from the Jobs menu.
Click +Create Your First Scenario.
Name it
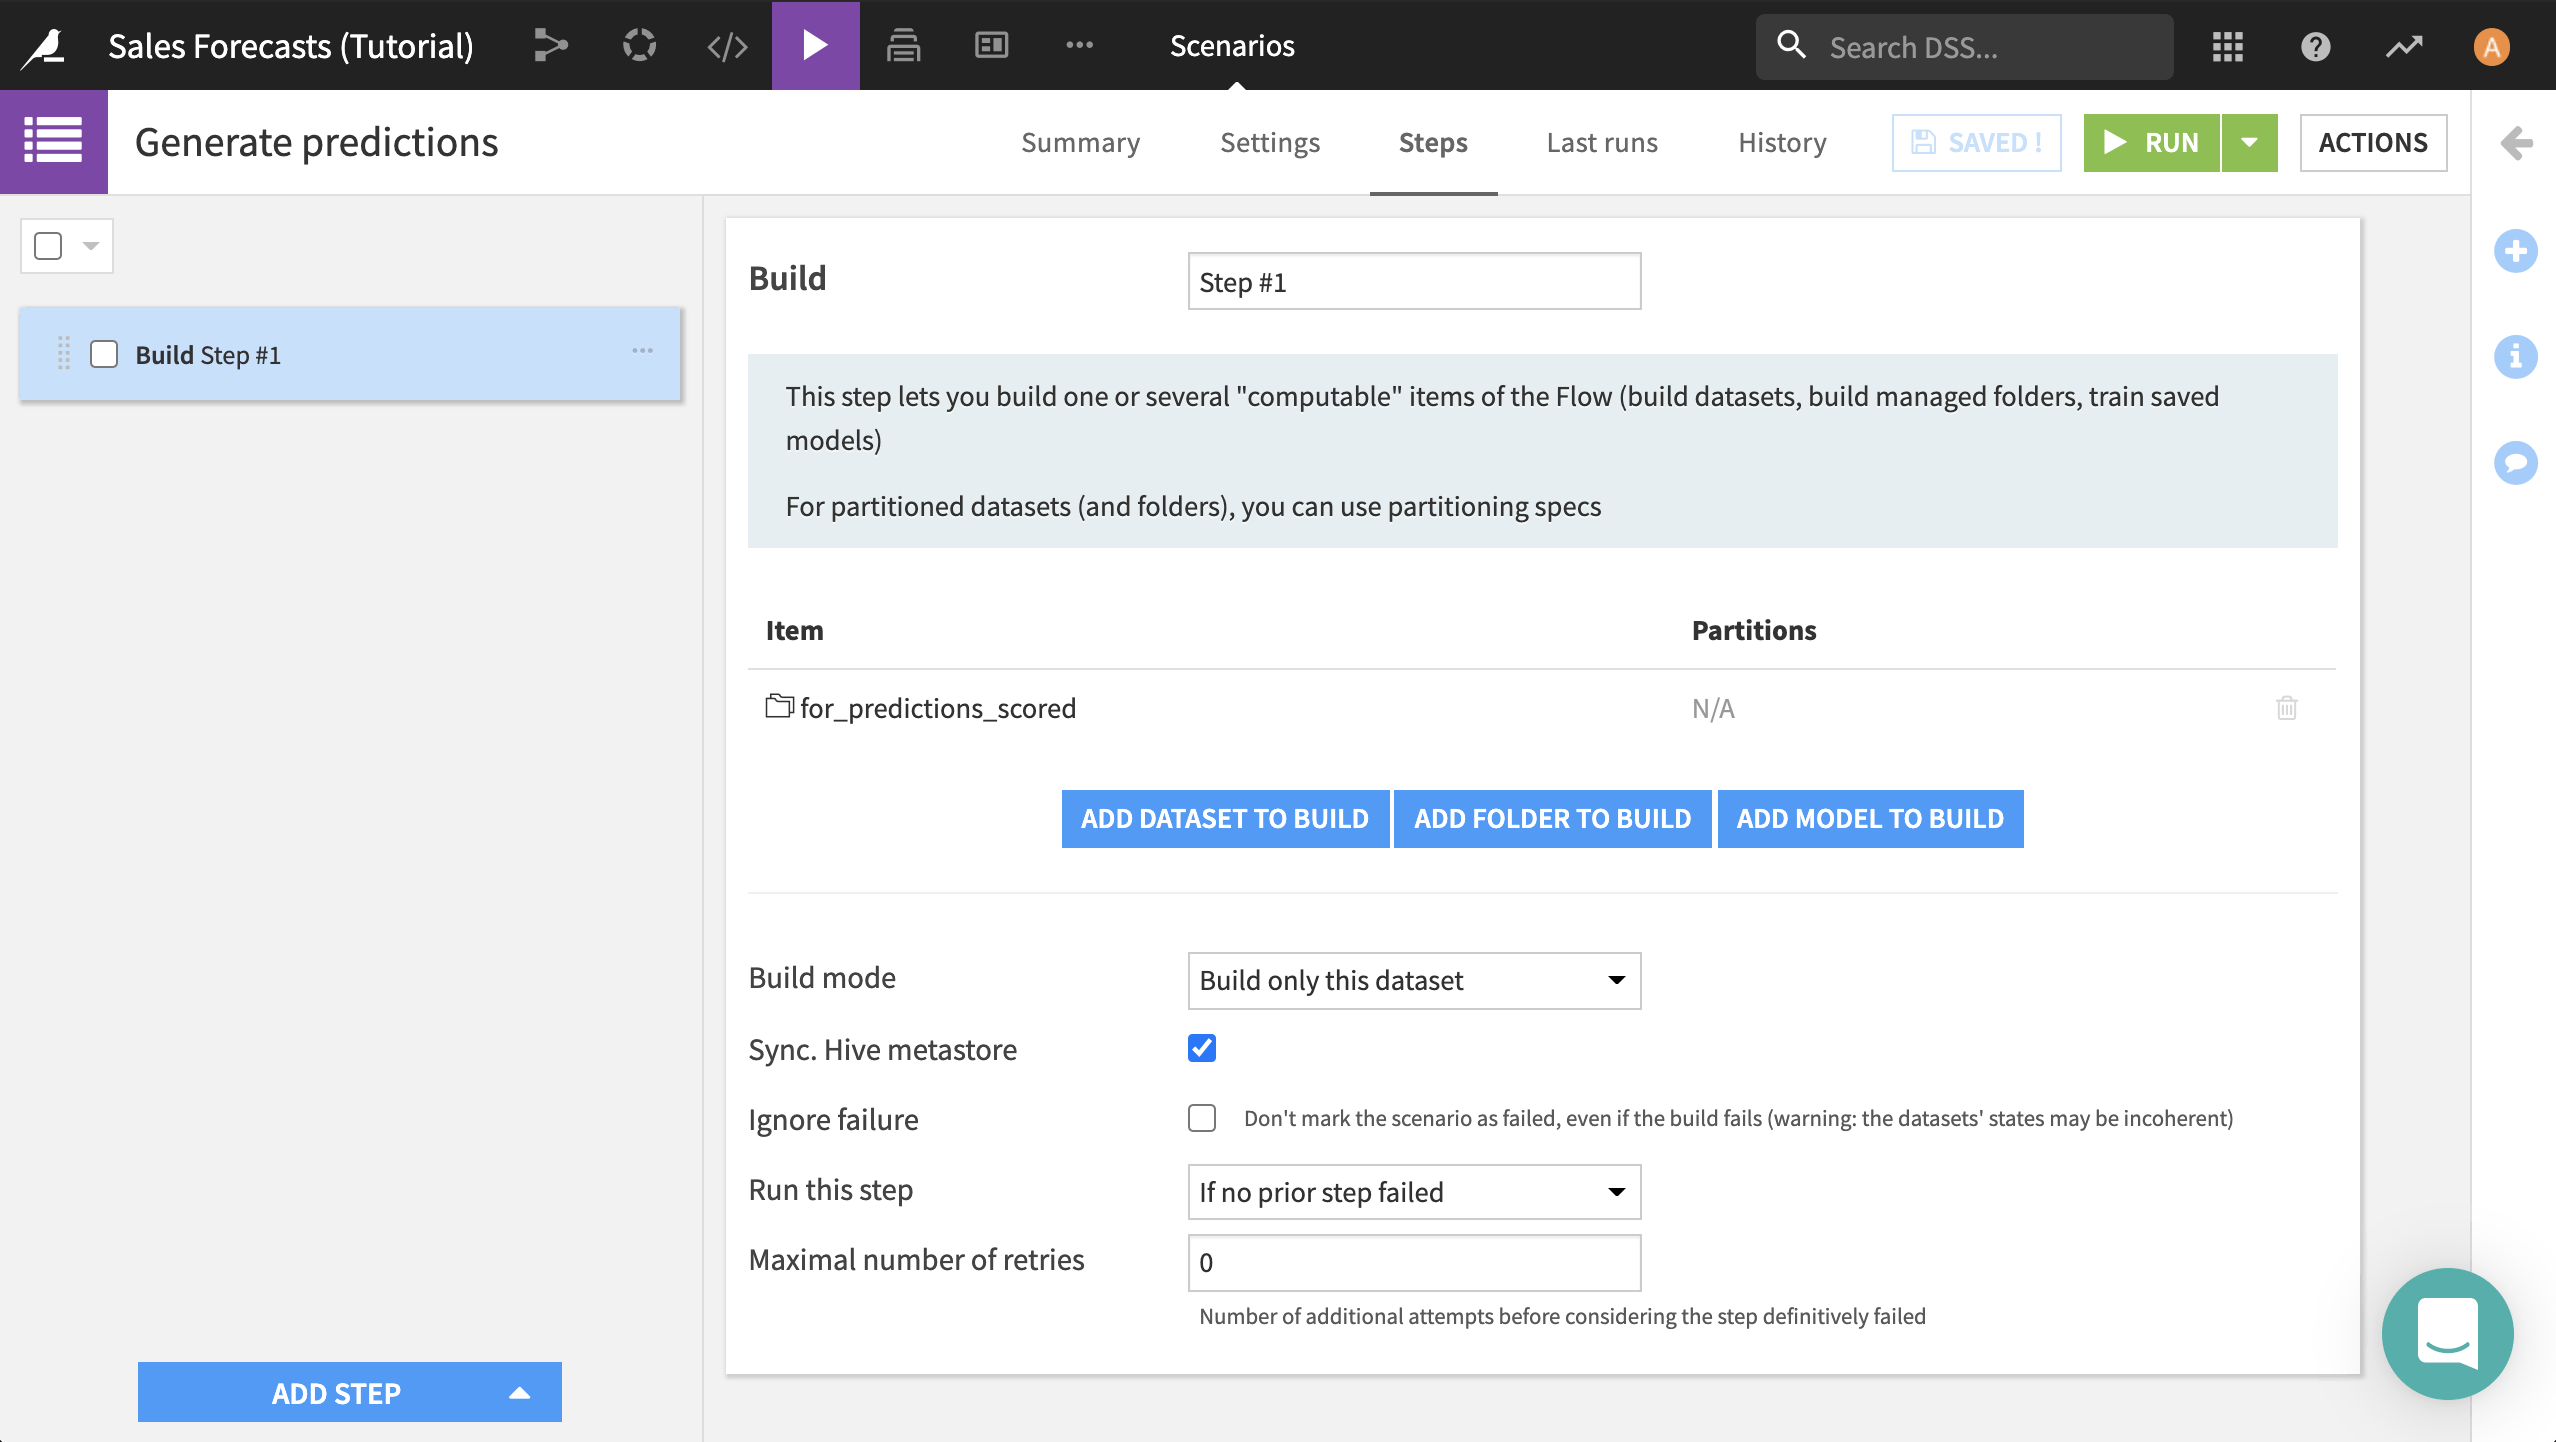
Generate predictions, and click Create.On the Steps tab, click Add Step > Build/Train.
Click Add Dataset to Build, and select for_predictions_scored.
Select Build only this dataset as the build mode.
Click Save.
Now that we have a scenario to build the dataset, we can add a button to the application that runs the scenario.
Return to the Application Designer.
Add a third tile, this one of type Run scenario.
Give it a title of
Run.Select Generate predictions as the scenario.
Drag up the Run tile so that it comes second.
Lastly, we need to make the model and the dataset available to the application.
In the “Included content” section, add for_predictions as an included dataset.
Add Prediction sales_by_month as a saved model.
As a final addition to the forecasting functionality of the application, let’s allow app users to download the scored dataset.
Add a tile of type Download dataset.
Give it the title
Download forecasts.Select for_predictions_scored as the dataset to download.
Click Save, and then click Test > Create or update test instance (full).
Historical Order Data for a Single Customer
Now that we’ve made it possible for application users to generate forecasts, let’s enable them to pull the order data for a single customer.
Return to the Application Designer.
Add a new section, and call it
Sales history of one customer.Give it a description like
You can generate a dashboard with the detailed sales of one given customer.Click Save.
Much of what we want to accomplish here is similar to what we did with generating predictions. We want to allow the application user to trigger a scenario that builds the items_of_one_customer dataset and updates the dashboard. We also want to allow them to download that dataset. The new wrinkle is that we want to allow the application user to specify any customer they want.
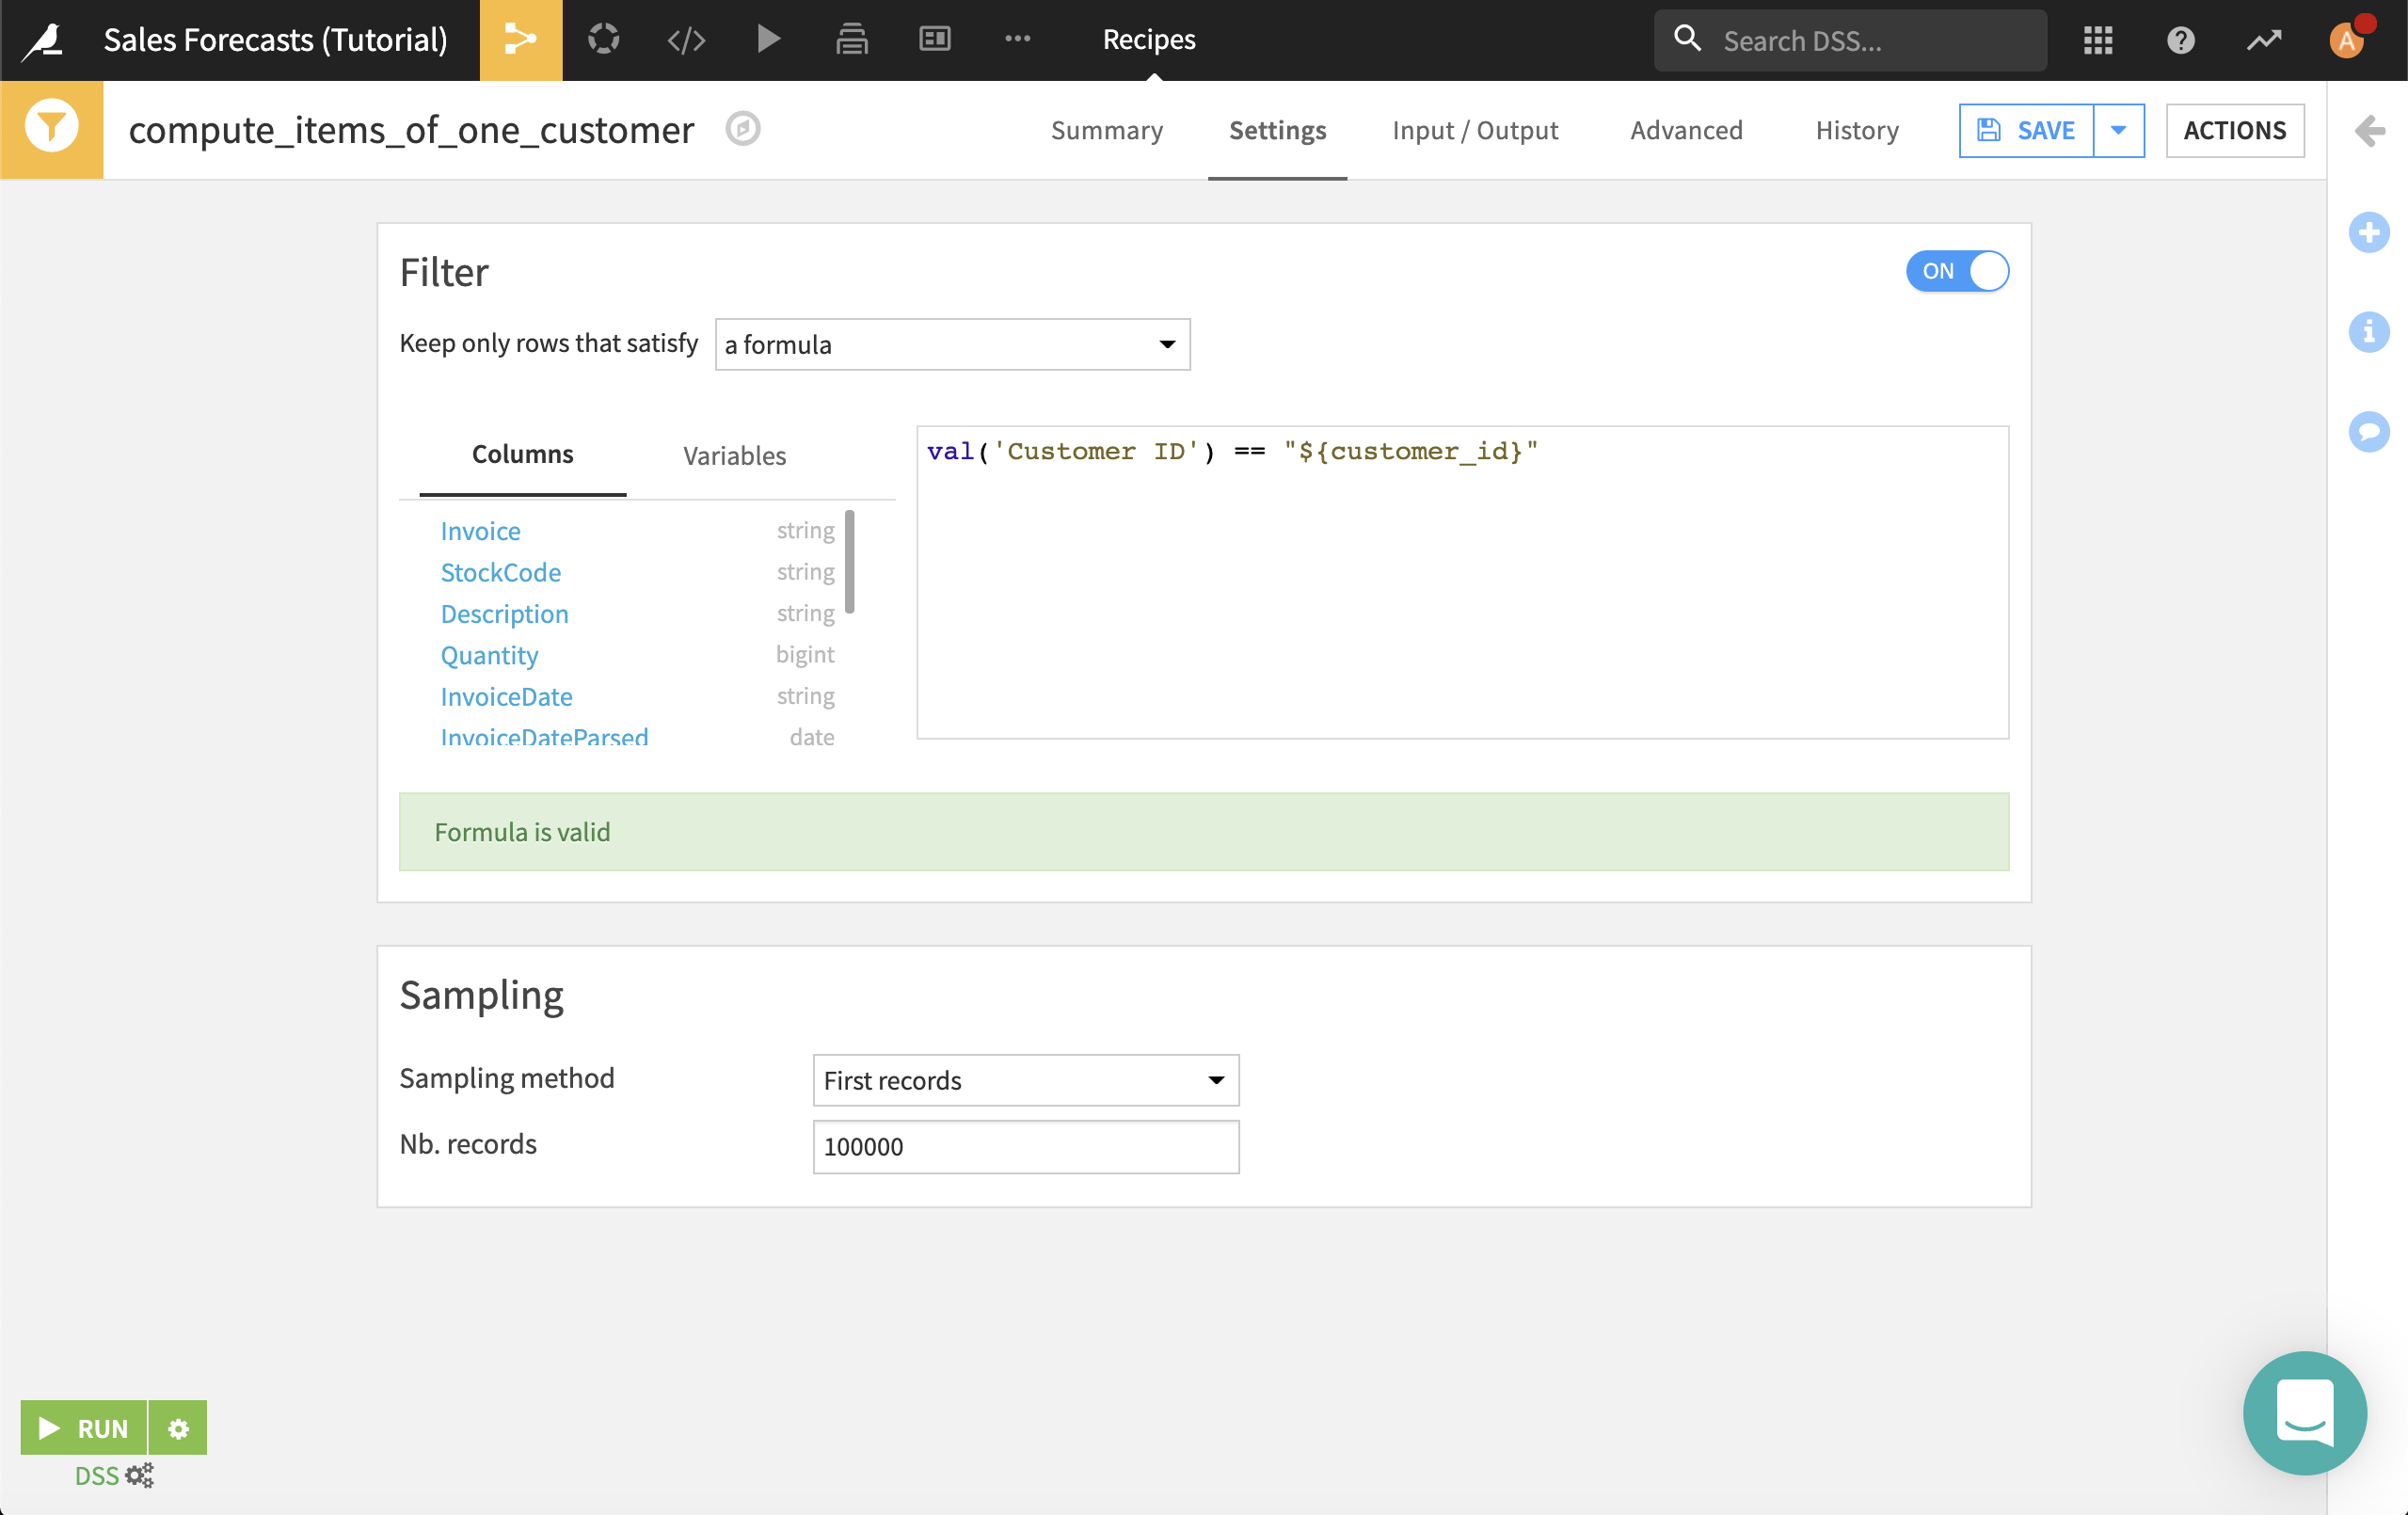
Right now, that value is hard-coded in the Filter recipe, but we can change that by defining a variable.
Go to the menu More Options (…) > Variables.
Under Local variables, specify:
{
  "customer_id": "13758"
}
Click Save.
Go to the Filter recipe, and update the formula to
val('Customer ID') == "${customer_id}".
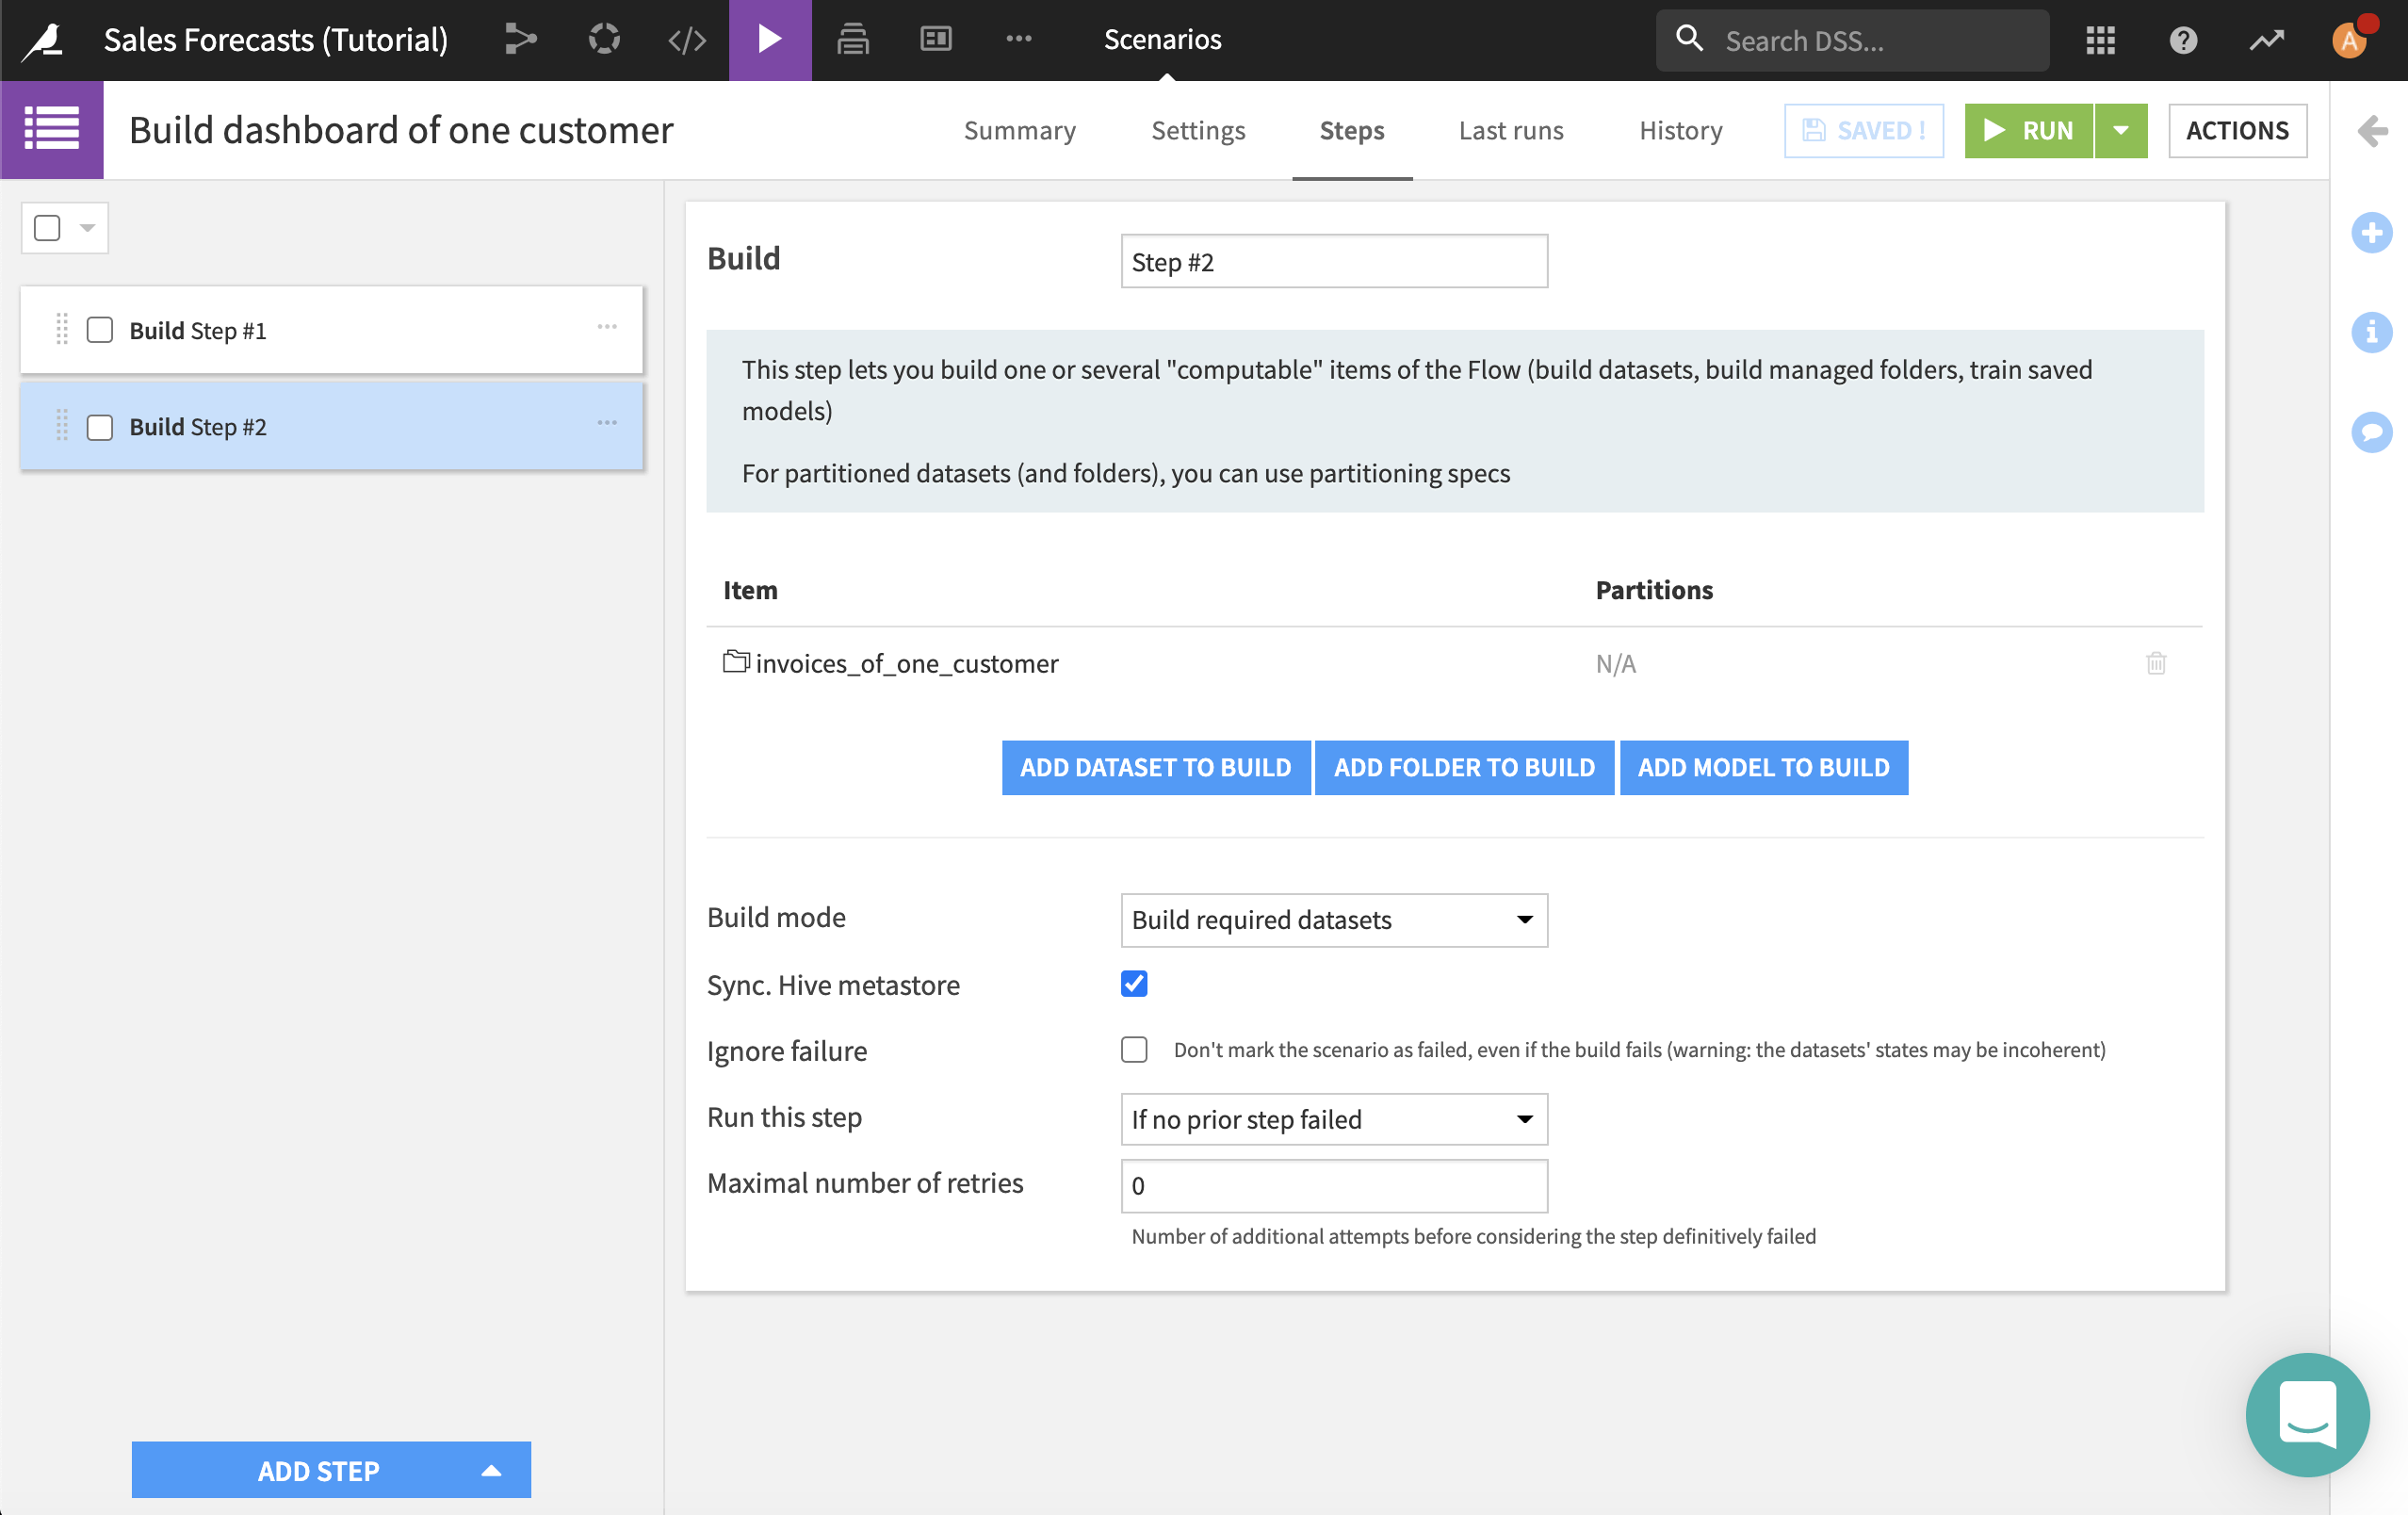
Now we’ll create the scenario to build this dataset.
Go to Jobs > Scenarios > +New Scenario.
Name it
Build dashboard of one customer, and click Create.On the Steps tab, click Add Step > Build/Train.
Click Add Dataset to Build, and select items_of_one_customer.
Select Build required datasets as the build mode.
Add a second Build/Train step with invoices_of_one_customer as the dataset to build.
Click Save.
Now that we have a variable and a scenario, we can build out the app.
Return to the Application Designer.
In the “Included content” section, add the items dataset so that it is available to the application.
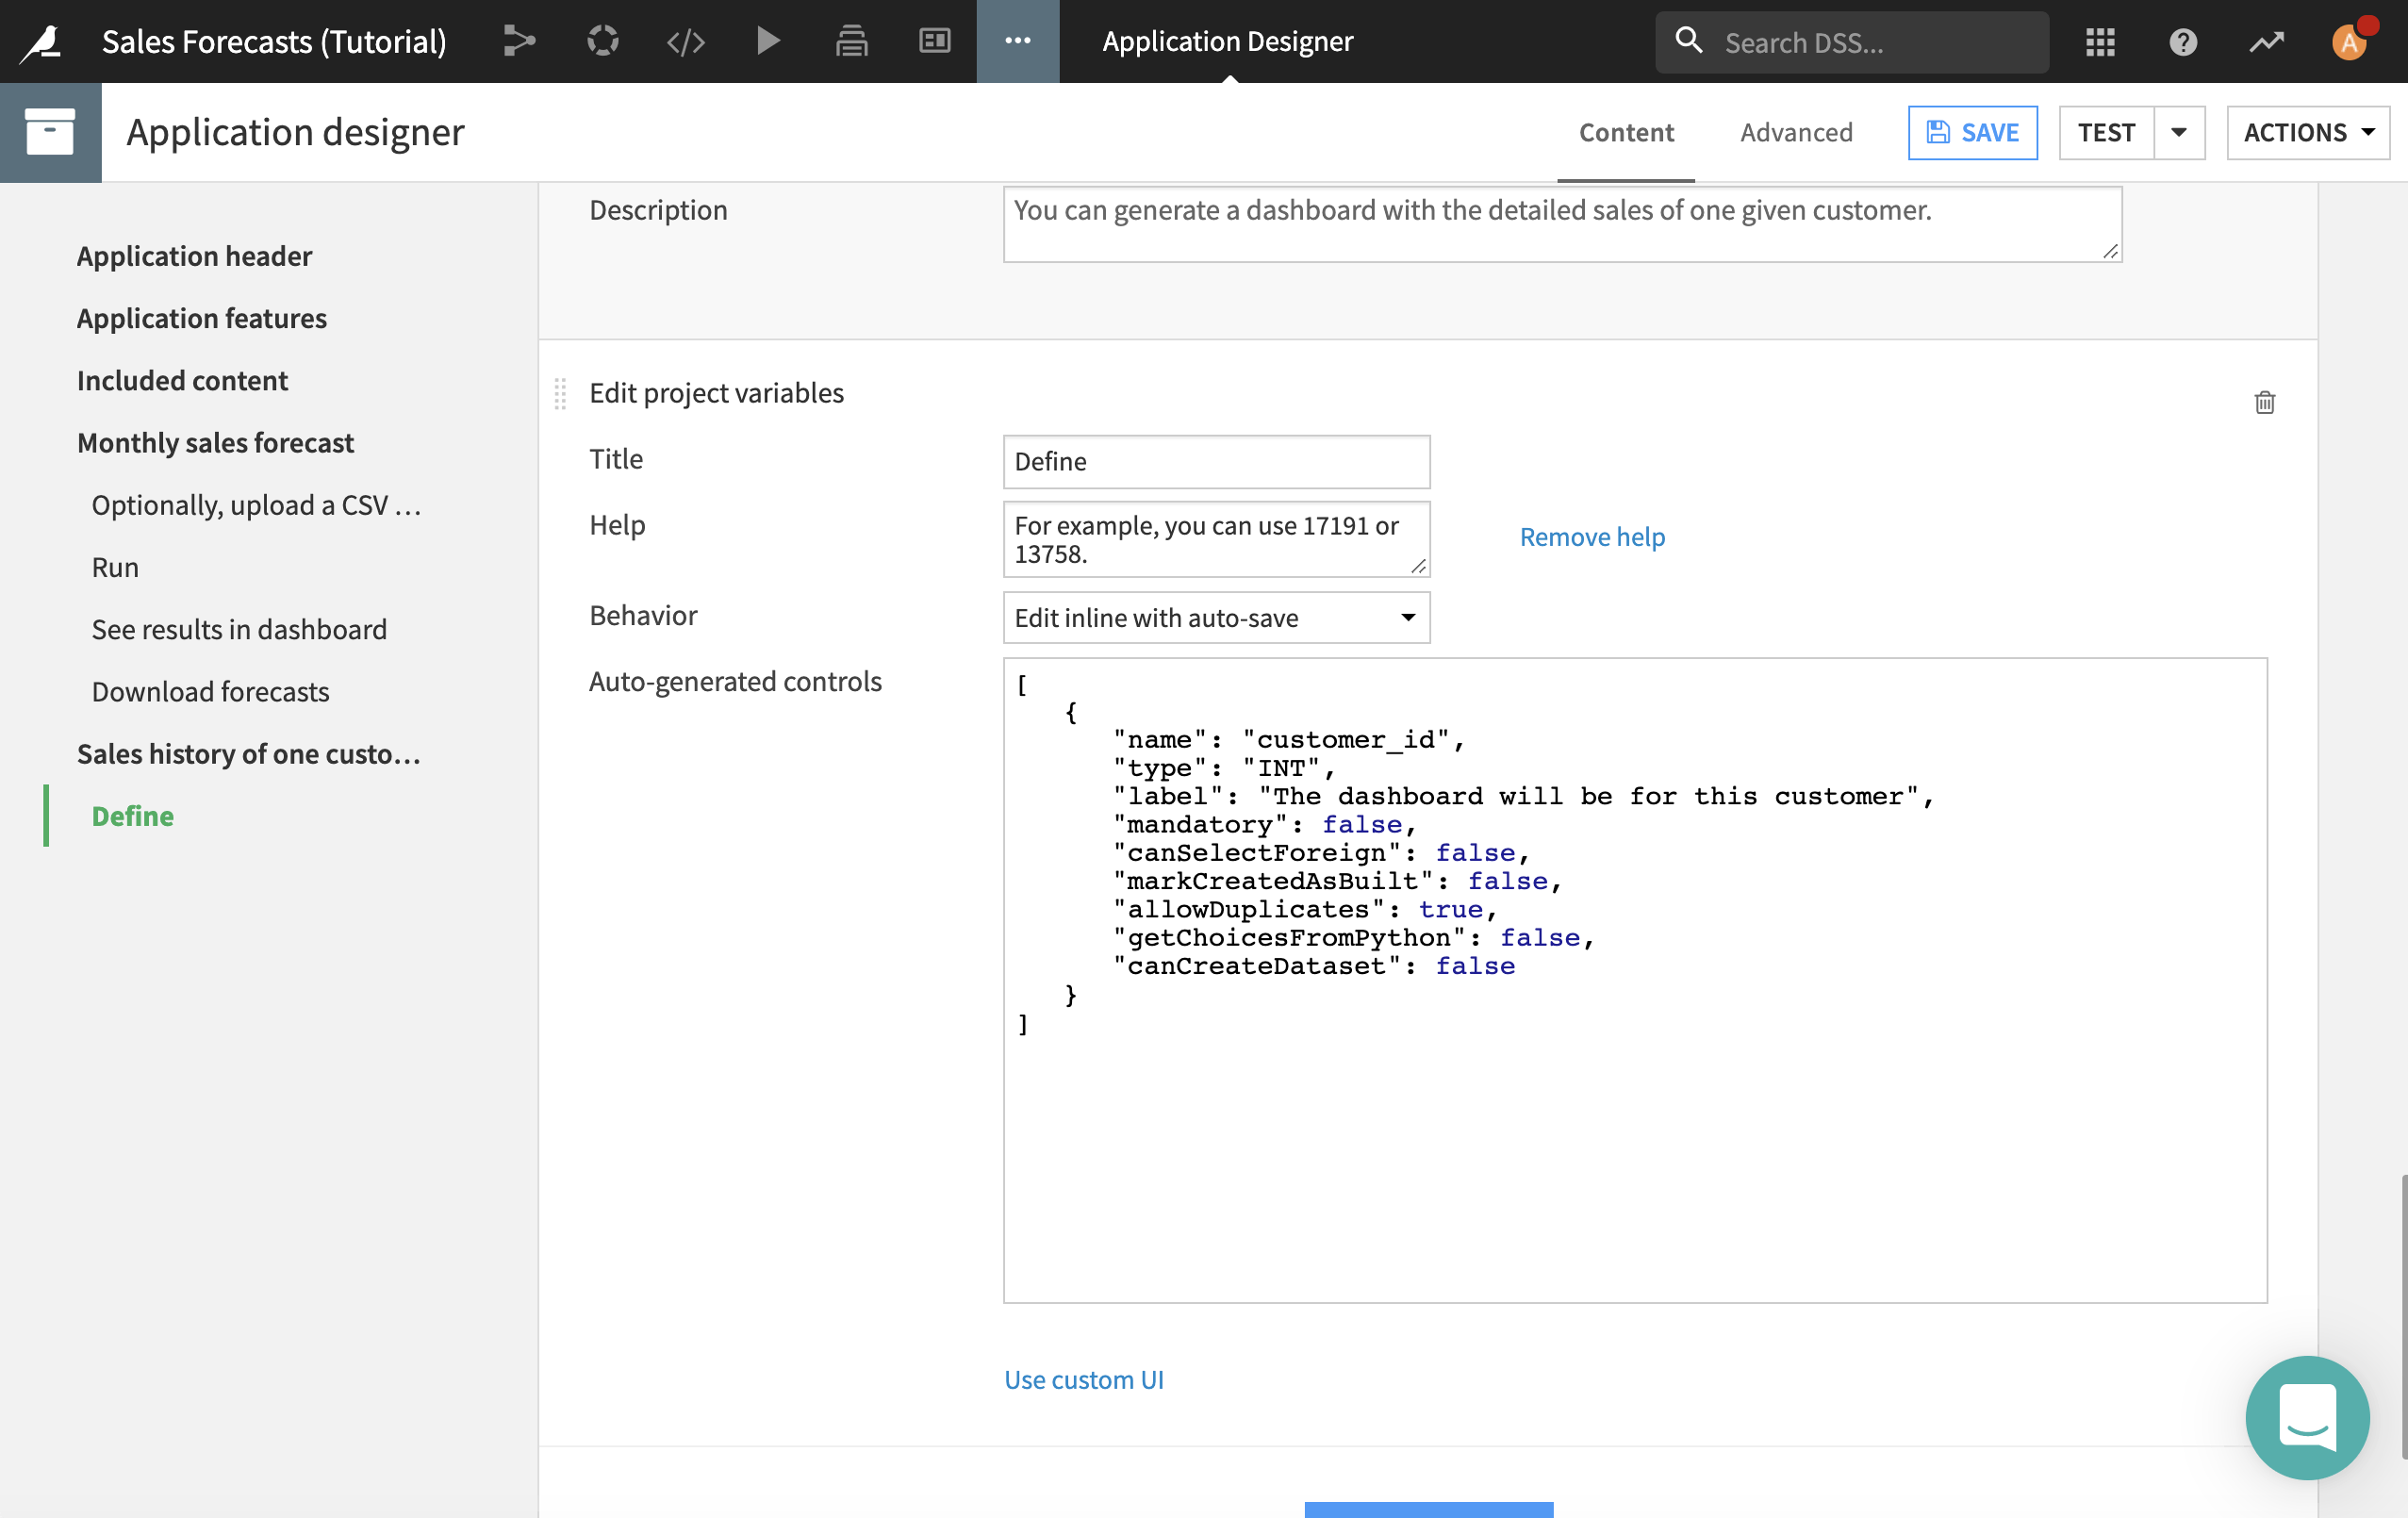
In the “Sales history of one customer” section, click Add Tile > Edit project variables.
Give it a title of
Define.Click “Add help”, and give it help text like
For example, you can use 17191 or 13758.We only need the app user to set a single variable, so for behavior, select Edit inline with auto-save.
Now we need to specify the settings for the variable. Replace the default JSON with the following:
[
   {
      "name": "customer_id",
      "type": "INT",
      "label": "The dashboard will be for this customer",
      "mandatory": false,
      "canSelectForeign": false,
      "markCreatedAsBuilt": false,
      "allowDuplicates": true,
      "getChoicesFromPython": false,
      "canCreateDataset": false
   }
]
Let’s finish it off with a few more tiles to complete the app.
Click Add Tile > Run scenario.
Give it a title of
Run.Select Build dashboard of one customer as the scenario to run.
Click Add Tile > View dashboard.
Give it a title of
See results in dashboard.Select Sales history of one customer as the dashboard.
Click Add Tile > Download dataset.
Give it a title of
Download all the sales of this customer (XLSX format).Select items_of_one_customer as the dataset to download.
Select Excel (*.xlsx) as the format.
Click Save. Do another full test to see the final application.
The app is now available from the Dataiku homepage of users with the permission to access it.