Data Engineer Quick Start
Getting Started
Dataiku is a collaborative, end-to-end data science and machine learning platform that unites data analysts, data scientists, data engineers, architects, and business users in a common space to bring faster business insights.
In Dataiku DSS, connecting to and ingesting data, then preparing that data for tasks such as machine learning, is performed all in one place. In this one-hour Quick Start program, you’ll work with flight and airport data to discover ways to connect to data, cleanse it using both code and visual recipes, and set up automated metrics and checks.
Prerequisites
To follow along or reproduce the tutorial steps, you will need access to the following:
Dataiku DSS - version 9.0 or above
An SQL connection, such as Snowflake or PostgreSQL
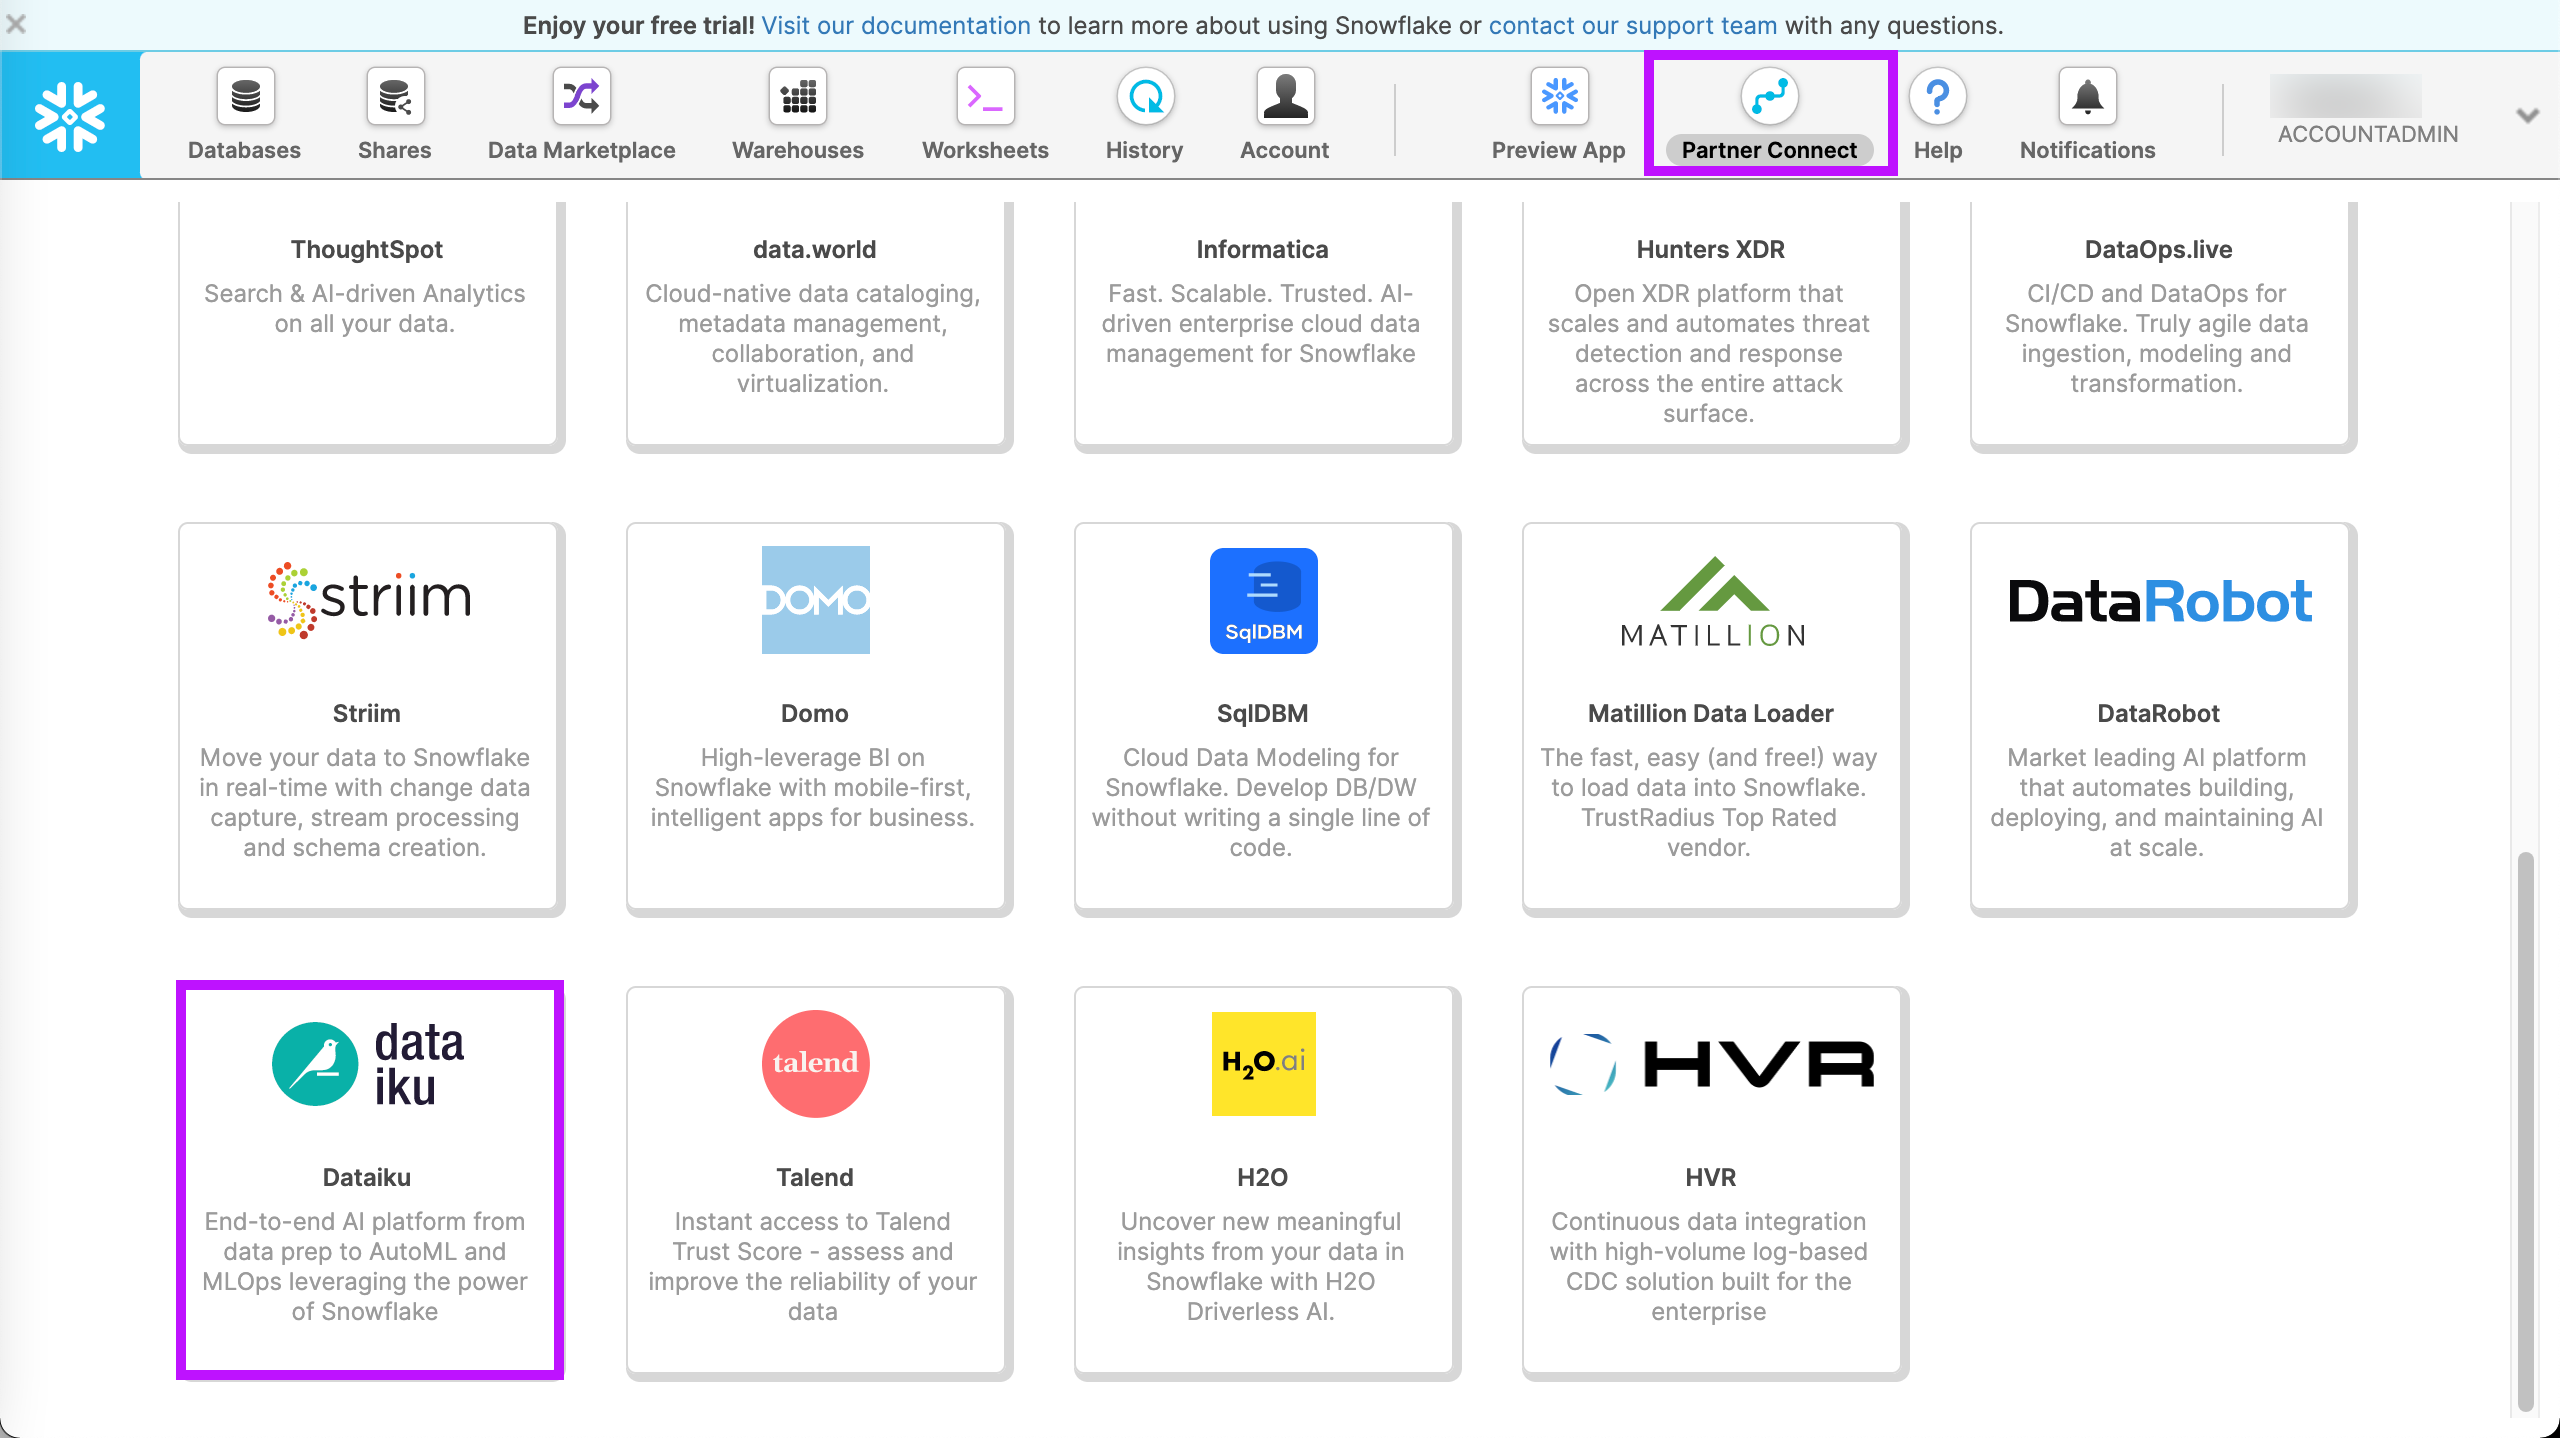
If you do not already have your own instance of Dataiku DSS with an SQL connection, you can start a free Dataiku Online Trial from Snowflake Partner Connect. This trial gives you access to an instance of Dataiku Online with a Snowflake connection.
Tip
For each section of this quick start, written instructions are recorded in bullet points. Be sure to follow these while using the screenshots as a guide. We also suggest that you keep these instructions open in one tab of your browser and your Dataiku DSS instance open in another.
You can find a read-only completed version of the final project in the public gallery.
Open the Snowflake Partner Connect Instance (Optional)
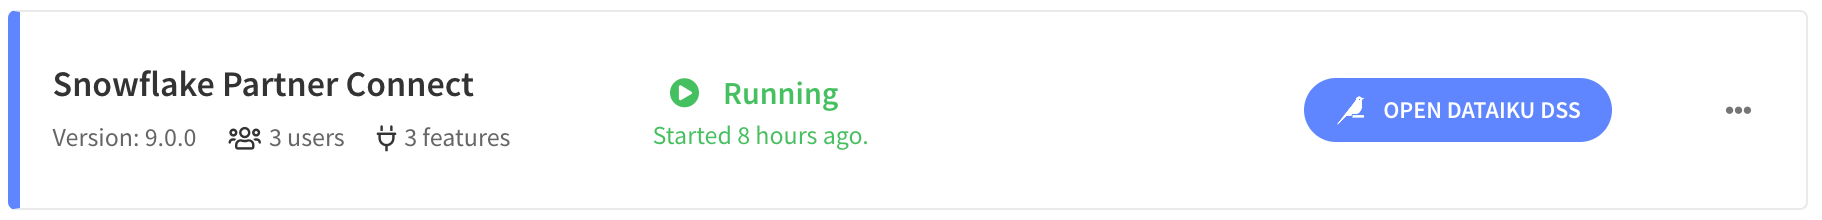
If you are getting started from your Dataiku Online Trial from Snowflake Partner Connect, the first step is to go to your launchpad. If you are getting started from your own instance of Dataiku DSS, you can skip this part and go to Create the Project. From your launchpad, you’ll find your Snowflake Partner Connect instance.
Click Open Dataiku DSS.
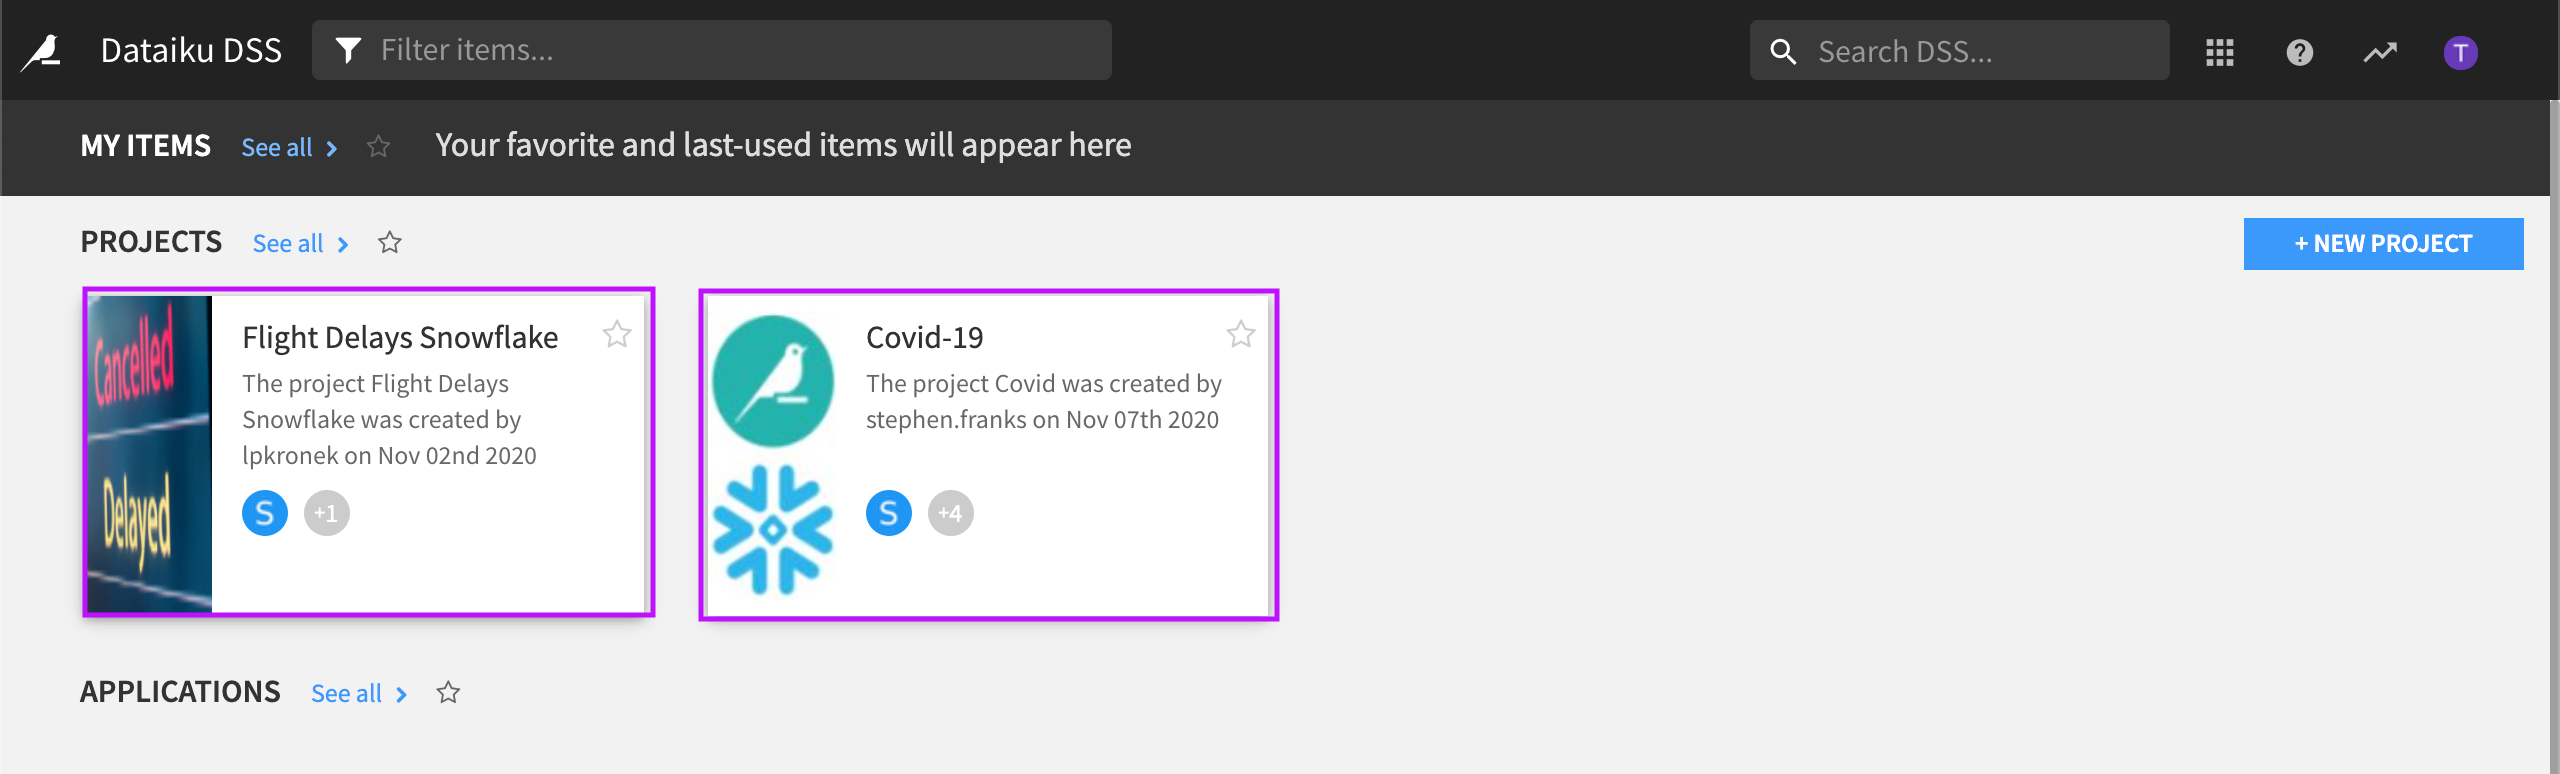
Dataiku DSS displays the homepage where you can see two projects.
Note
Dataiku DSS can run on-premise or in the cloud.
Create the Project
Dataiku DSS projects are the central place for all work and collaboration for users. Each Dataiku project has a visual flow, including the pipeline of datasets and recipes associated with the project.
This tutorial uses a fictitious project dedicated to predicting flight delays. The purpose of this tutorial is to look for data quality issues, and set up metrics and checks to tell Dataiku DSS to take certain actions if these data quality issues find their way into the Flow again when new data is added or the datasets are refreshed.
From the Dataiku homepage, click +New Project.
Select DSS Tutorials from the list.
Click on the Quick Start section and select Data Engineer Quick Start (Tutorial).
Note
You can also download the starter project from this website and import it as a zip file.
DSS opens the Summary tab of the project, also known as the project homepage.
About the Visual Flow
From the top navigation bar, click the Flow icon to go to the Flow.
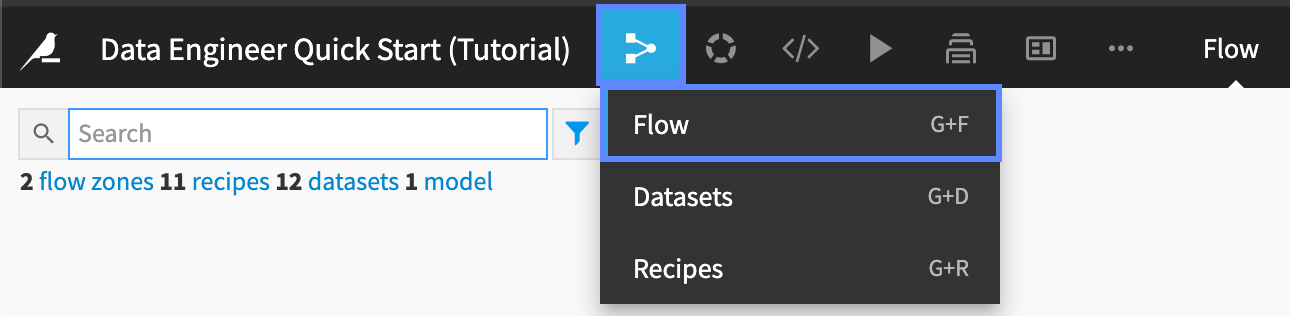
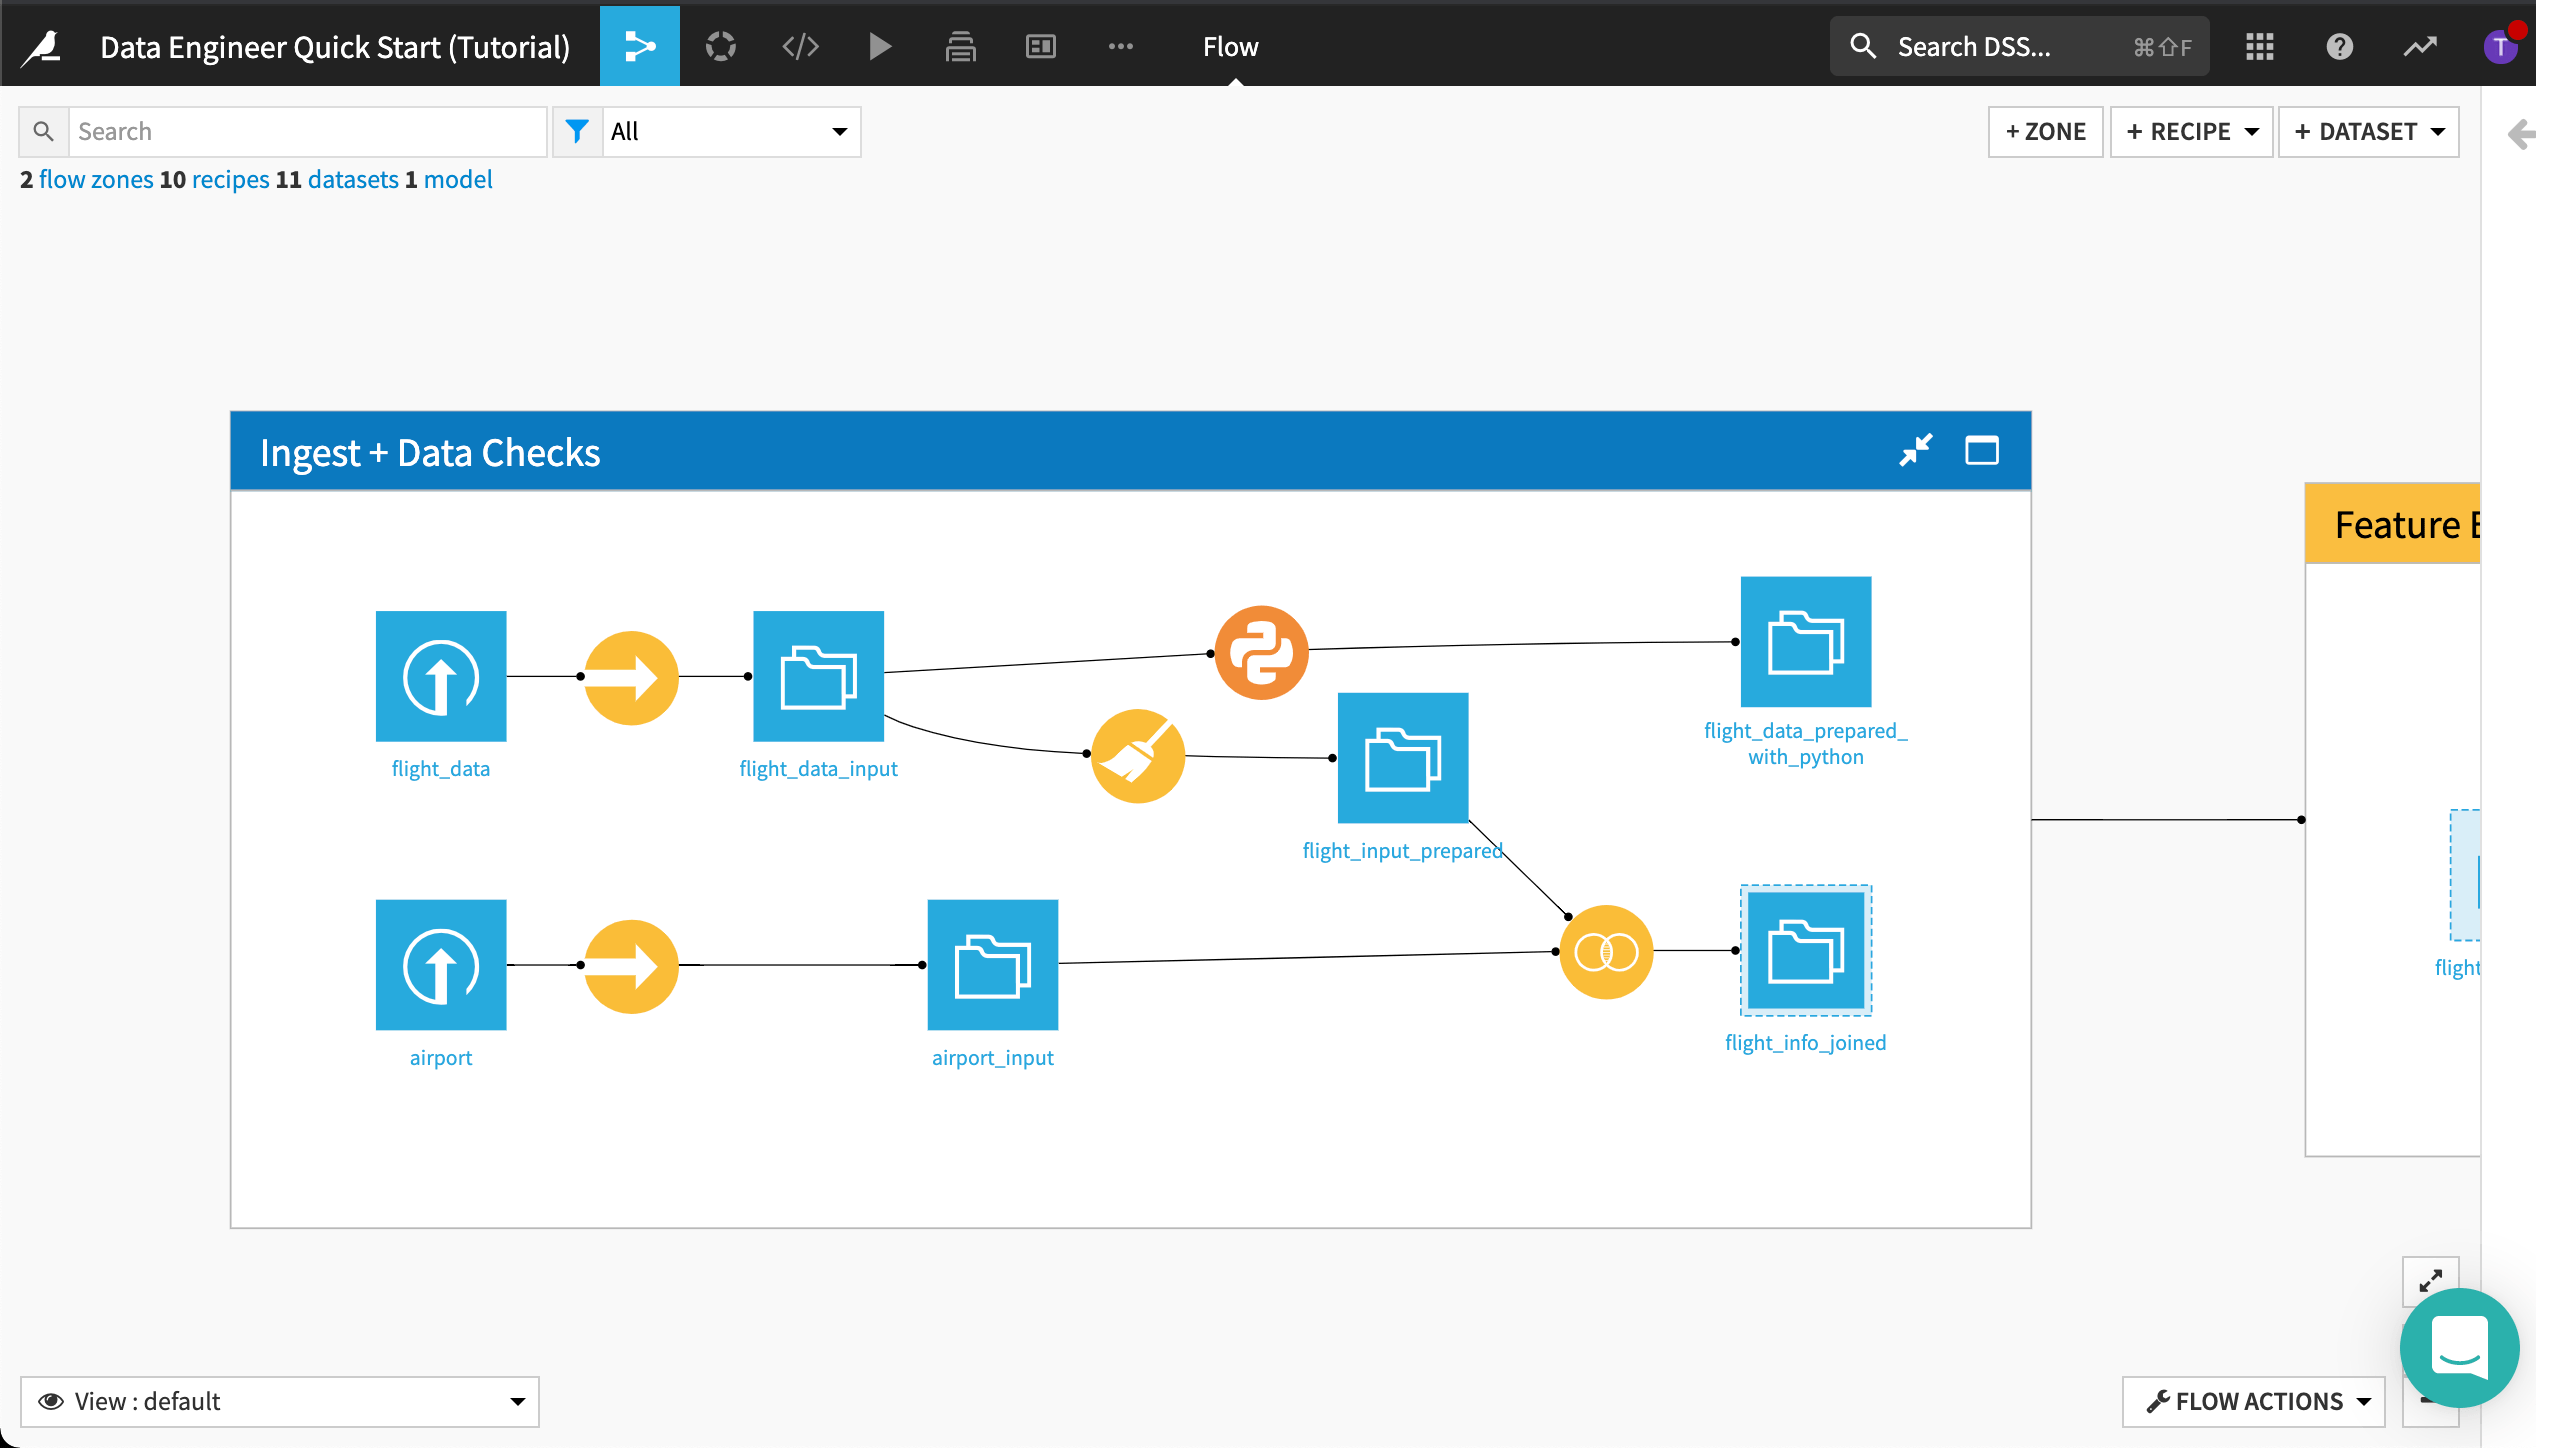
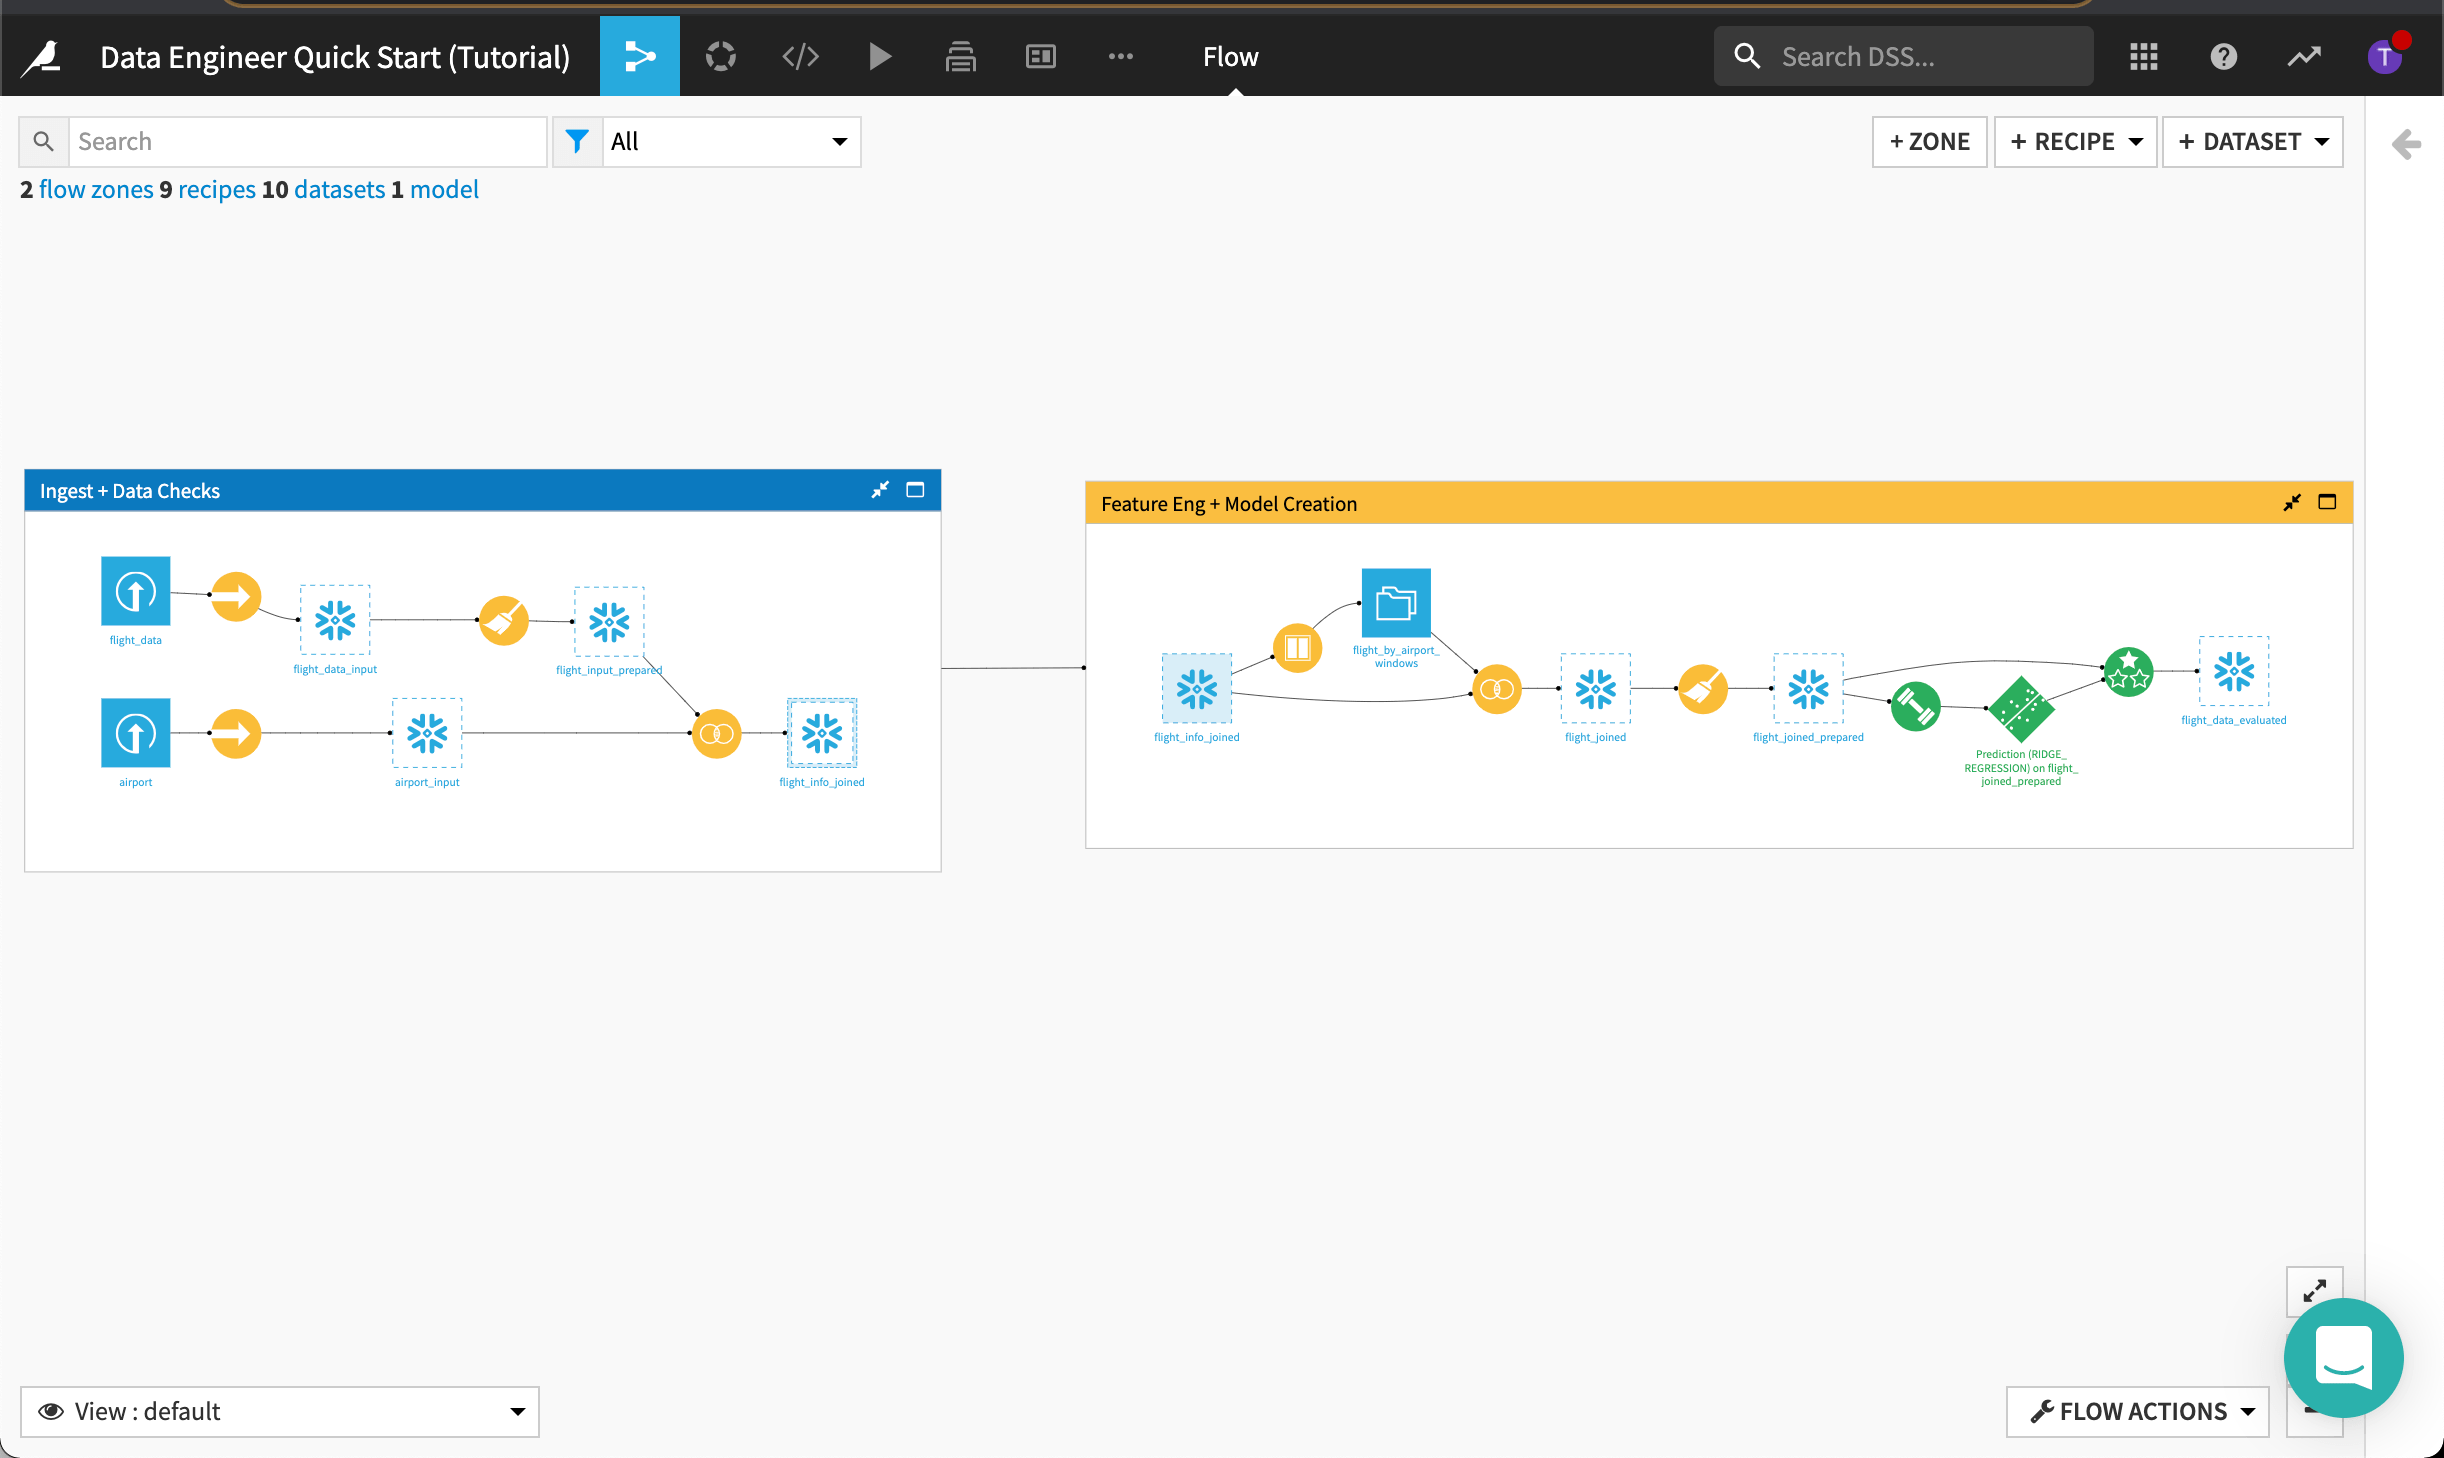
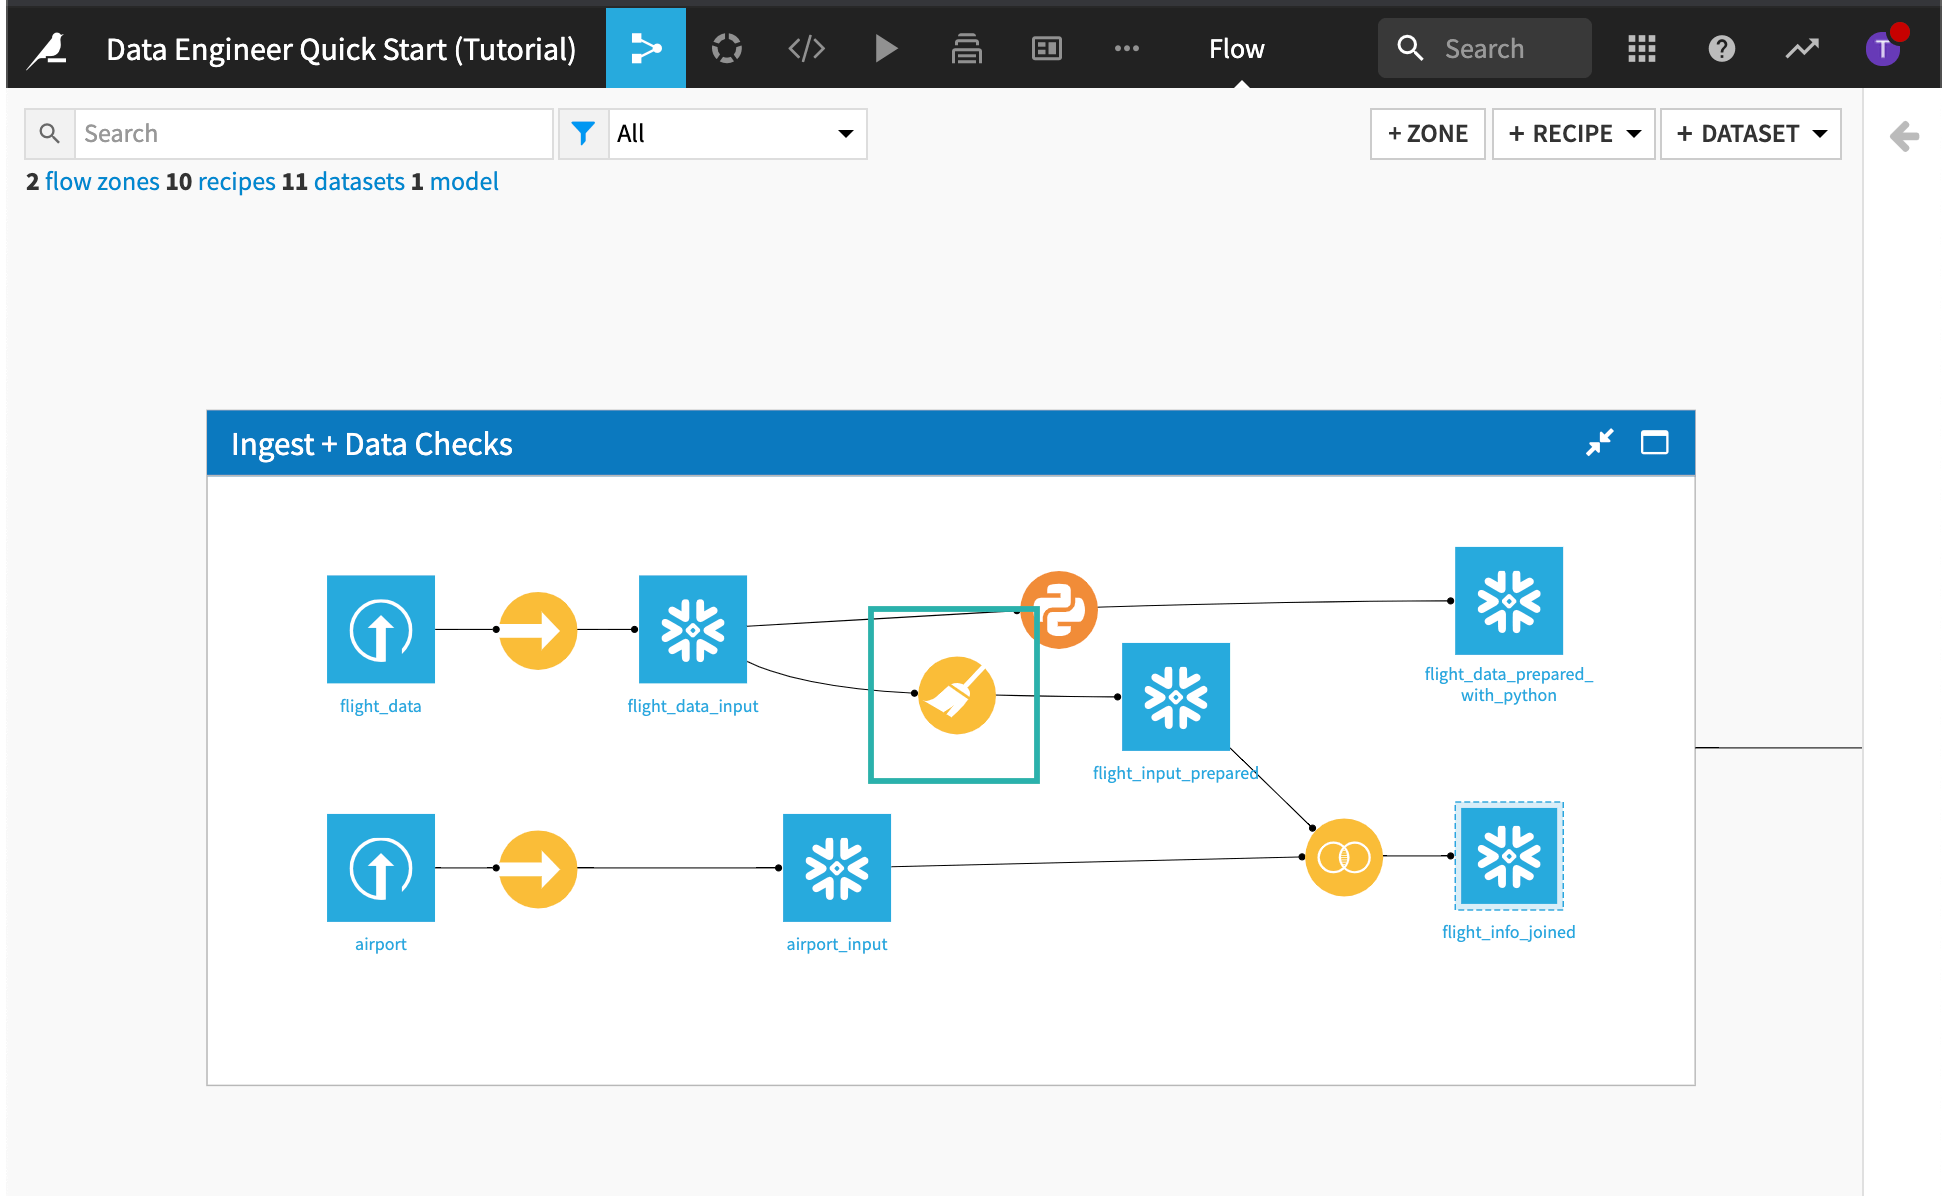
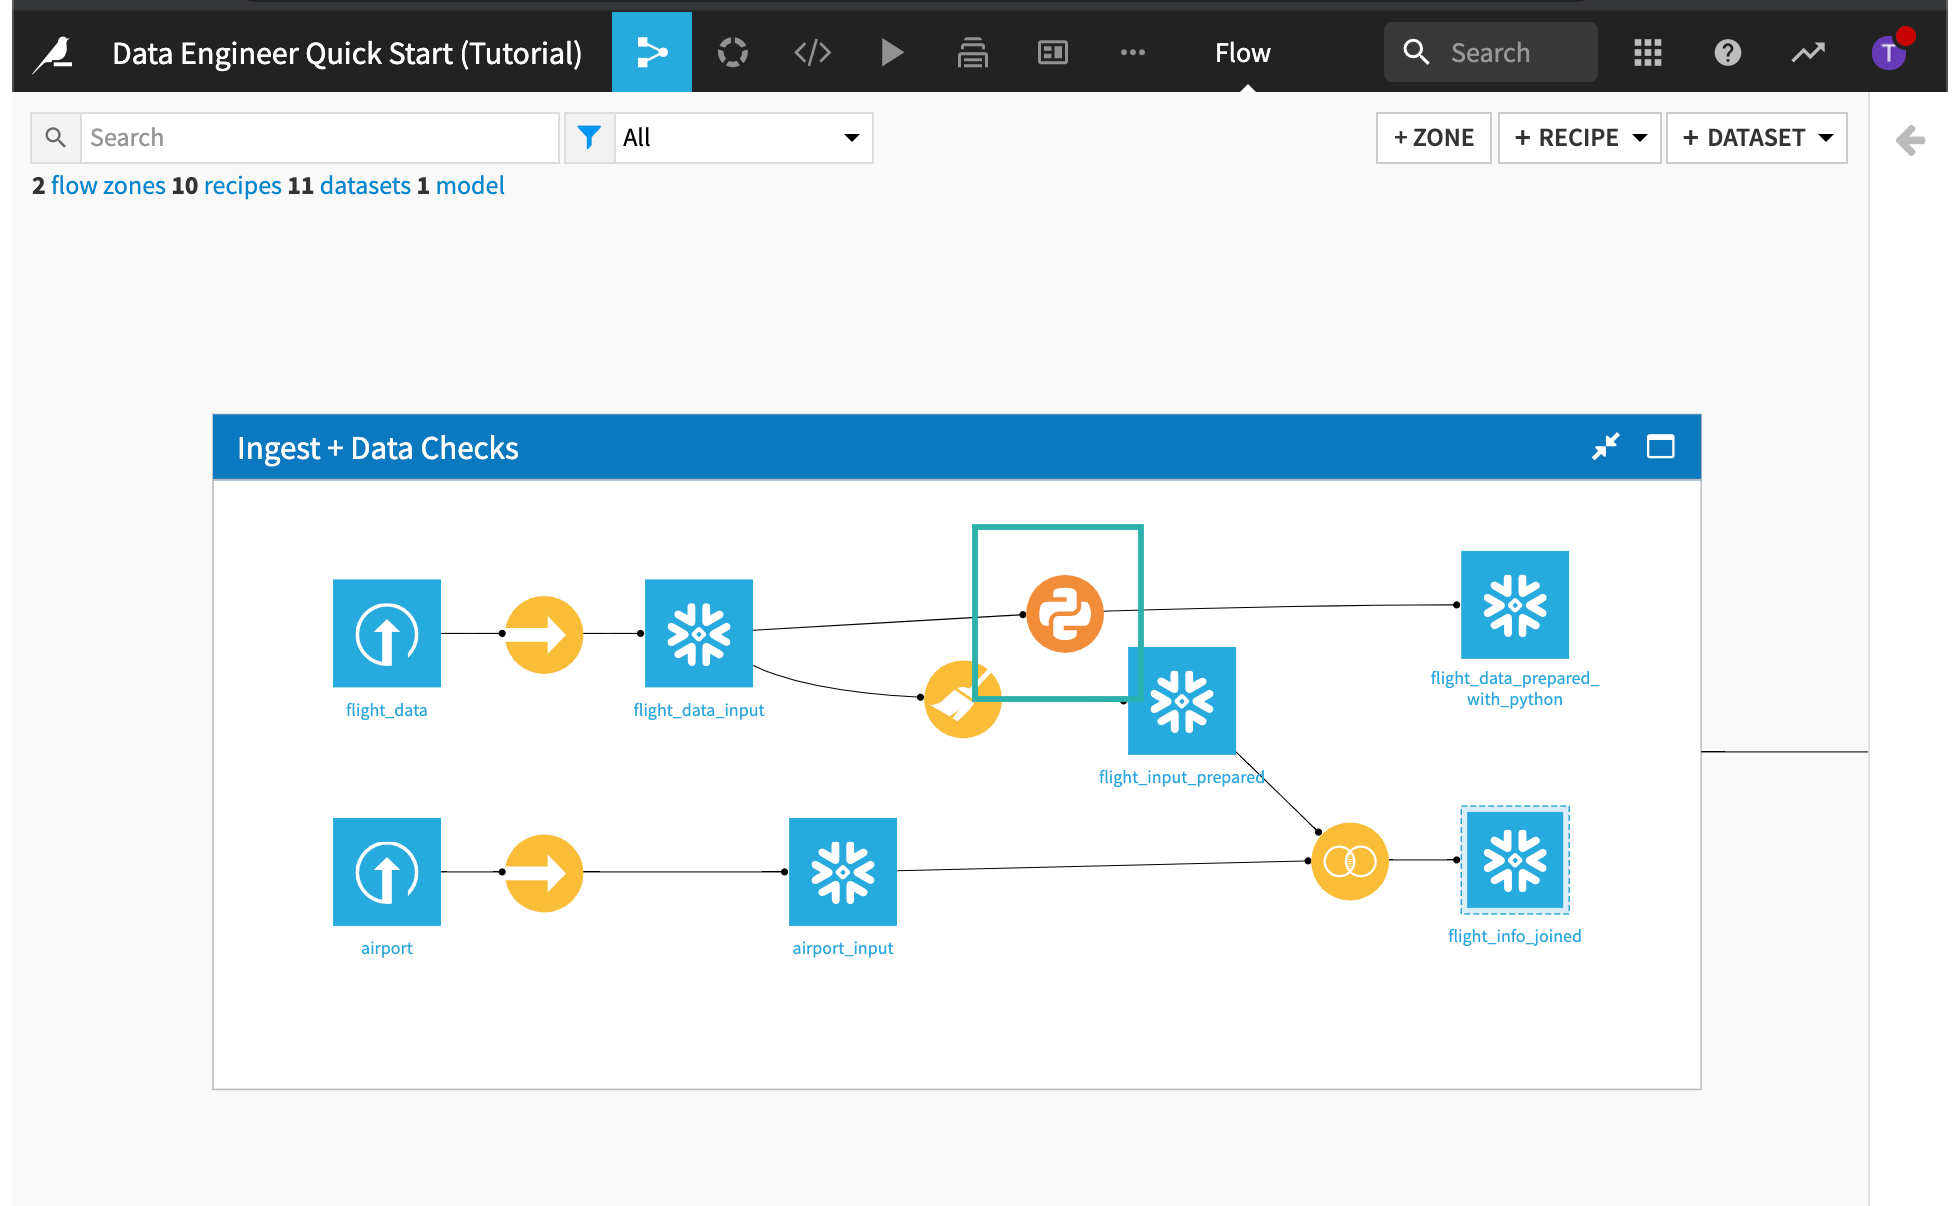
The flow of the project is organized into two Flow Zones: one for ingesting and checking the data and another zone for building the machine learning model pipeline. In this tutorial, we will cleanse the data that will be used by the machine learning model, but we will not be building the model.
The Flow is composed of data pipeline elements, including datasets and recipes. Recipes in Dataiku DSS are used to prepare and transform datasets–their icons are easy to spot in the Flow because they are round, whereas datasets are square.
Ingest + Data Checks Flow Zone
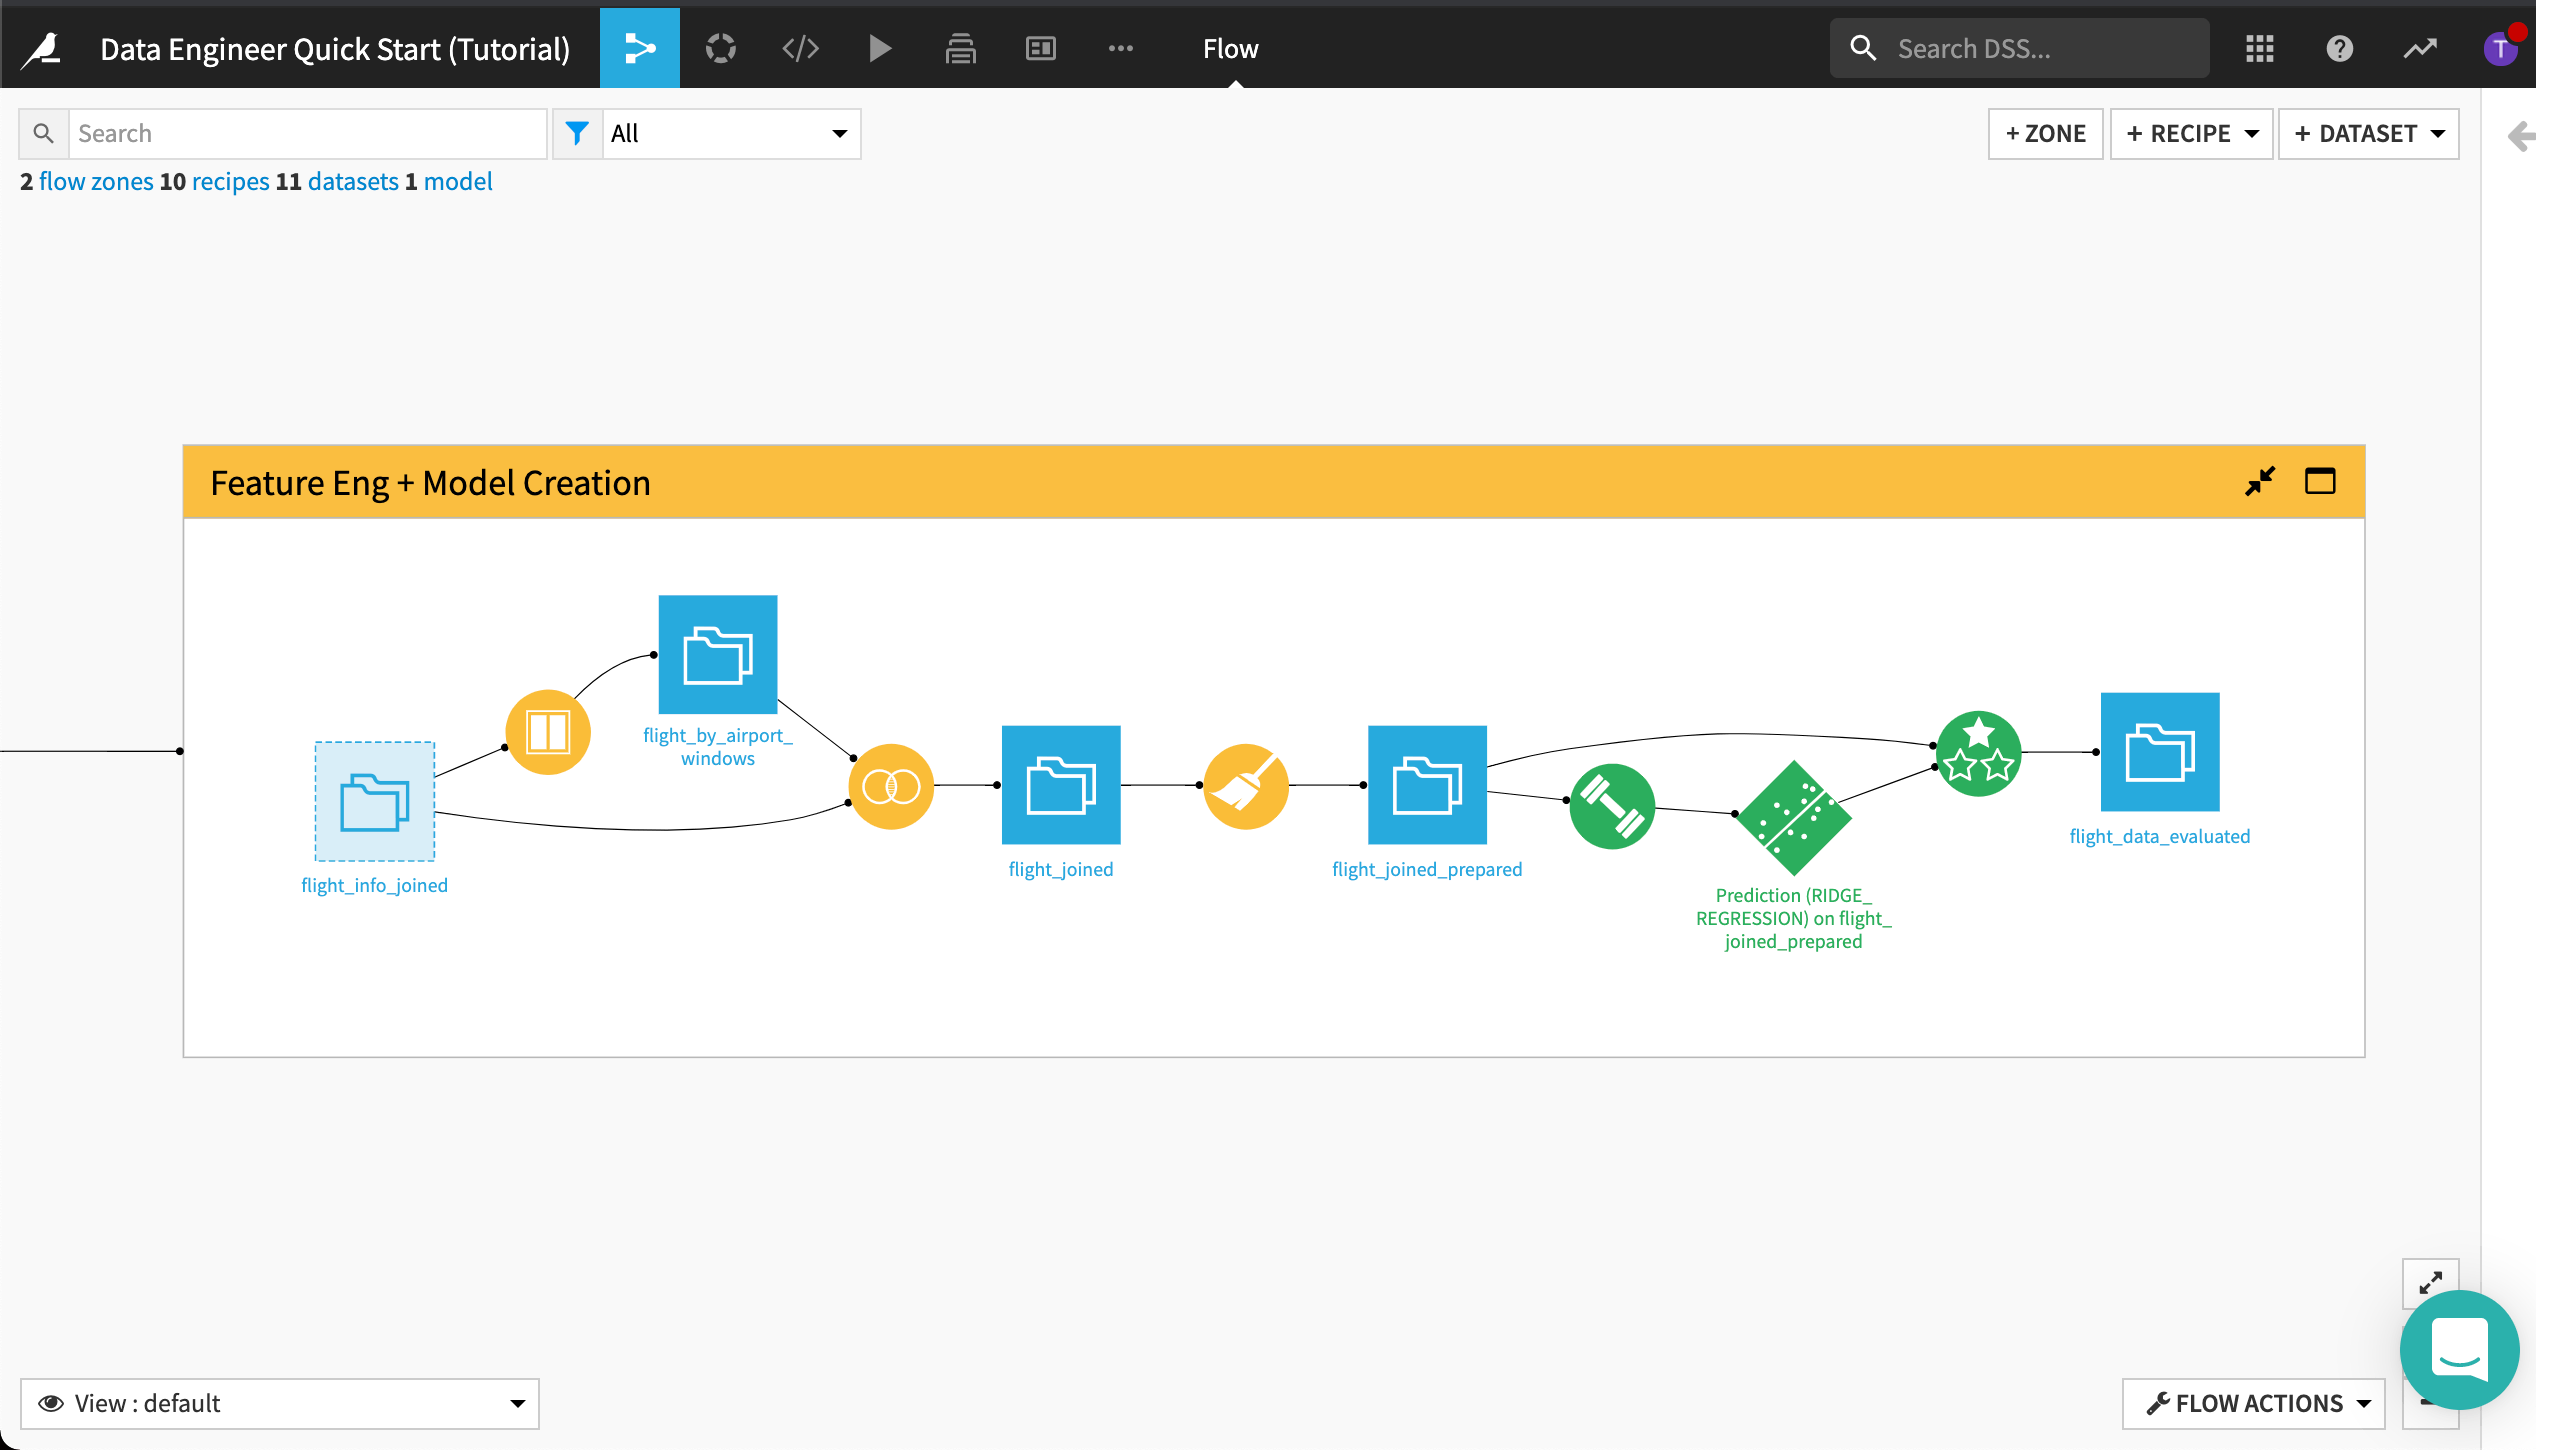
Feature Engineering + Model Creation Flow Zone
Connect to Data
When creating a new project in Dataiku DSS, you’ll likely have data coming from various sources such as SQL databases. Dataiku DSS makes it easy for you to connect to your data. In this section, we’ll remap the dataset connections and then build the datasets in the Flow.
Note
Non-coders can use the point-and-click interface to ingest and prepare data for model training, evaluation, and deployment.
Remap Dataset Connections
The datasets in this project are stored in a filesystem storage layer. We want to change the dataset connections so that the datasets are stored in an SQL database. If you are not using the Dataiku Online Trial from Snowflake Partner Connect, you can map the datasets in the Flow to your SQL database storage layer.
Tip
In Dataiku DSS, dataset connections in the Flow can be changed to any supported connector.
To remap the dataset connections:
Select all datasets in the Flow except for the first two input datasets.
Click the flight_data_input dataset in the first Flow Zone, to select it.
Hold down the Shift key and select the next dataset.
Continue until all datasets in both Flow Zones are selected.
Do not select the first two input datasets in the first Flow Zone.
With all the datasets selected, open the side panel by clicking the arrow at the top right corner of the page, then scrolling down to Other actions.
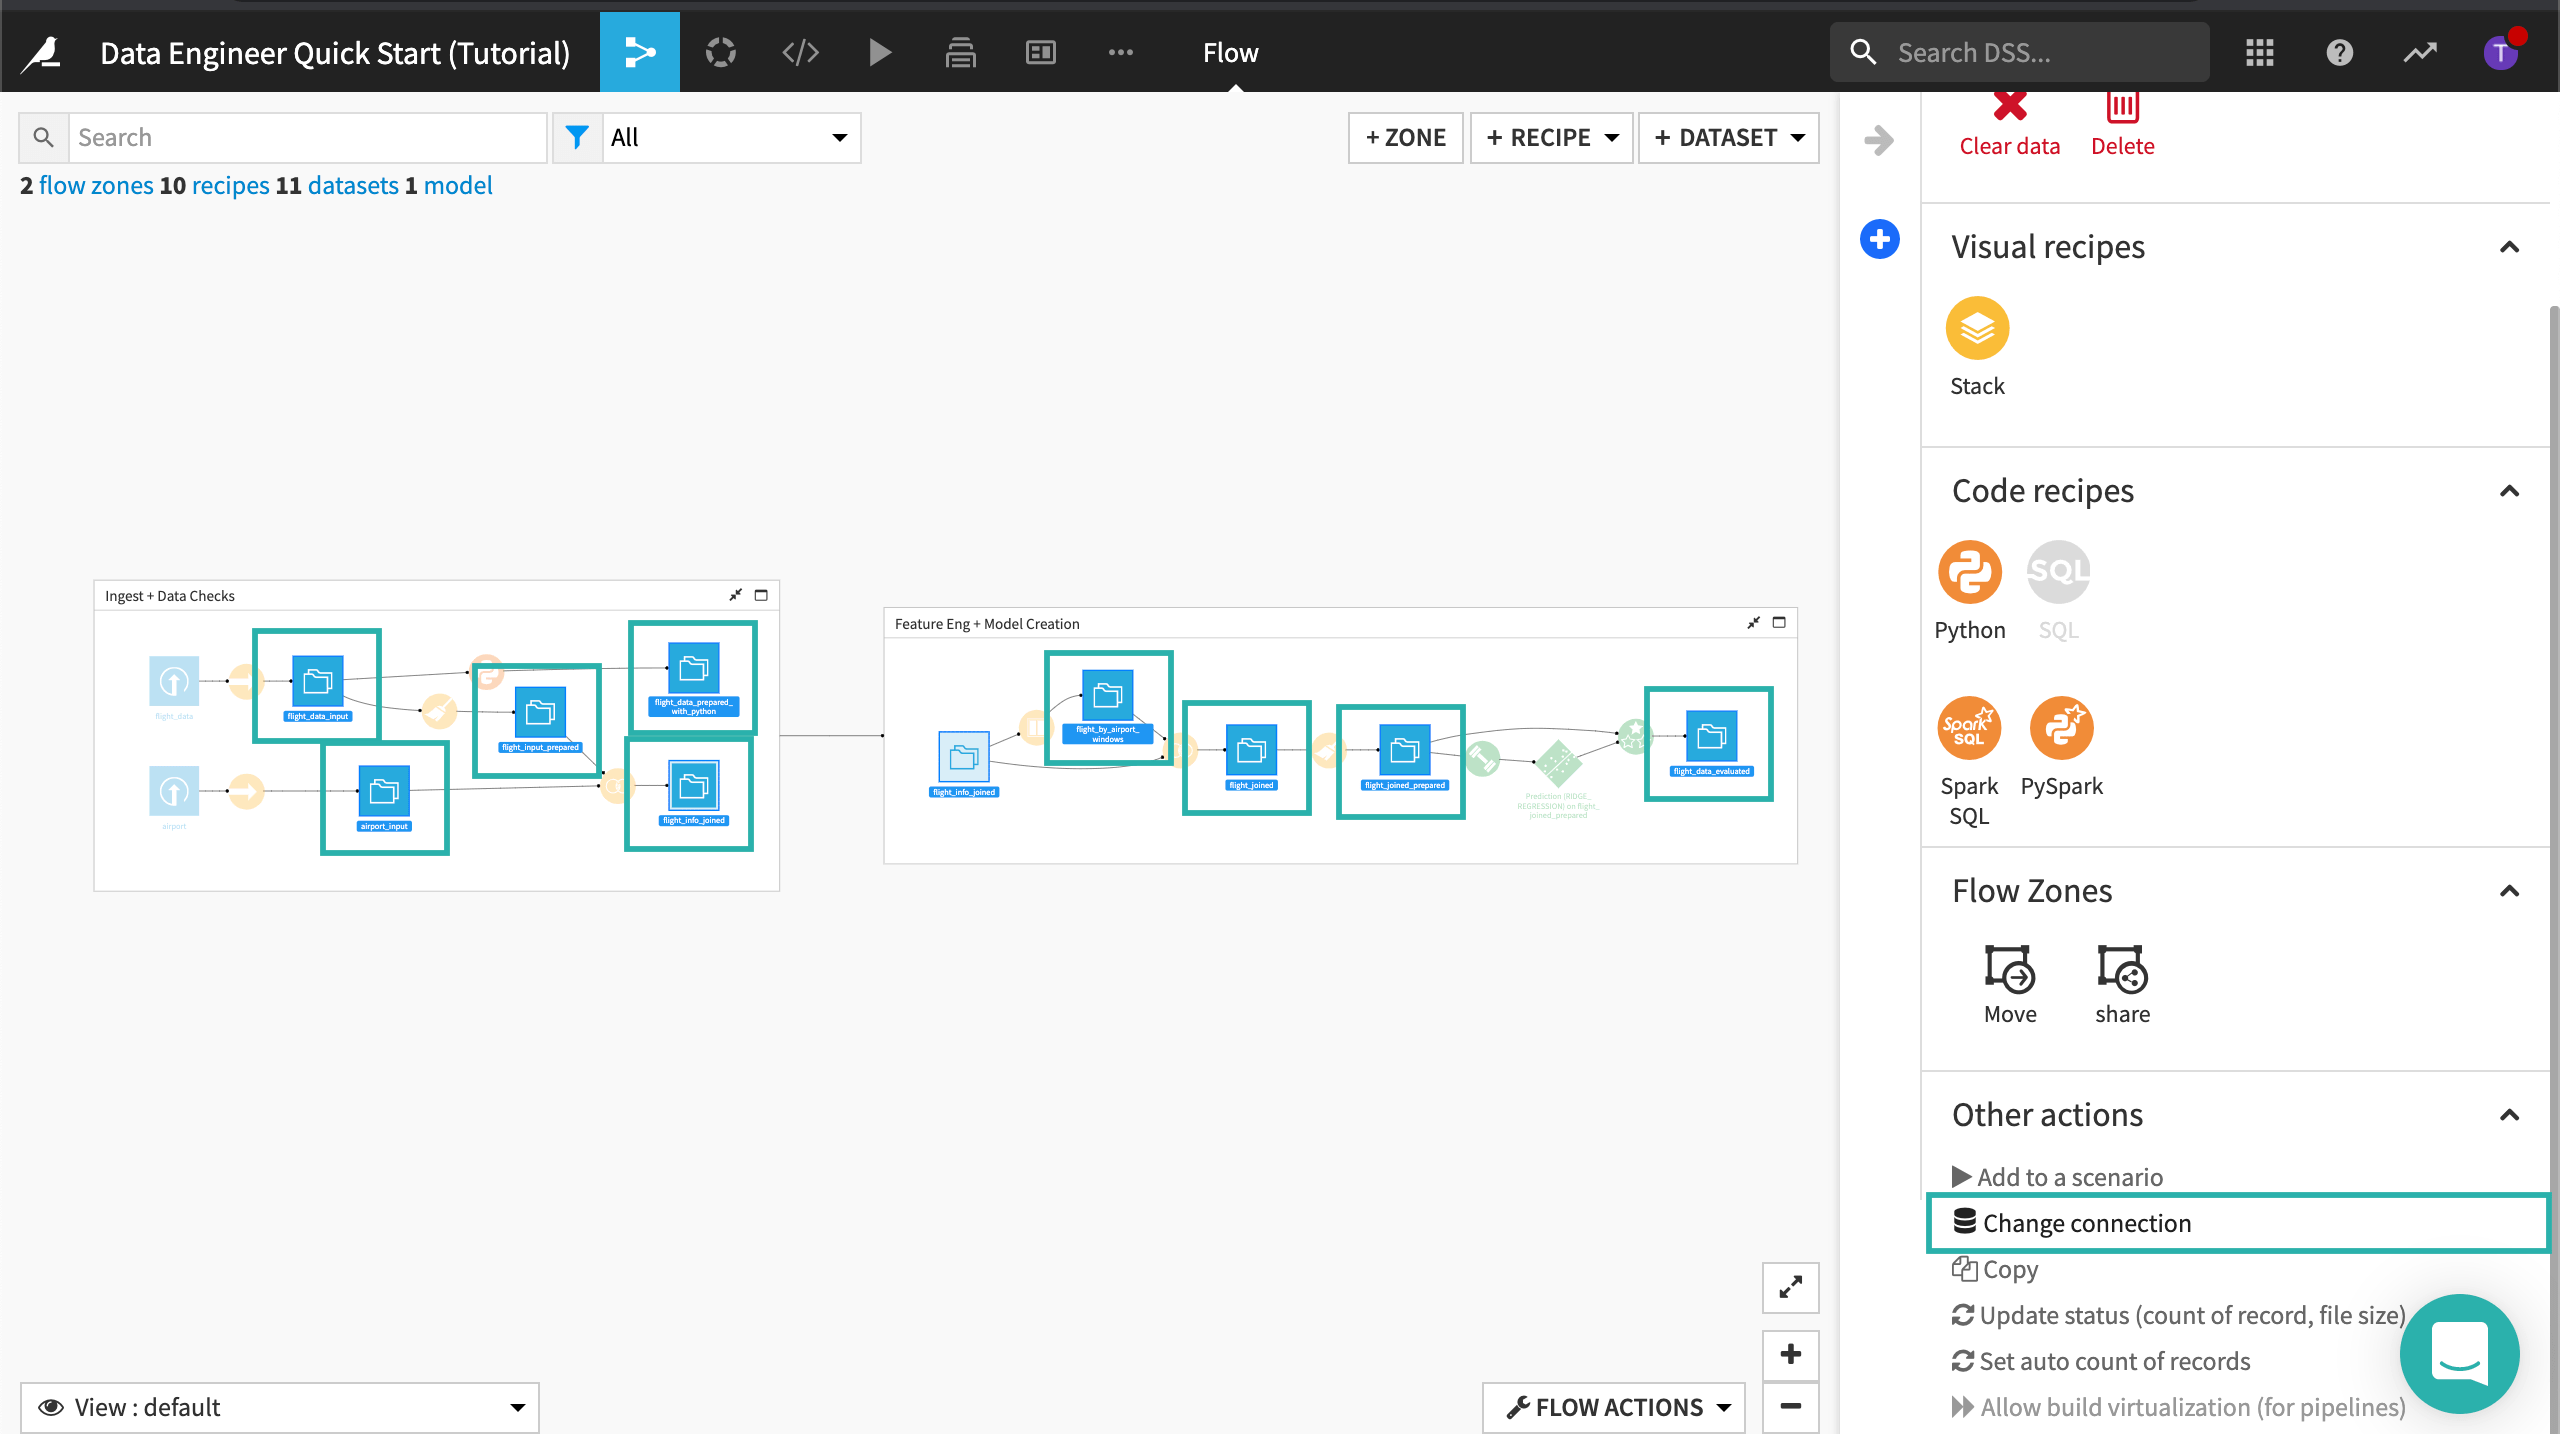
In Other actions, click Change connection.
Select New connection to view the available connections.
If you are using the Dataiku Online Trial from Snowflake Partner Connect, select the Snowflake connection; otherwise, select your SQL connection.
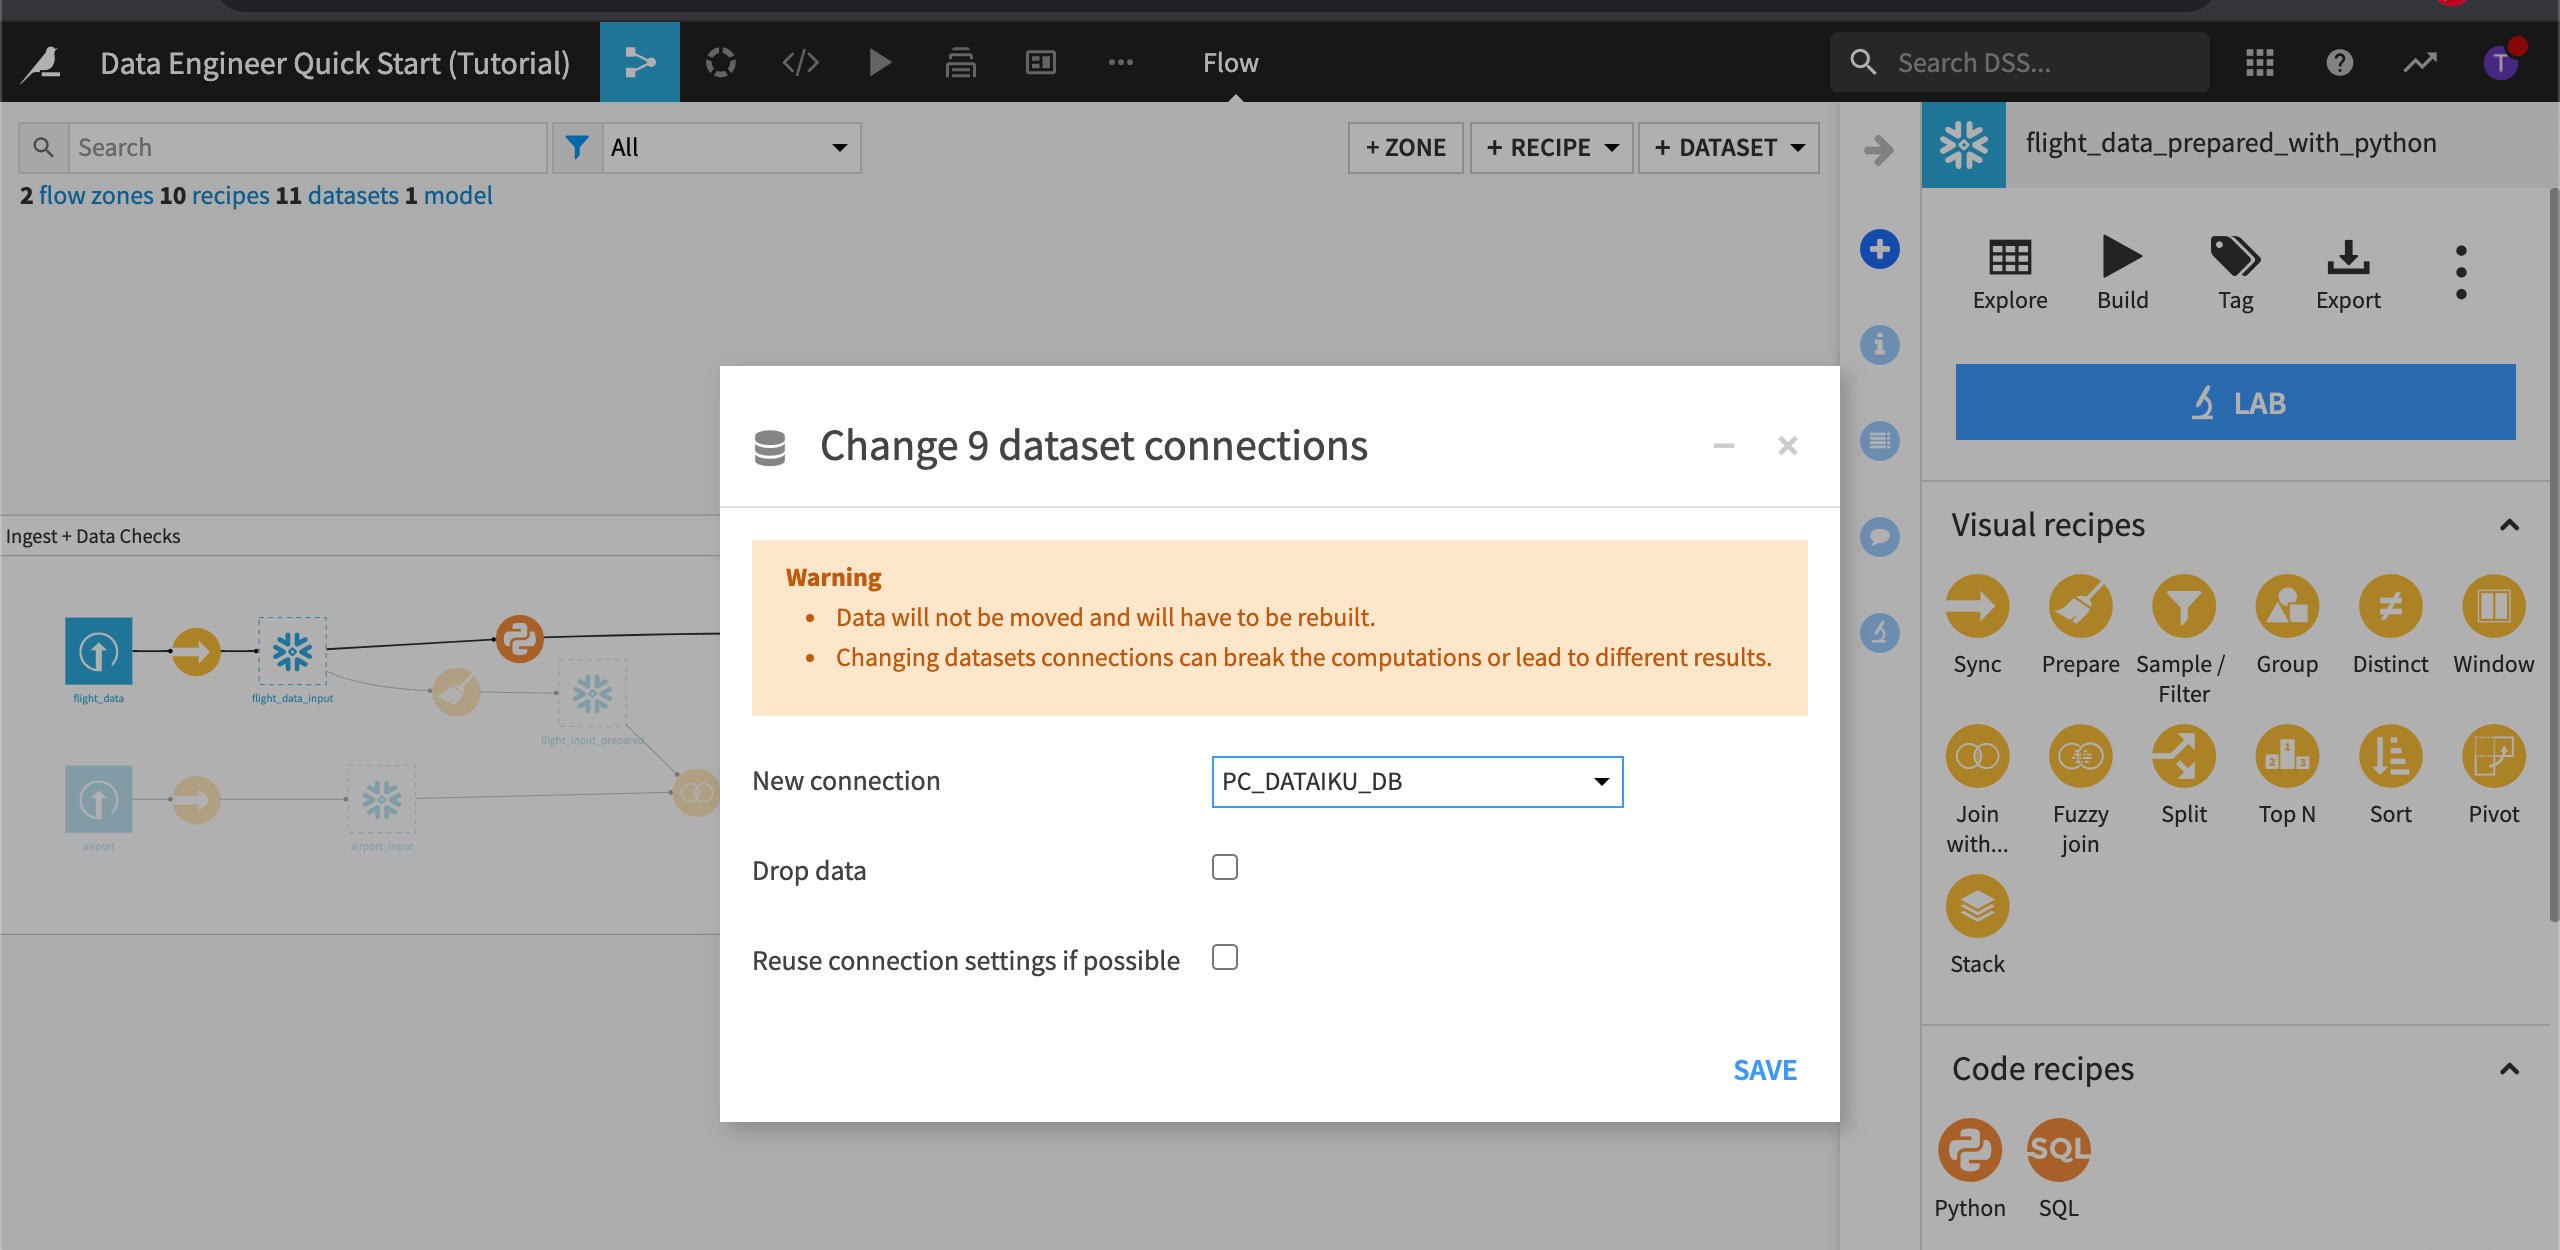
Note
Changing the dataset connection creates a copy of the data from one database to another database. The Drop data option drops the data from the original database. This can help reduce the amount of storage space used.
Click Save.
Close the right panel.
Build the Datasets
Now that the dataset connections have been remapped, we’ll build the datasets in the Flow.
To do this:
Click Flow Actions from the bottom-right corner of your window.
Select Build all and keep the default selection for handling dependencies.

Click Build.
Wait for the build to finish, and then refresh the page to see the built Flow. Wait time may be more than five minutes when using the Dataiku Online trial from Snowflake Partner Connect.
Note
Whenever we make changes to recipes within a Flow, or there is new data arriving in our source datasets, there are multiple options for propagating these changes. Visit Rebuilding Datasets to find out more.
Clean the Data
Data cleansing is a crucial step in the data preparation process. Dataiku DSS enables the data engineer to take control of the data quality discovery and resolution process by providing tools for cleaning datasets and engineering new features.
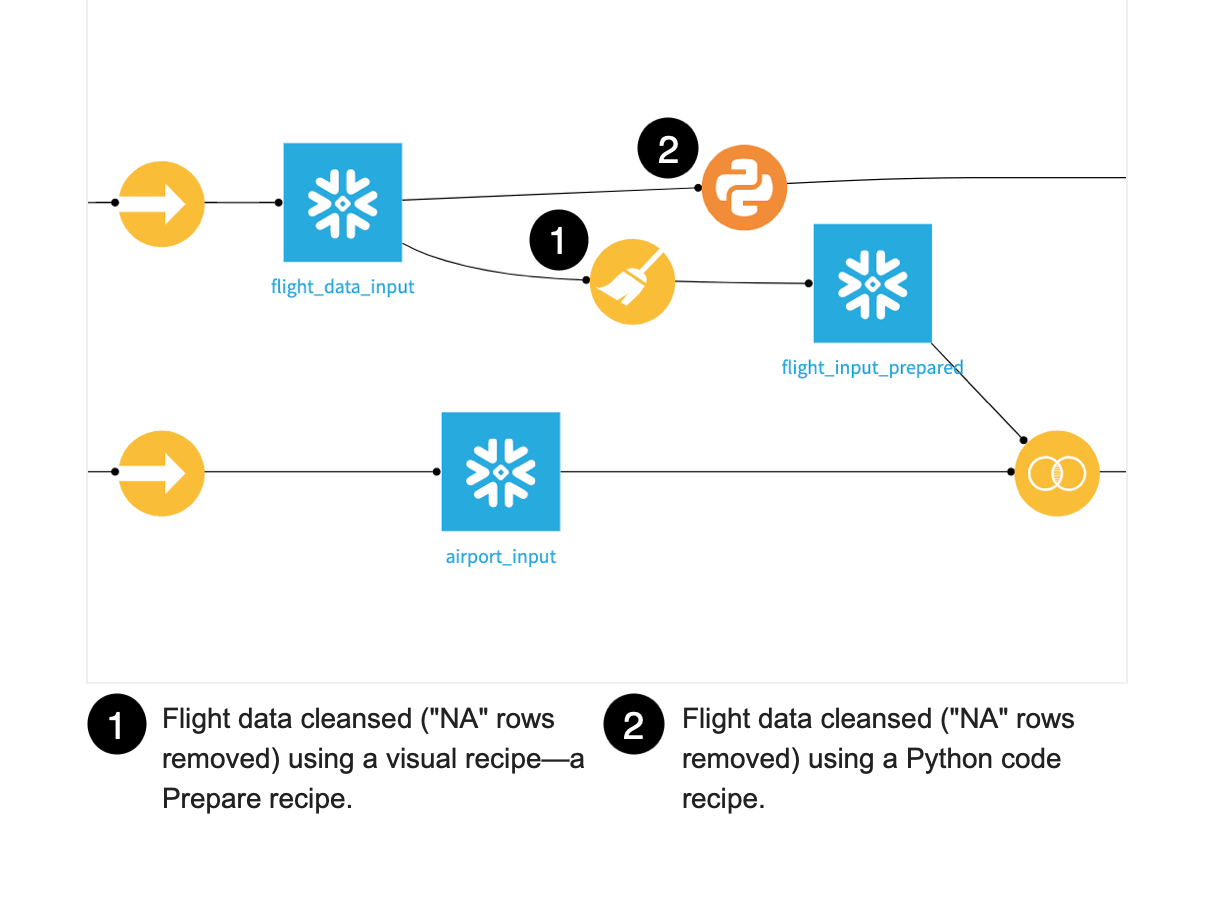
To demonstrate how this works, we’ll look for data quality issues with our flight data. For a comparison, we’ll discover how we can cleanse the data using two methods–a visual recipe and a code recipe.
Check for Data Quality Issues in the Flight Data
Sometimes you just want a quick way to analyze data quality and get instant statistics. The data quality bar lets you do this. To visually explore the quality of the data:
Open the flight_data_input dataset.
Visually analyze the column ArrDelay:
Locate the column, ArrDelay.
Press “c” on your keyboard to bring up the column search.
Type
ArrDelay.
Hover over the data quality bar under the column.
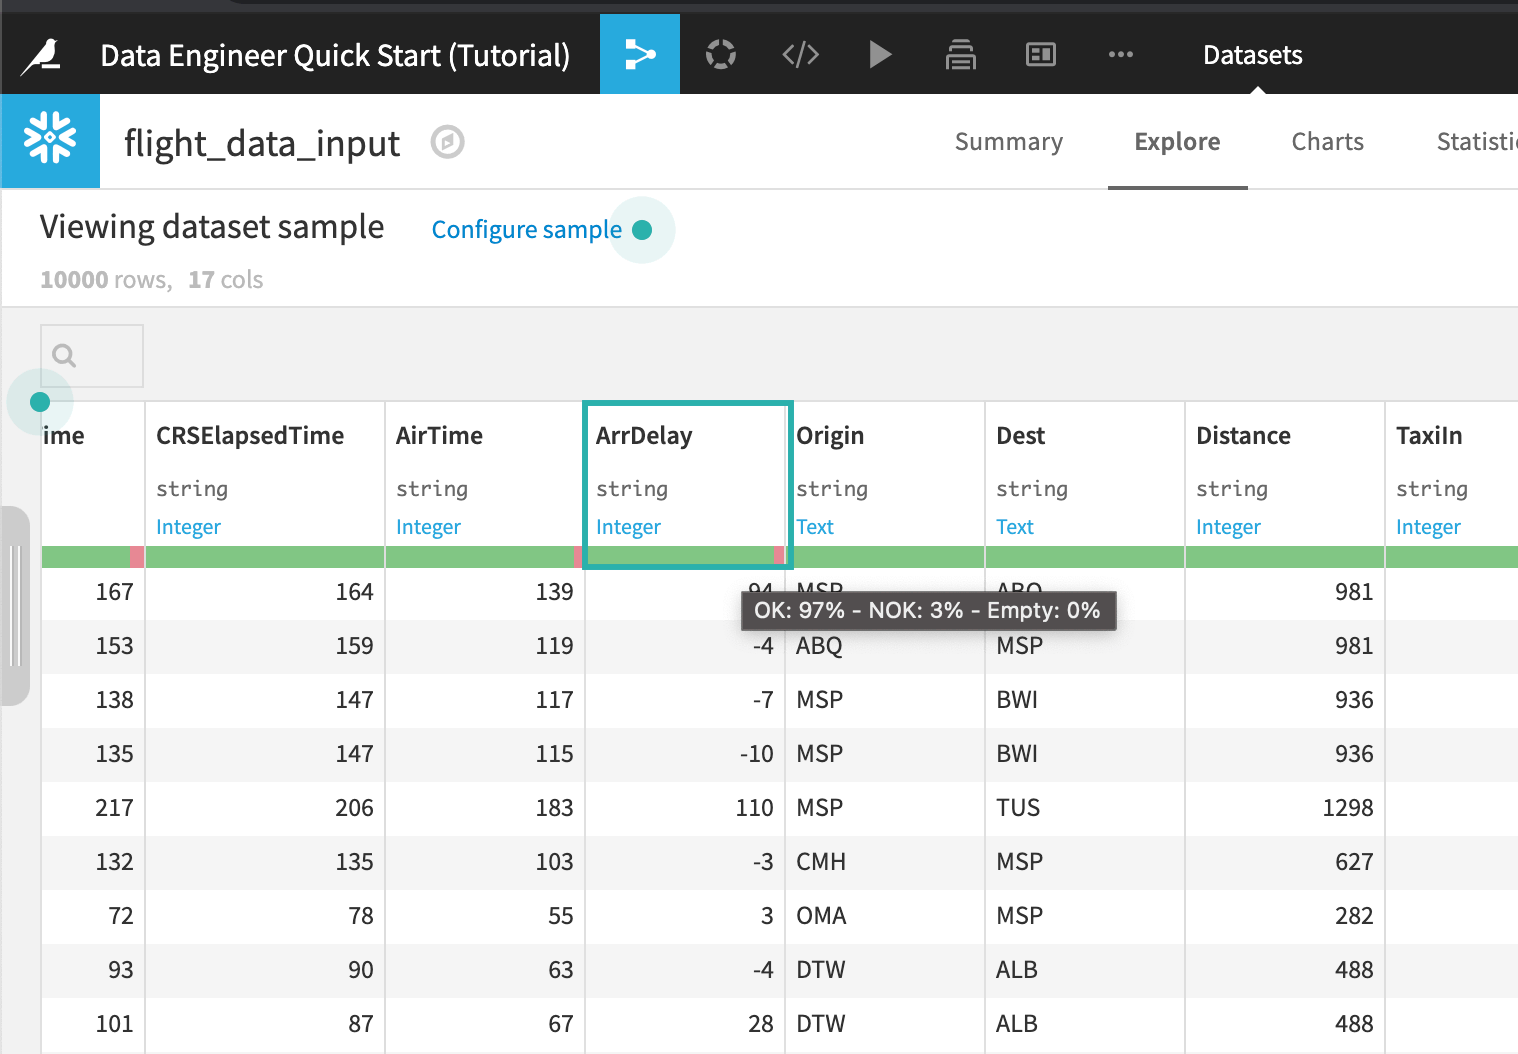
By default, the Explore views shows a data quality bar, which shows which rows are valid for their meaning.
Note
When exploring and preparing data in DSS, you always get immediate visual feedback, no matter how big the dataset that you are manipulating. To achieve this, DSS works on a sample of your dataset.
View the percentage of invalid rows:
Click the column header of the column ArrDelay.
Choose the Filter.
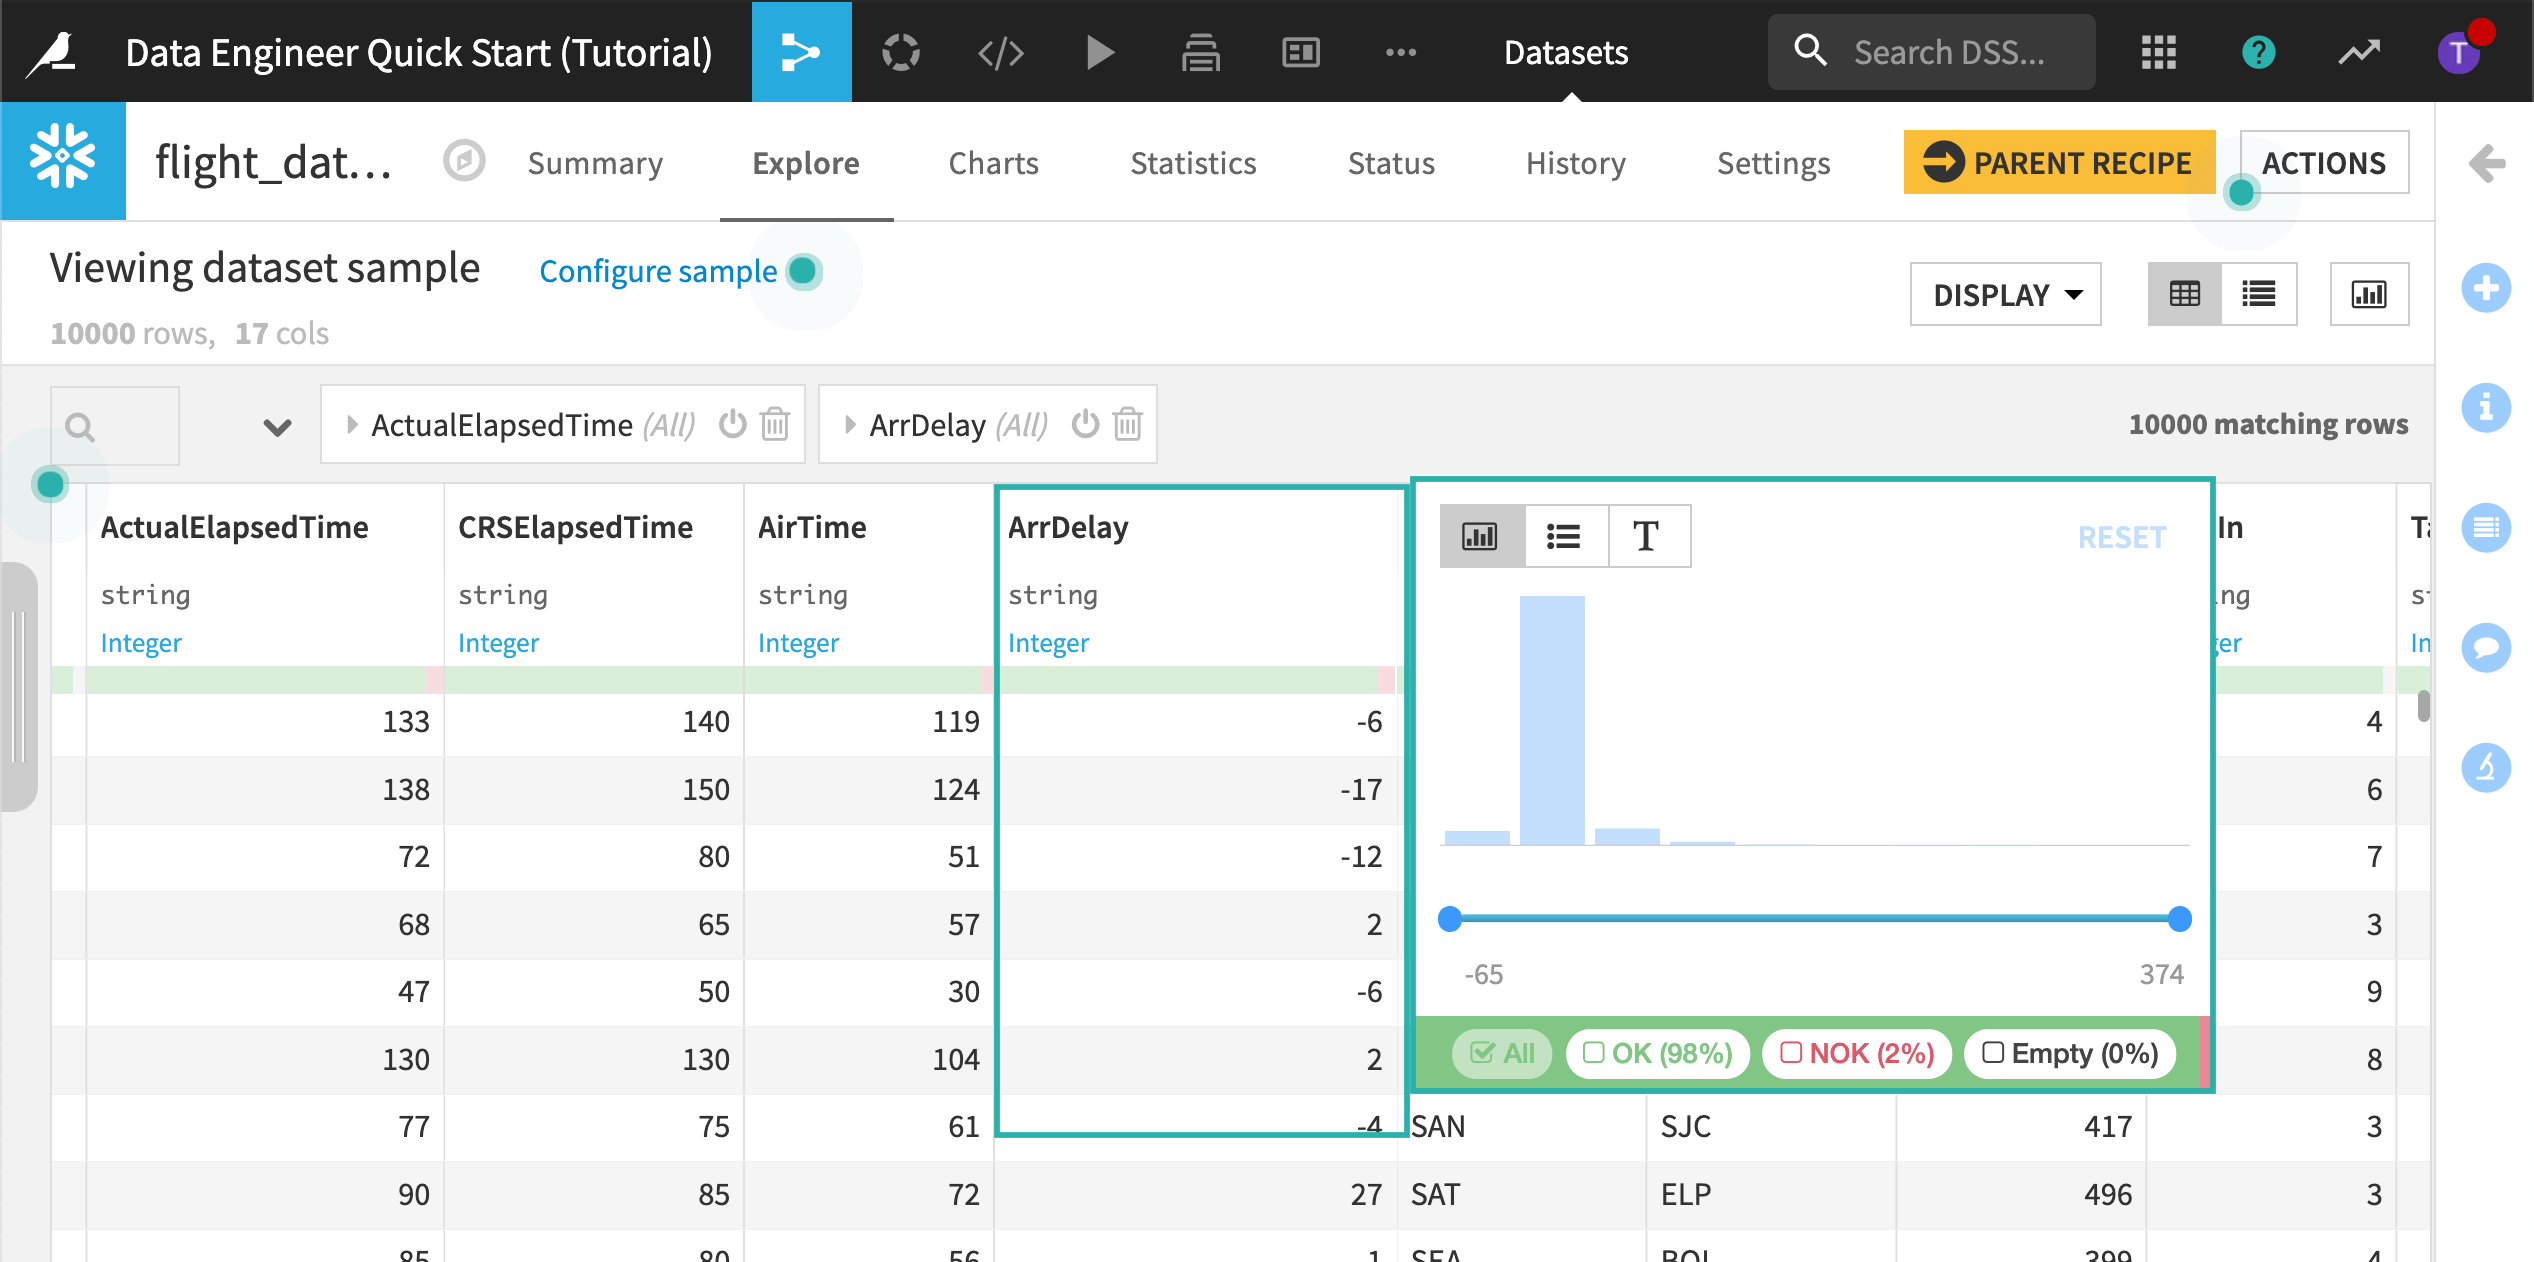
The filter view lets us know that approximately 3% of the rows in the current sample do not match the inferred meaning. Each invalid row has a value that is equal to “NA” and cannot be used to train the model. For the purposes of this tutorial, we’ll remove the “NA” records.
Close the filter view without making any changes.
Note
There are more than 90 visual recipes where you can prepare, explore, enrich, and analyze your data visually.
Cleanse the Flight Data Using a Visual Recipe
We can visually remove the invalid records using a visual recipe, called a Prepare recipe. The Prepare recipe’s processors library lets us visually perform our data cleansing and transformation steps.
Return to the Flow.
Open the Prepare recipe that was used to create flight_input_prepared.
Remove “NA” Rows
The first step removes all rows where ArrDelay is equal to “NA”.
Click the first step in the script to expand it.
This step was created by clicking the column’s header, selecting the Analyze function, and then applying the Remove rows action from the Mass Actions menu.
Replace Values in a Column
Click the second step in the script to expand it.
This step replaces the value “24:0” with “00:00” in the departure date and arrival date columns.
Process Dates
Click the “Date Processing” group in the script to expand it and view its steps.
This group of steps parses the departure date, extracts date components from the newly parsed departure date, and finally, removes the unneeded columns.
Return to the Flow without saving any changes you might have made to the visual recipe.
Cleanse the Flight Data Using a Code Recipe
Anything you do visually in Dataiku DSS can also be done in coding languages including R, Python, and SQL. Using a code recipe, we can perform the same data cleansing step as in the visual recipe. To do this we will use Python, but we could use any of the code recipes in DSS.
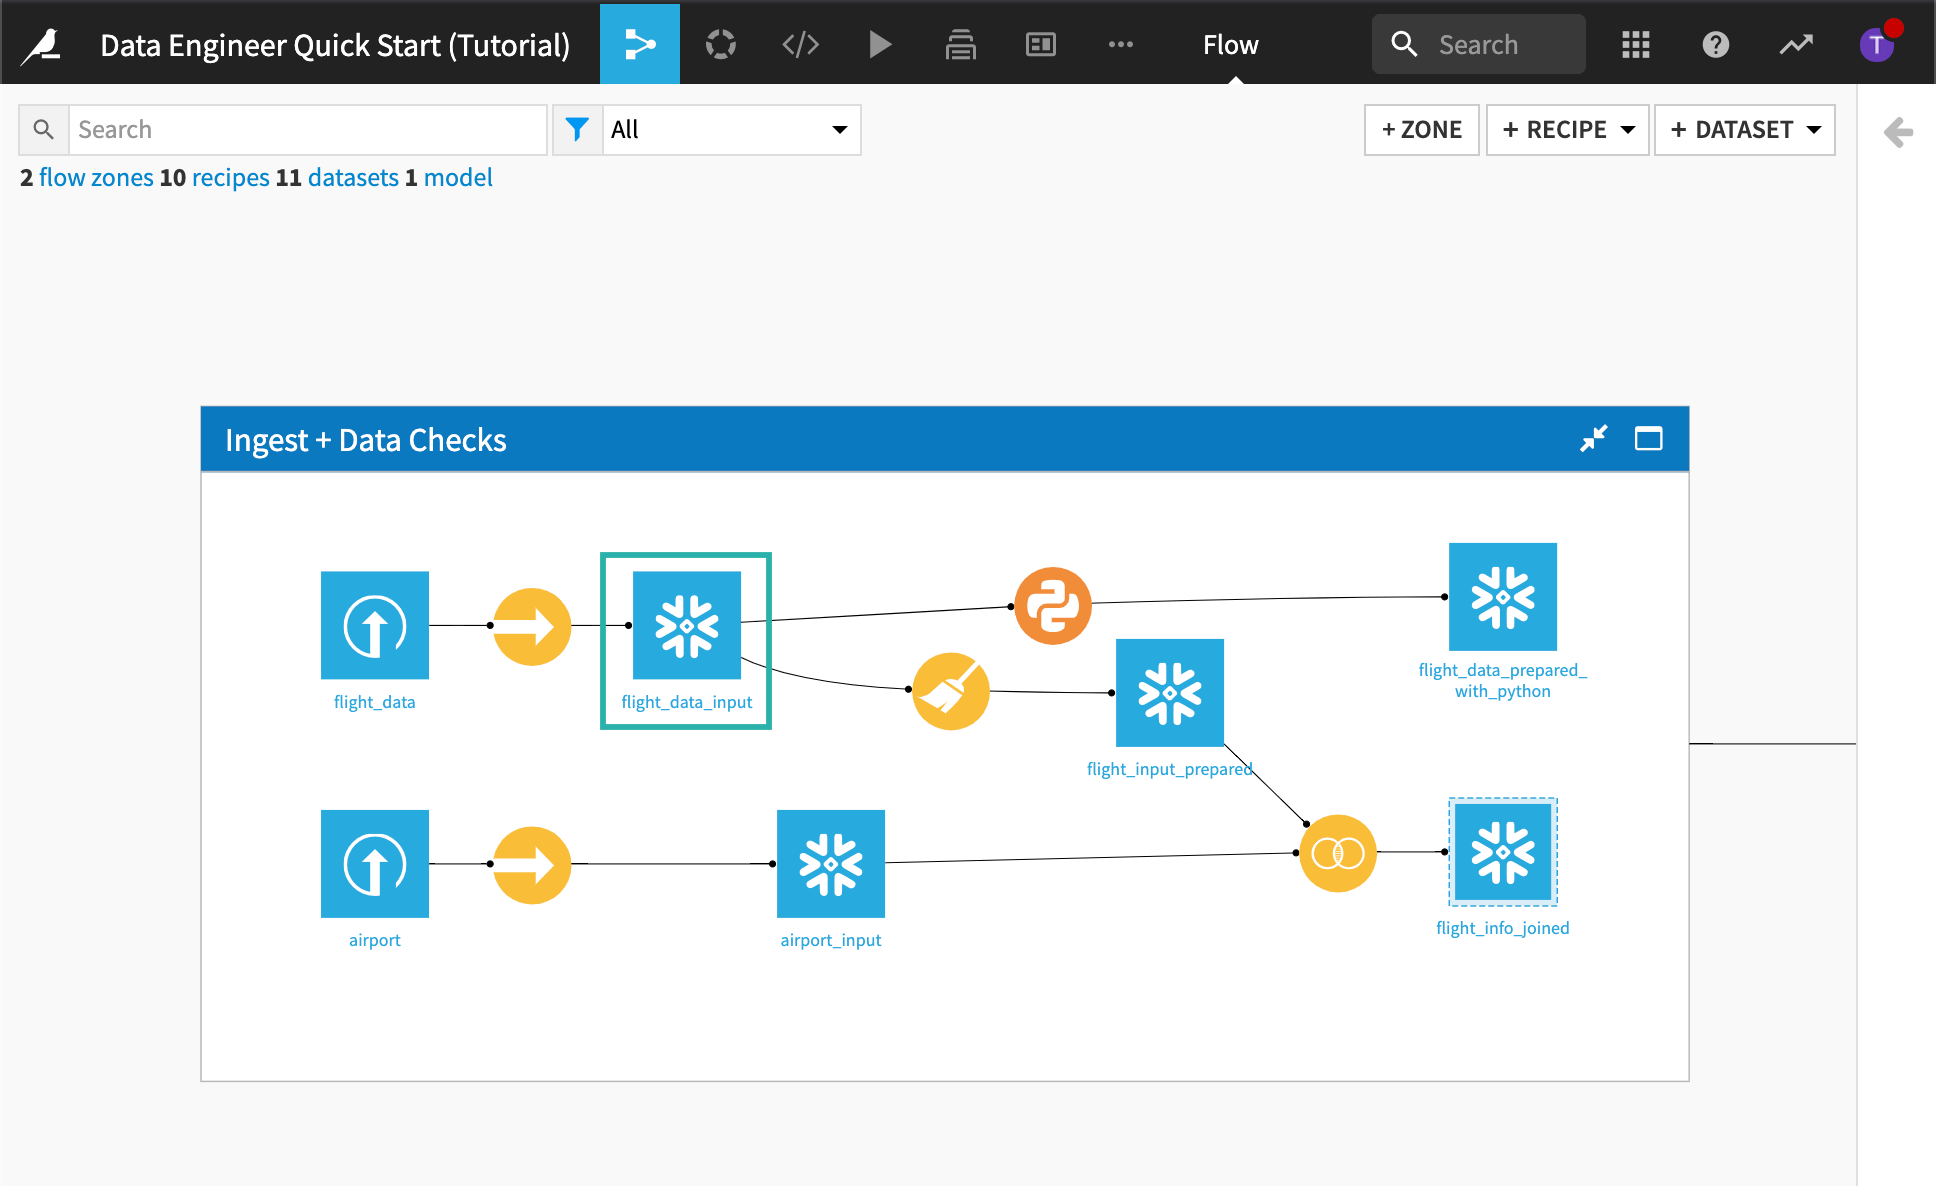
From the Flow, open the Python recipe that was used to create flight_data_prepared_with_python.
This code recipe performs the same steps as the visual recipe.
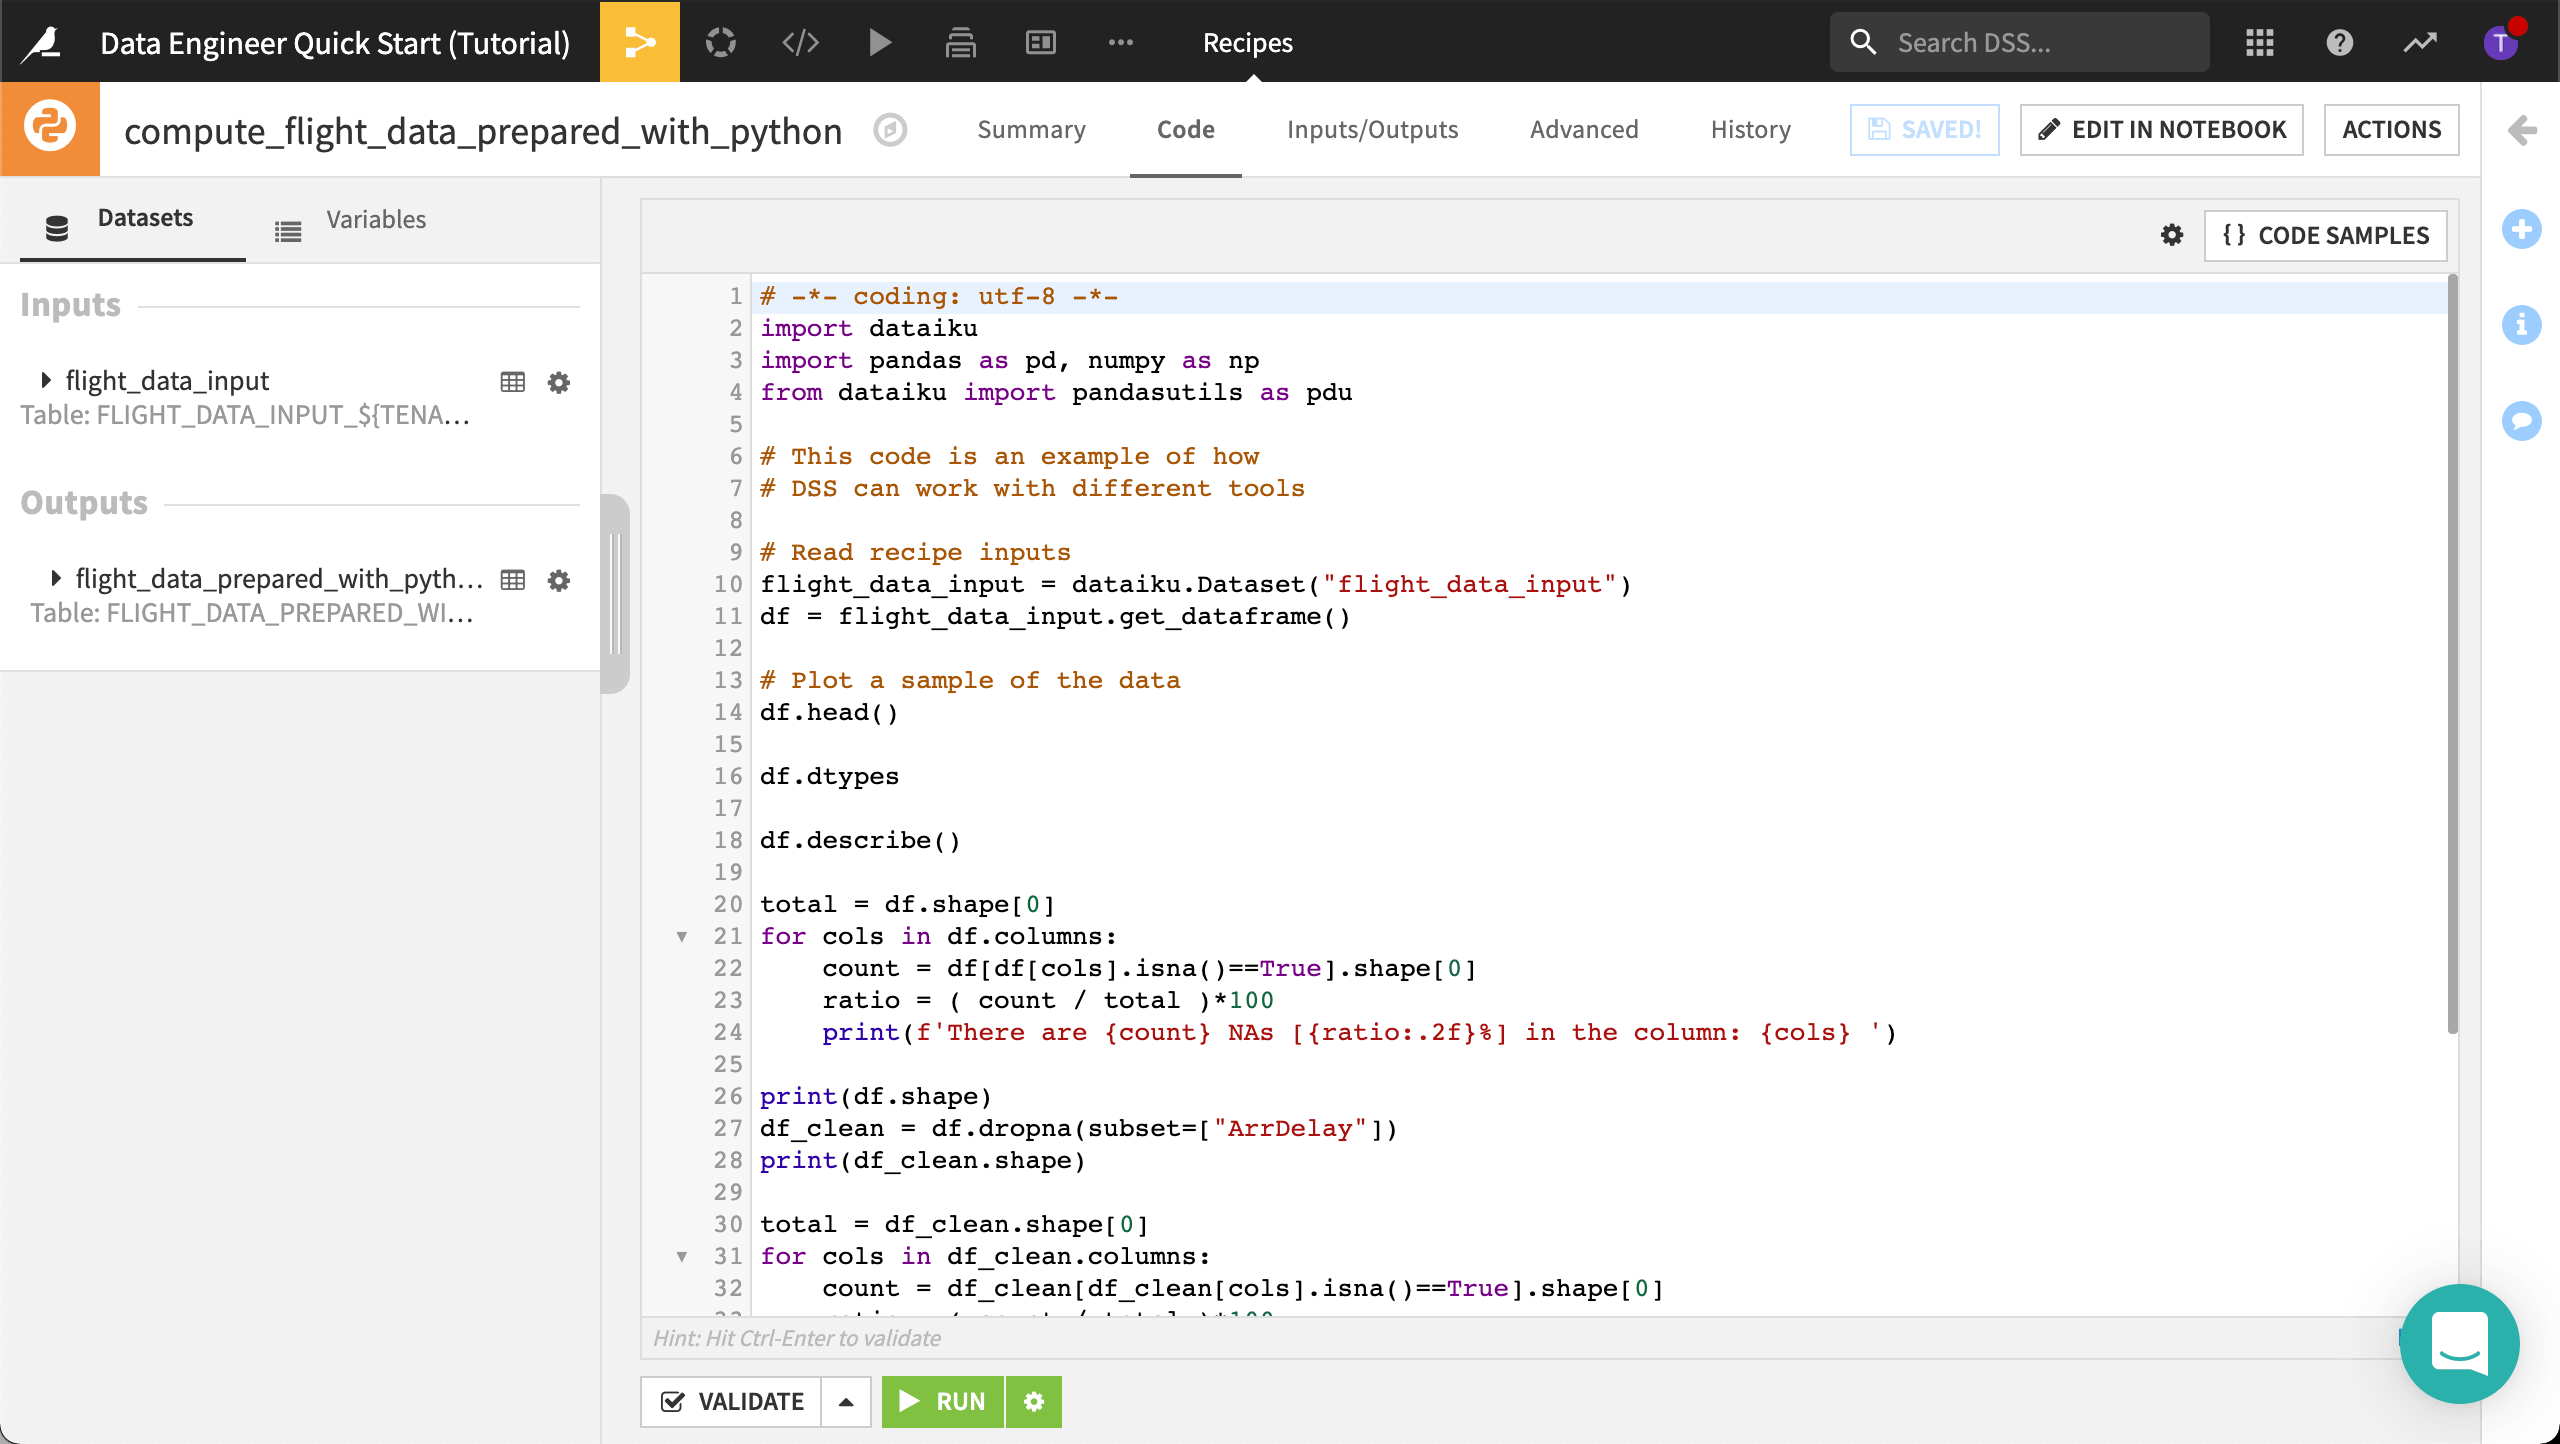
You could edit this code in a notebook and continue interactively analyzing the dataset. To find out more, visit Using Jupyter Notebooks in DSS.
Configure Dataset Consistency Checks
Having to constantly compare dataset metric values with expected values can quickly become a tedious task. You can use Dataiku DSS to speed up tasks like scenario-based programmable triggers, data consistency checks, and recursive dataset building.
By setting up dataset metrics and checks, we can ask Dataiku DSS to automatically assess the datasets in the Flow–giving us the ability to compare metric values with expected values or ranges. This helps ensure that the automated Flow runs with expected results. We can also check that the Flow runs within expected timeframes.
When data pipeline items, such as datasets, fail checks, Dataiku DSS returns an error, prompting investigation, which promotes quick resolution.
In this section, we’ll establish metrics and checks on datasets both visually and with code (for comparison purposes).
Note
Key concept: Metrics and Checks
The metrics system provides a way to compute various measurements on objects in the Flow, such as the number of records in a dataset or the time to train a model.
The checks system allows you to set up conditions for monitoring metrics. For example, you can define a check that verifies that the number of records in a dataset never falls to zero. If the check condition is not valid anymore, the check will fail, and the scenario will fail too, triggering alerts.
You can also define advanced checks like “verify that the average basket size does not deviate by more than 10% compared to last week” By combining scenarios, metrics, and checks, you can automate the updating, monitoring and quality control of your Flow.
Our upstream datasets, flight_data_input and flight_input_prepared will change whenever we have fresh data. Because of this, we’ll want Dataiku DSS to check for dataset consistency. We can then use the conditions to tell Dataiku DSS what to do when a condition is met. Later, we’ll discover how to automate the checks.
Let’s take a look at the types of metrics that we’ll be checking for.
Go to the Flow.
Open the dataset, flight_data_input.
Navigate to the Status tab.
Click Compute.
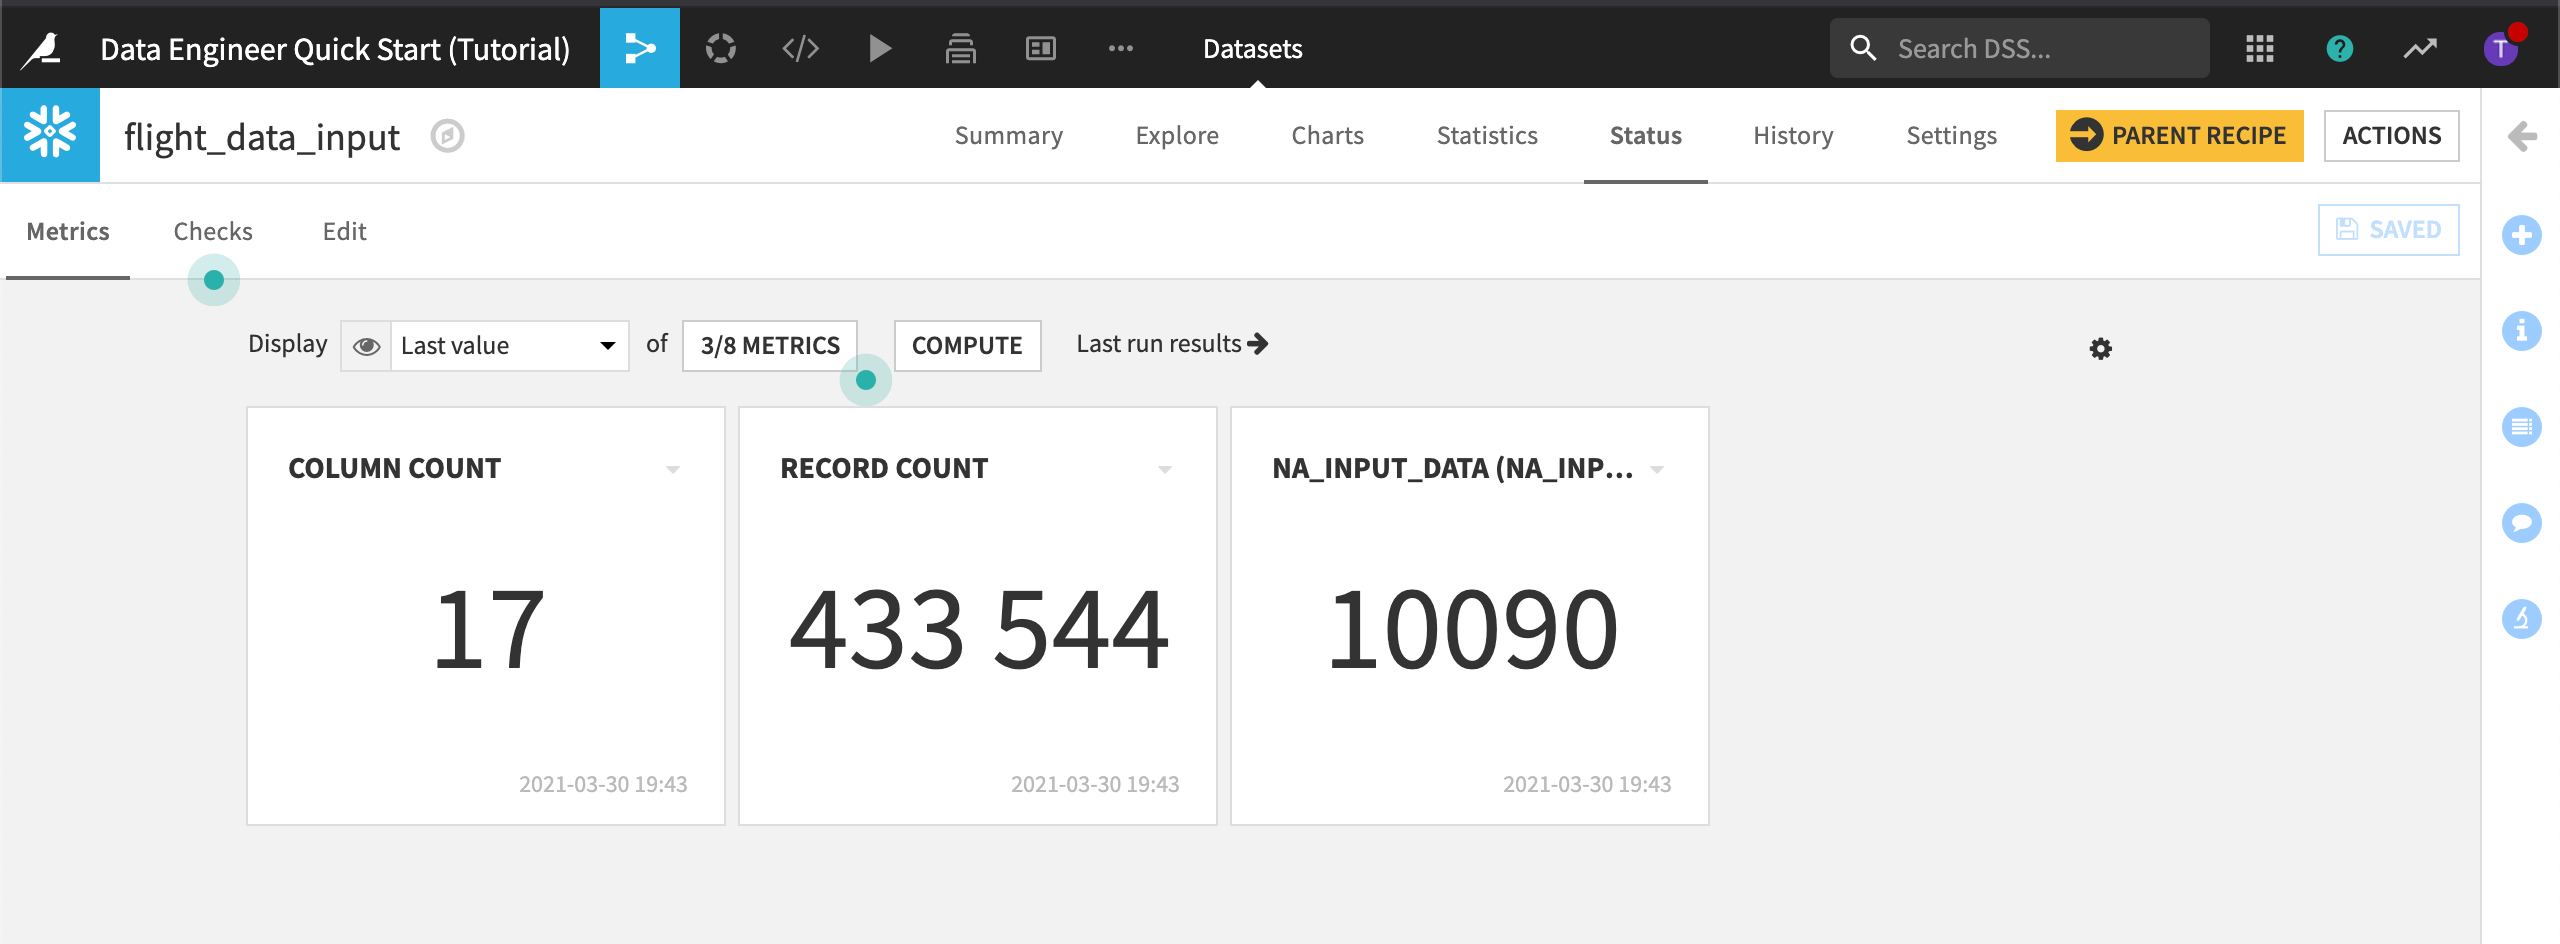
These metrics count the number of columns and records.
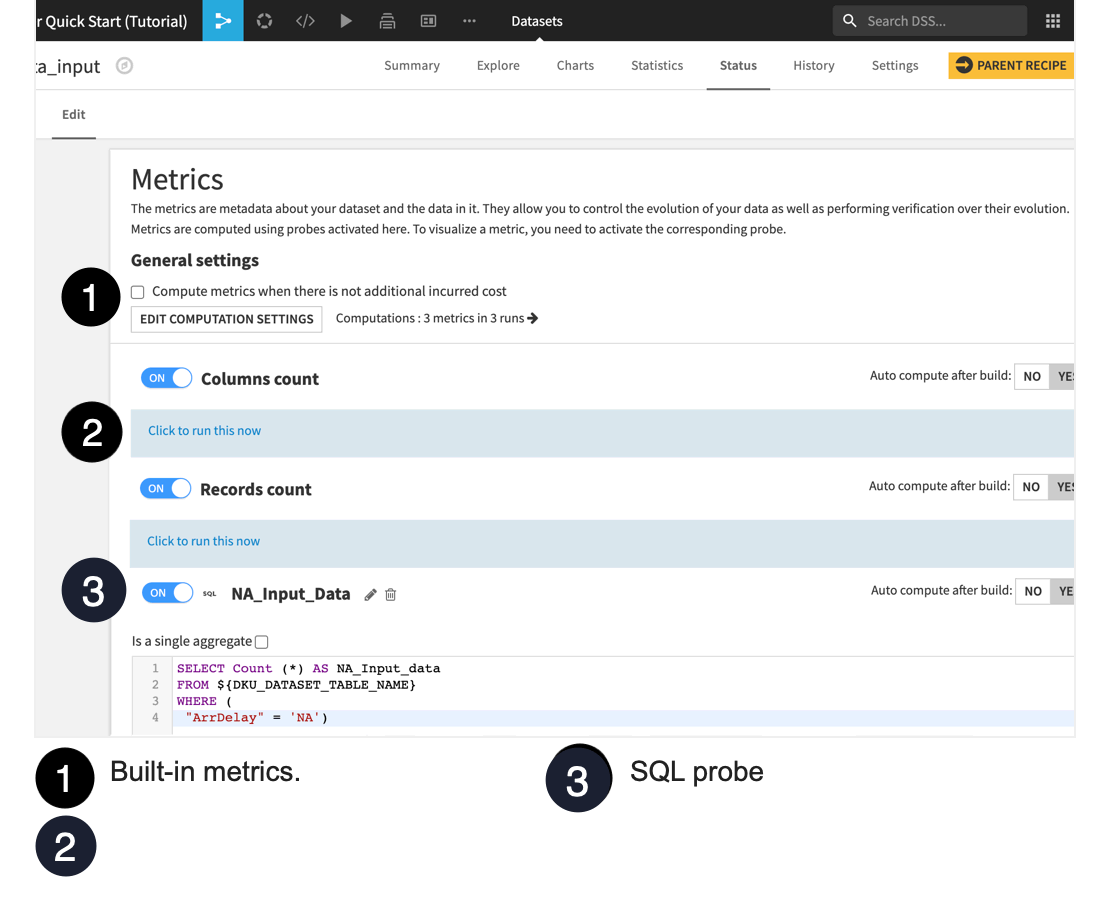
Click the Edit subtab to display the Metrics panel.
Two built-in metrics have been turned on: Columns count and Records count. They are set to auto compute after the dataset is built.
Let’s create a third metric:
Scroll to the bottom of the metrics page and click New SQL Query Probe.
Name it
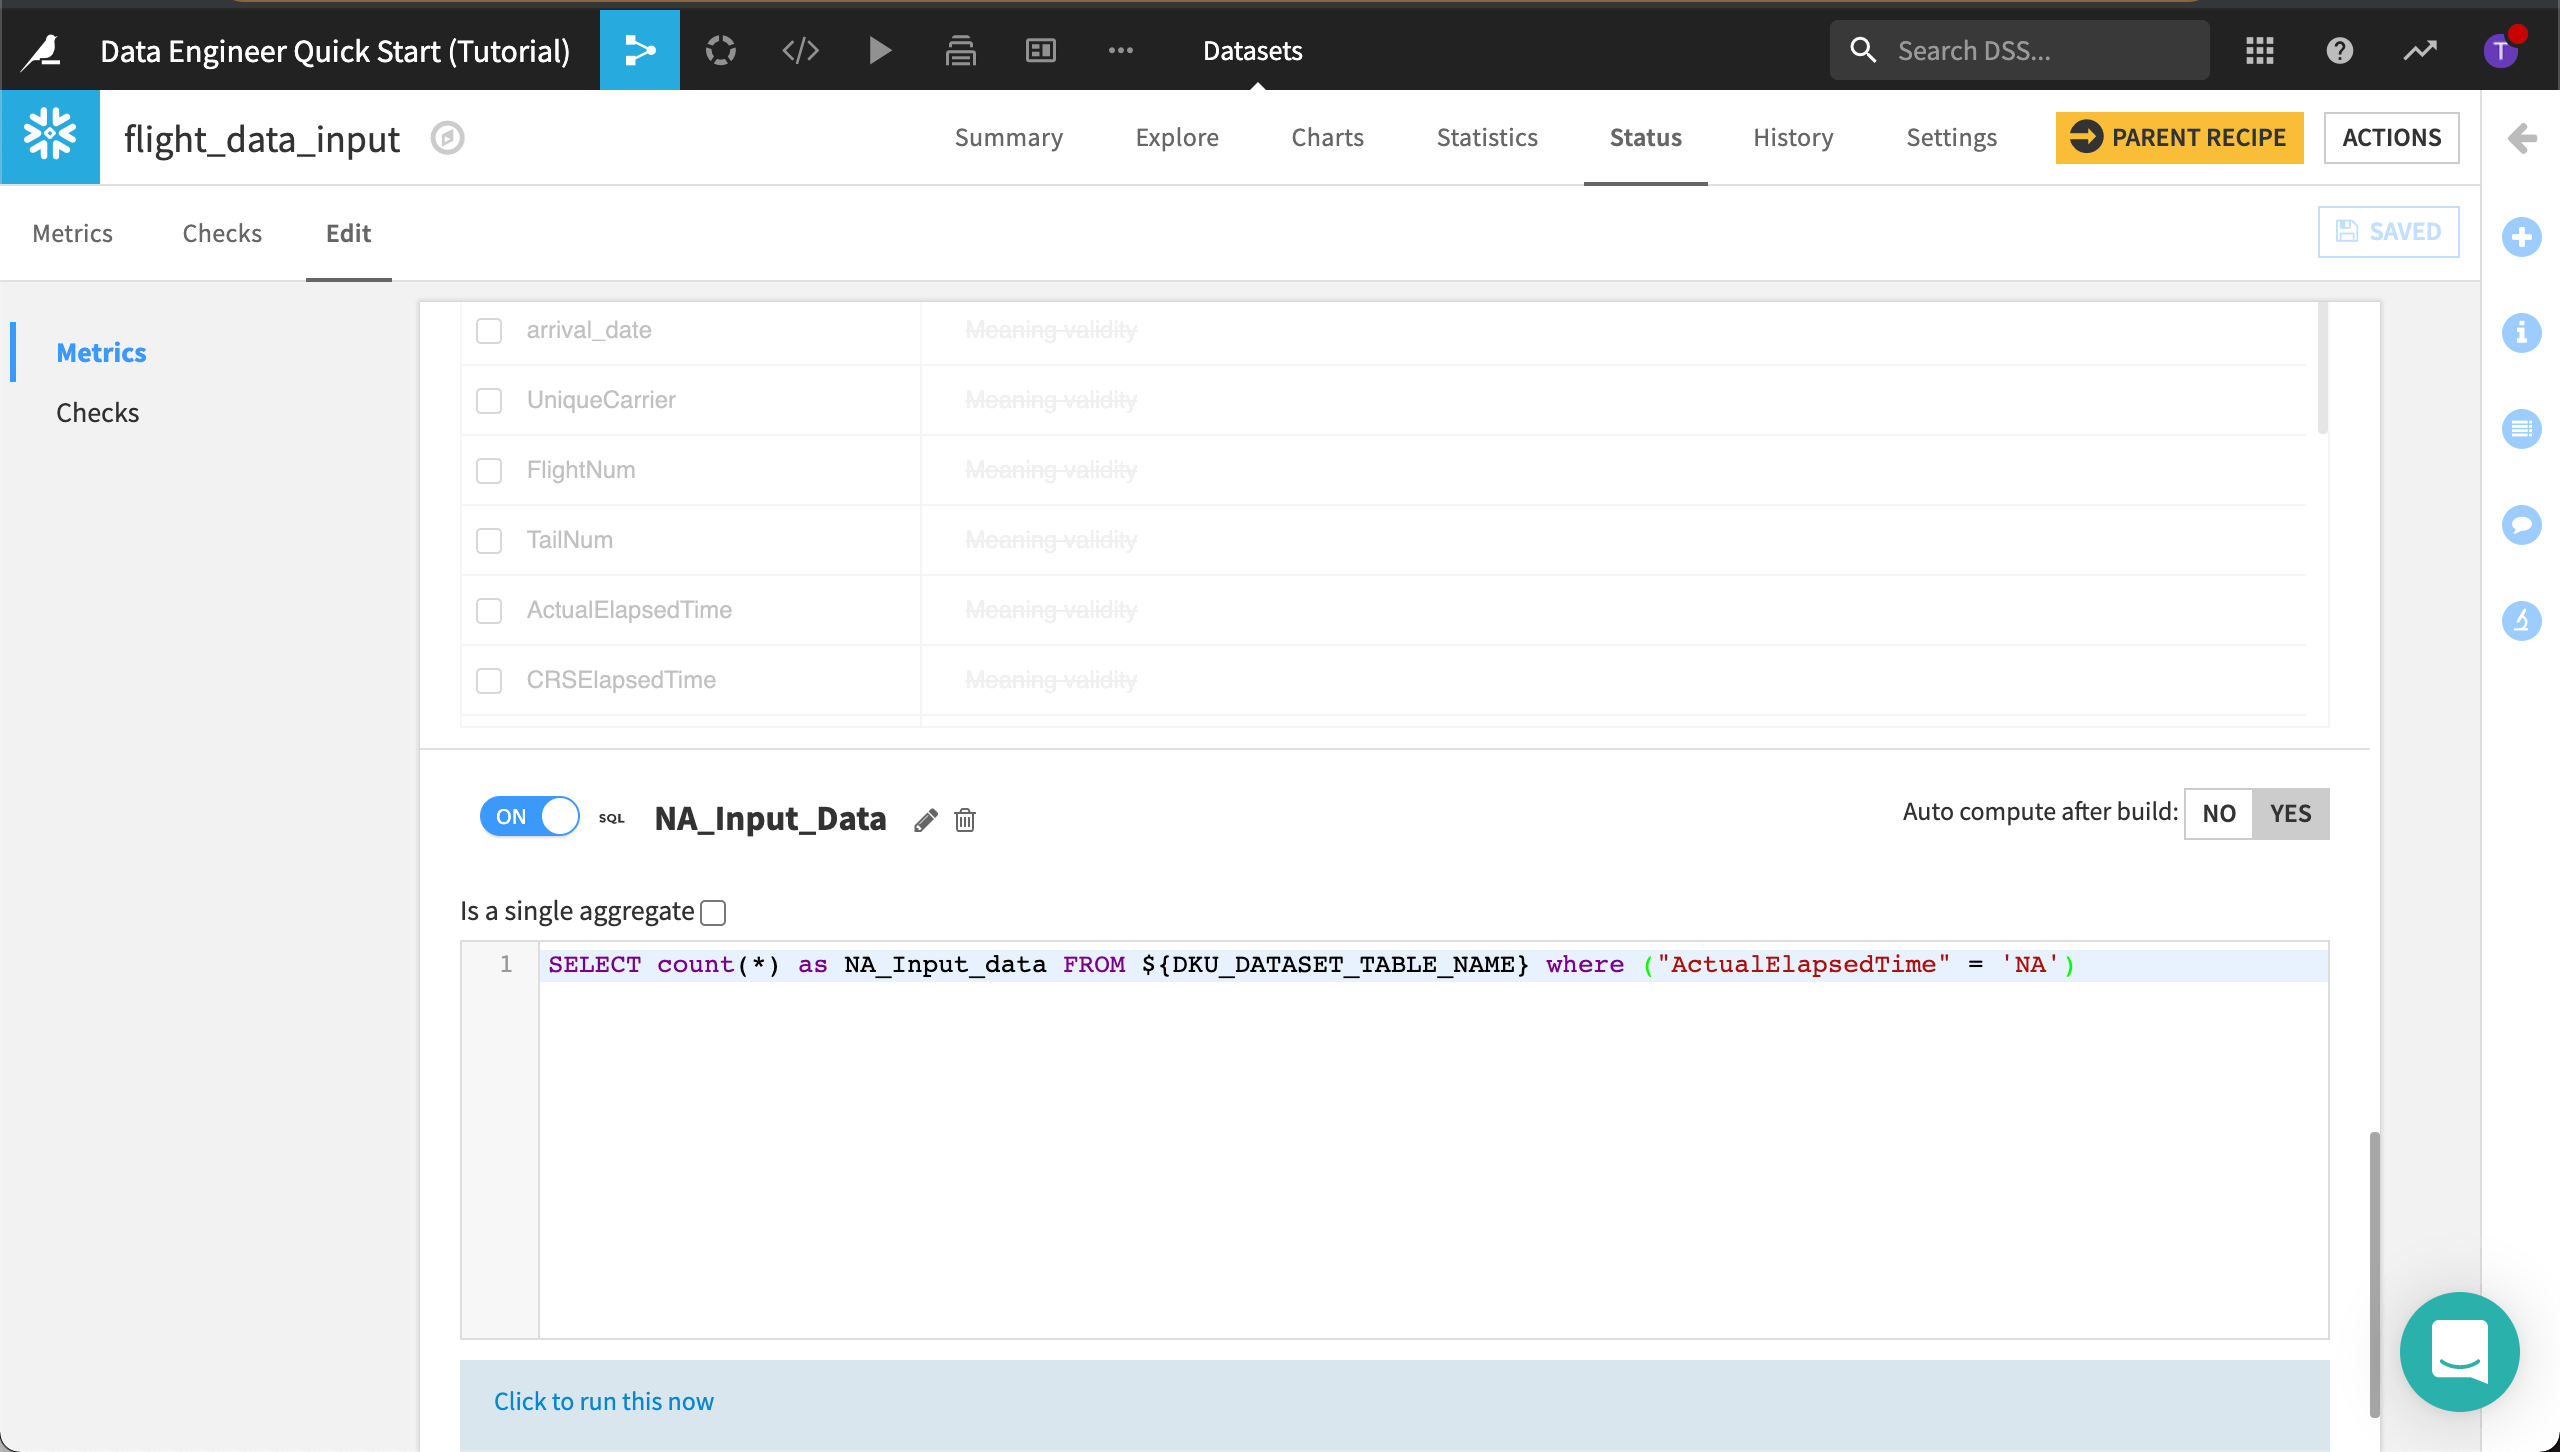
NA_Input_Data.Turn the SQL query probe “on”.
Click Yes to turn on the toggle to auto compute this metric after the dataset is built.
Type the following query to select the count of records where ArrDelay is “NA”.
SELECT         Count (*) AS NA_Input_data
FROM           ${DKU_DATASET_TABLE_NAME}
WHERE  (
                       "ArrDelay" = 'NA');
Click Save.
Run the query by clicking Click to run this now > Run.
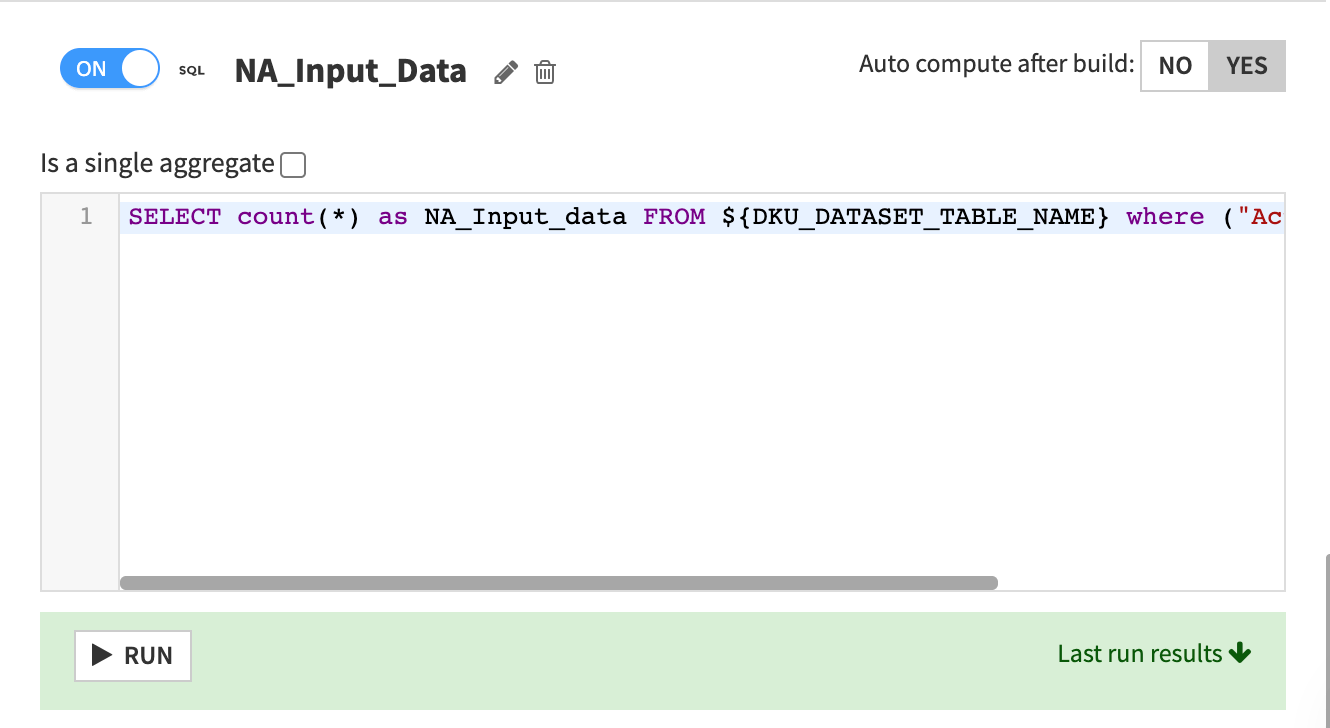
Dataiku DSS displays the Last run results which includes the count of “NA”.
Now we’ll add this new metric to Metrics to display and recompute the metrics.
Navigate to the Metrics subtab again.
Click the Metrics selection to view Metrics display settings.
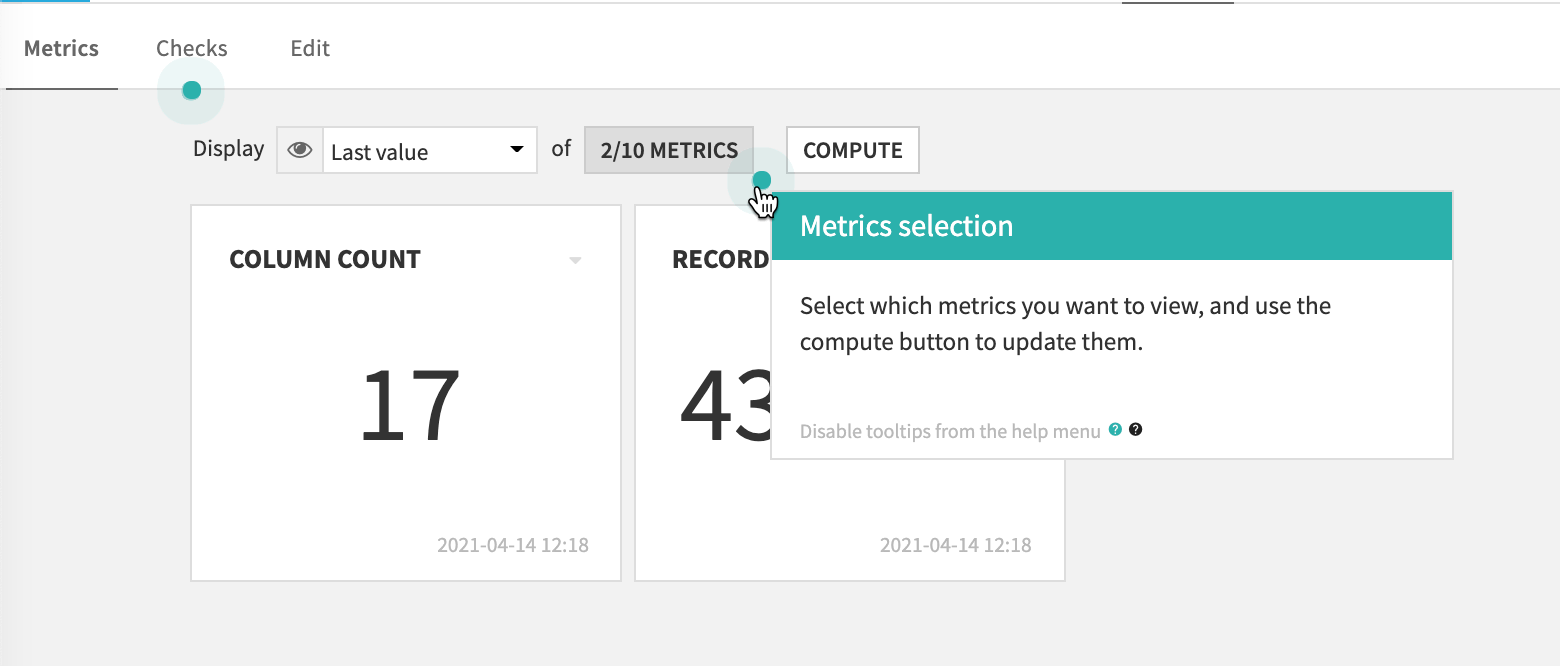
Add NA_INPUT_DATA to Metrics to display.
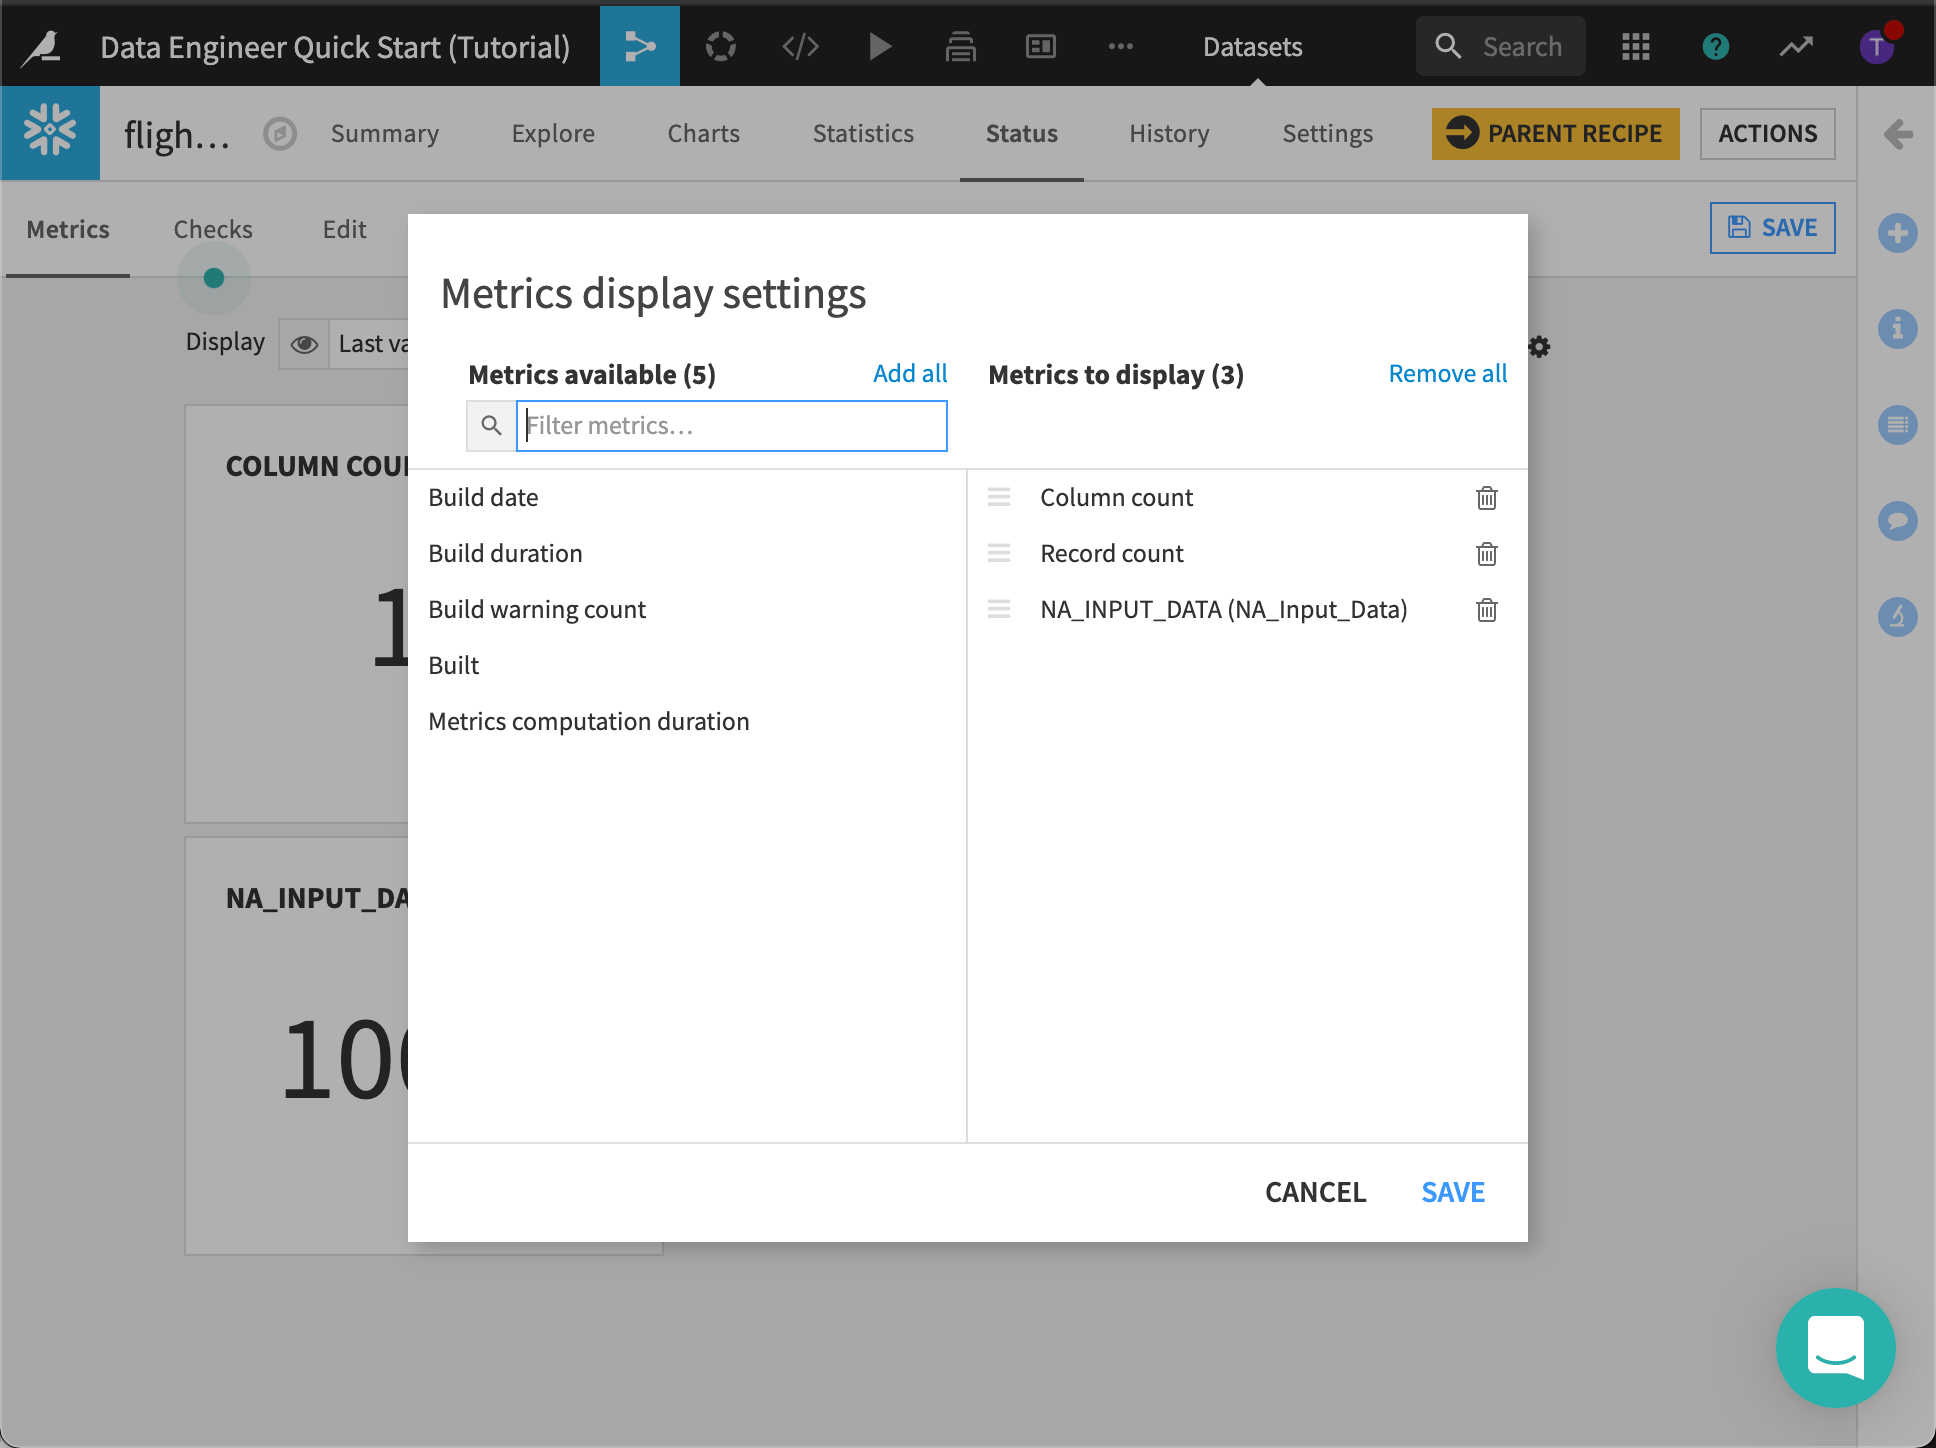
Dataiku DSS displays the three metrics.
Let’s add a check so we know when this metric falls outside an acceptable range. Let’s say anything below 8,000 “NA” records is acceptable, while anything above approximately 15,000 “NA” records indicates a problem with the dataset.
Open the Edit subtab again.
Click to view the Checks panel.
Add a new check to check when a Metric Value is in a Numeric Range.
Name it
Check_NA.The metric to check is NA_INPUT_DATA (NA_Input_Data).
Set the Soft maximum to
8000and the Maximum to14985.
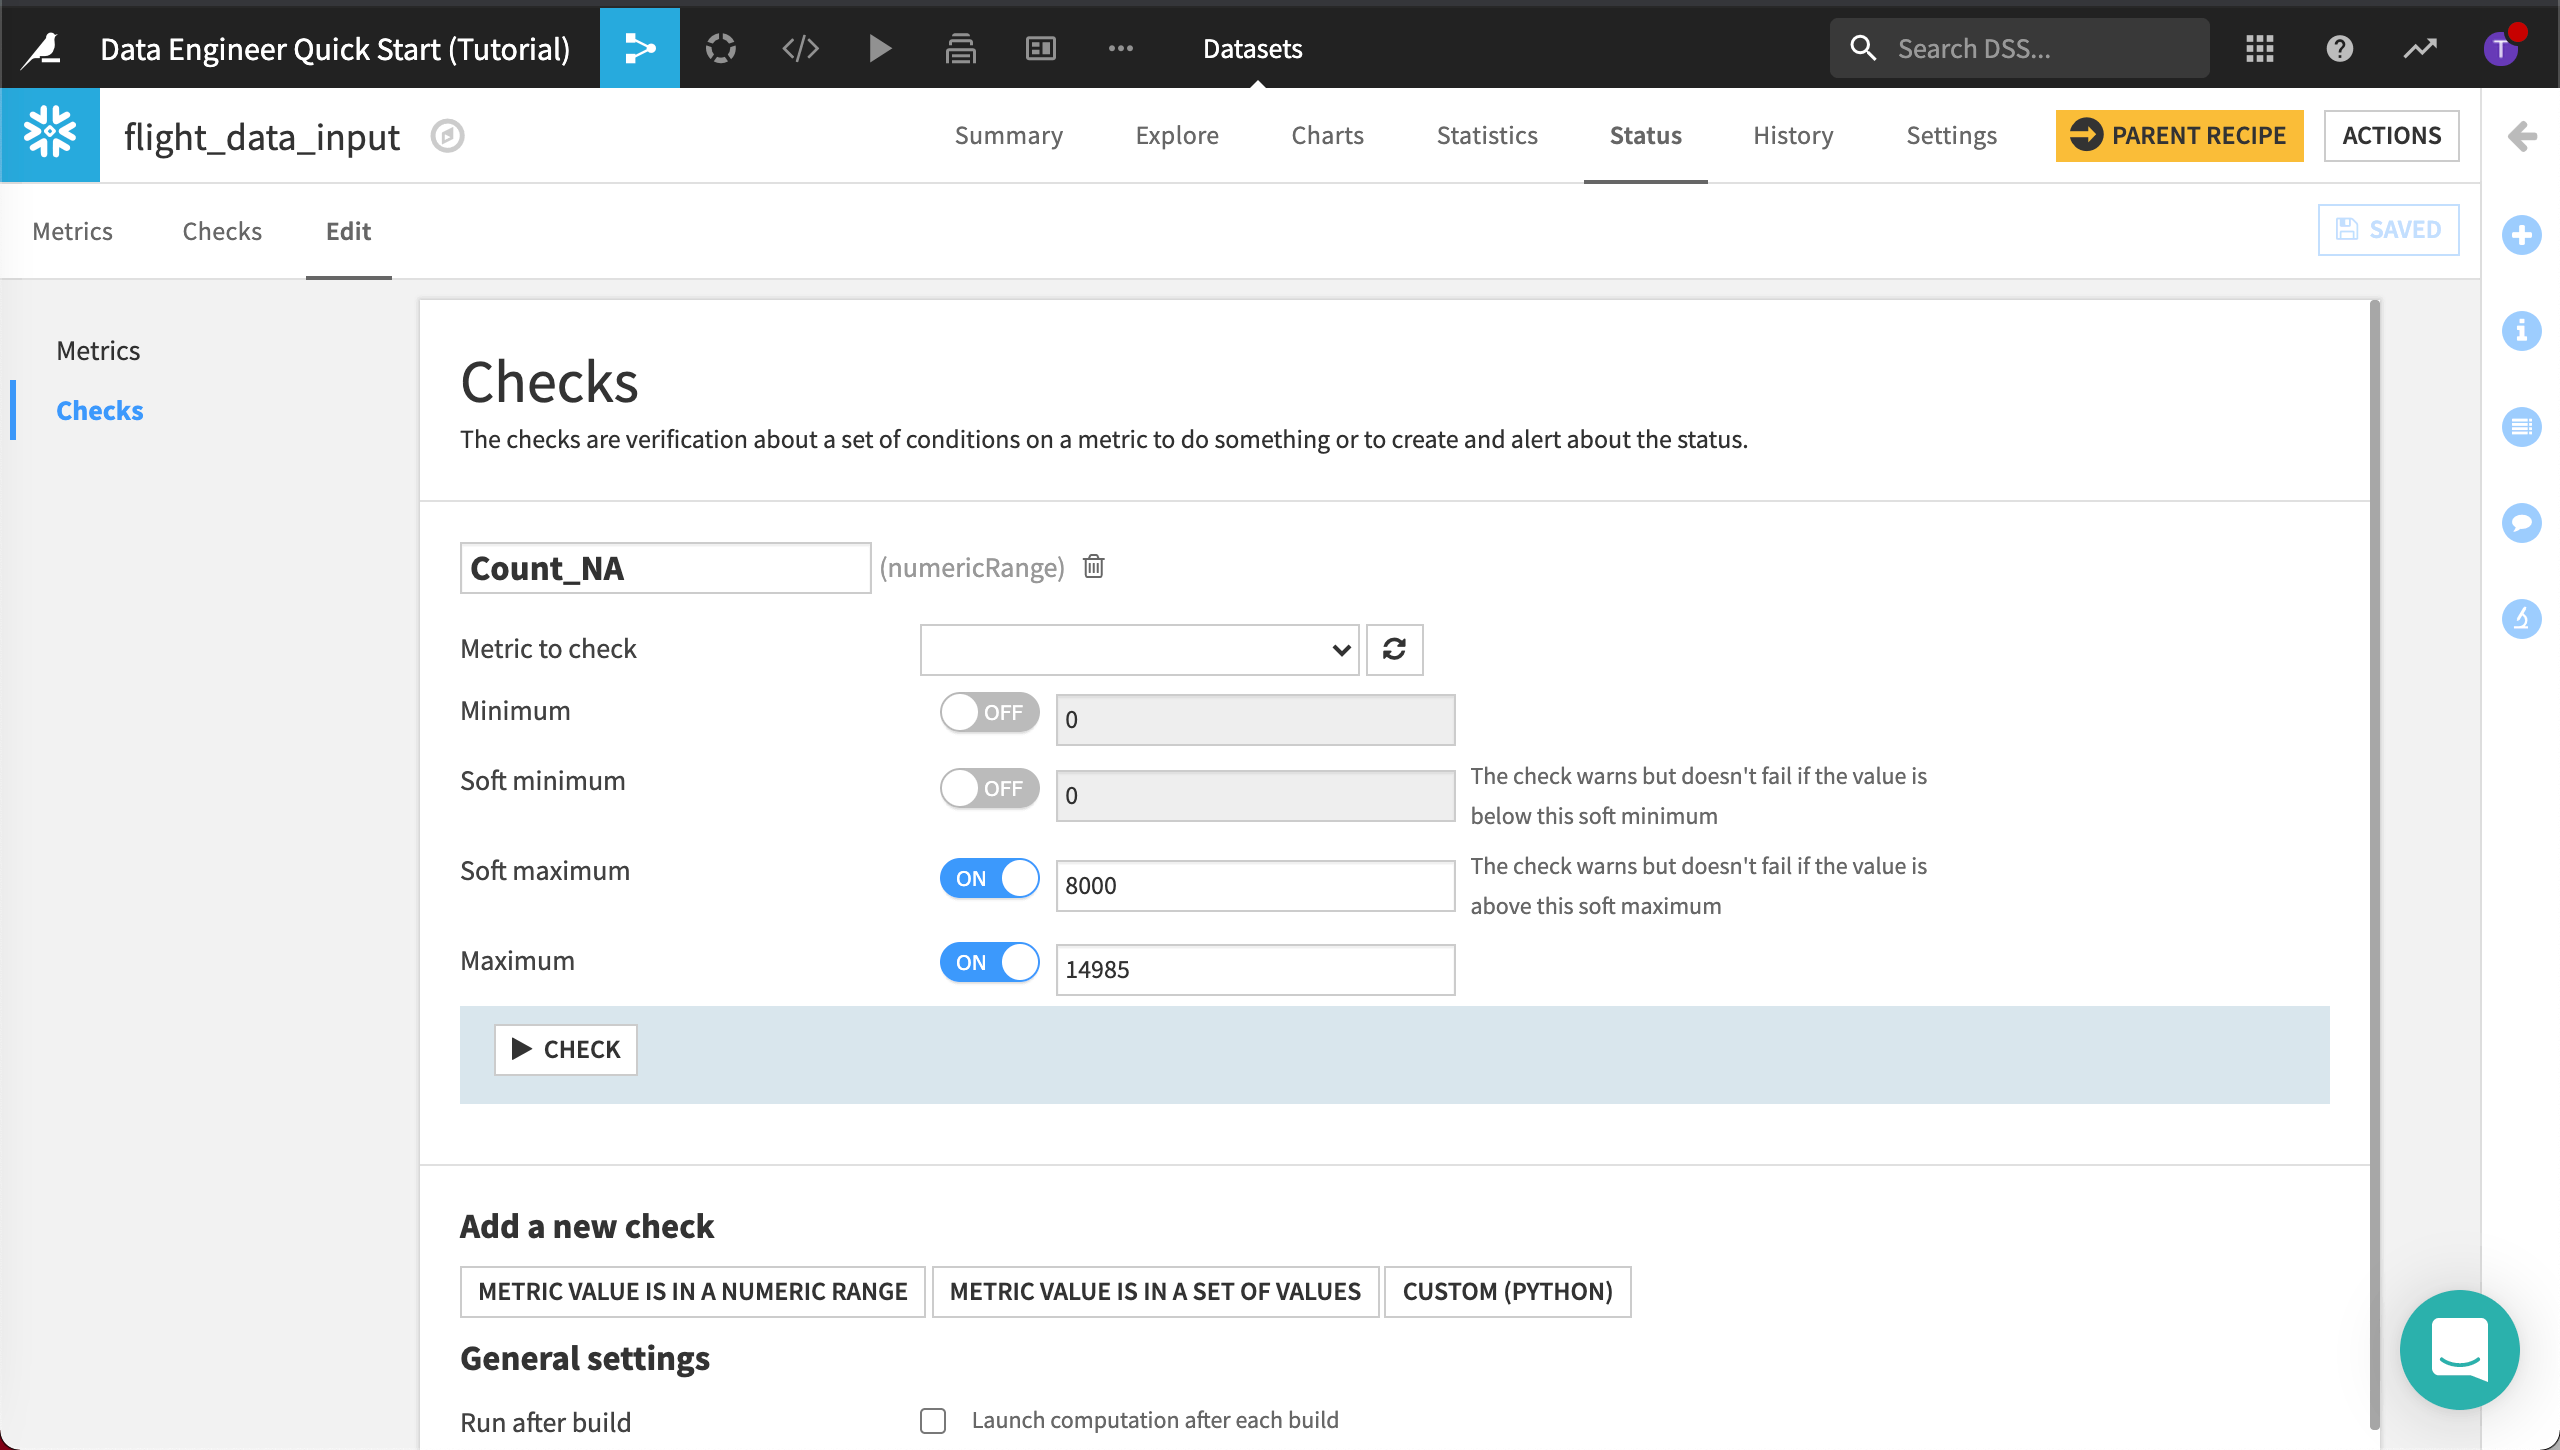
Click Save.
Later, we’ll automate the build of our datasets which will prompt Dataiku DSS to run the metrics and checks. If the number of invalid records is above “14985”, the check will fail.
Before we automate our metrics and checks, let’s discover how to visually build out the data pipeline.
Visually Build Out the Data Pipeline
Organizing data pipelines to transform, prepare, and analyze data is critical for production-ready AI projects. The Dataiku DSS visual flow allows coders and non-coders alike to easily build data pipelines with datasets, recipes to join and transform datasets, and the ability to build predictive models.
In this section, we’ll discover how to build out the data pipeline visually, and using a code recipe, by joining two datasets together. This will allow us to compare using a visual and a code recipe.
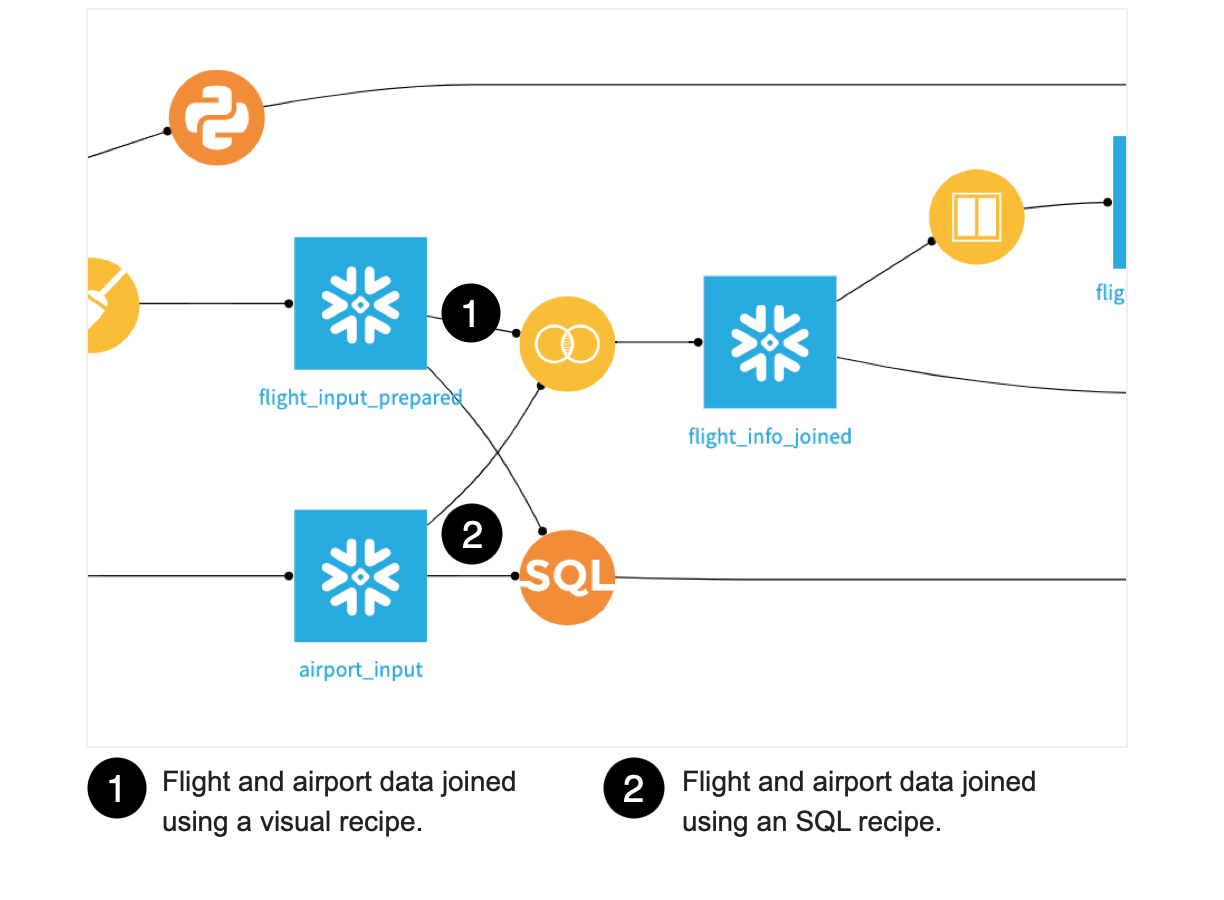
Join Datasets Using a Visual Recipe
Let’s discover how the flight and airport data was joined using a visual recipe.
Go to the Flow.
Double-click the Join recipe that was used to create flight_info_joined to open it.
In the Join step, we can see that a left join was used to join the datasets on the origin and destination values, which matches the IATA_FAA column in the airport dataset.
In the left panel, scroll down and to the Output step.
Dataiku DSS let’s us convert our Join recipe to an SQL recipe and add it to the Flow. That way, we don’t have to write the query from scratch and we can manually edit it later.
Click View Query.
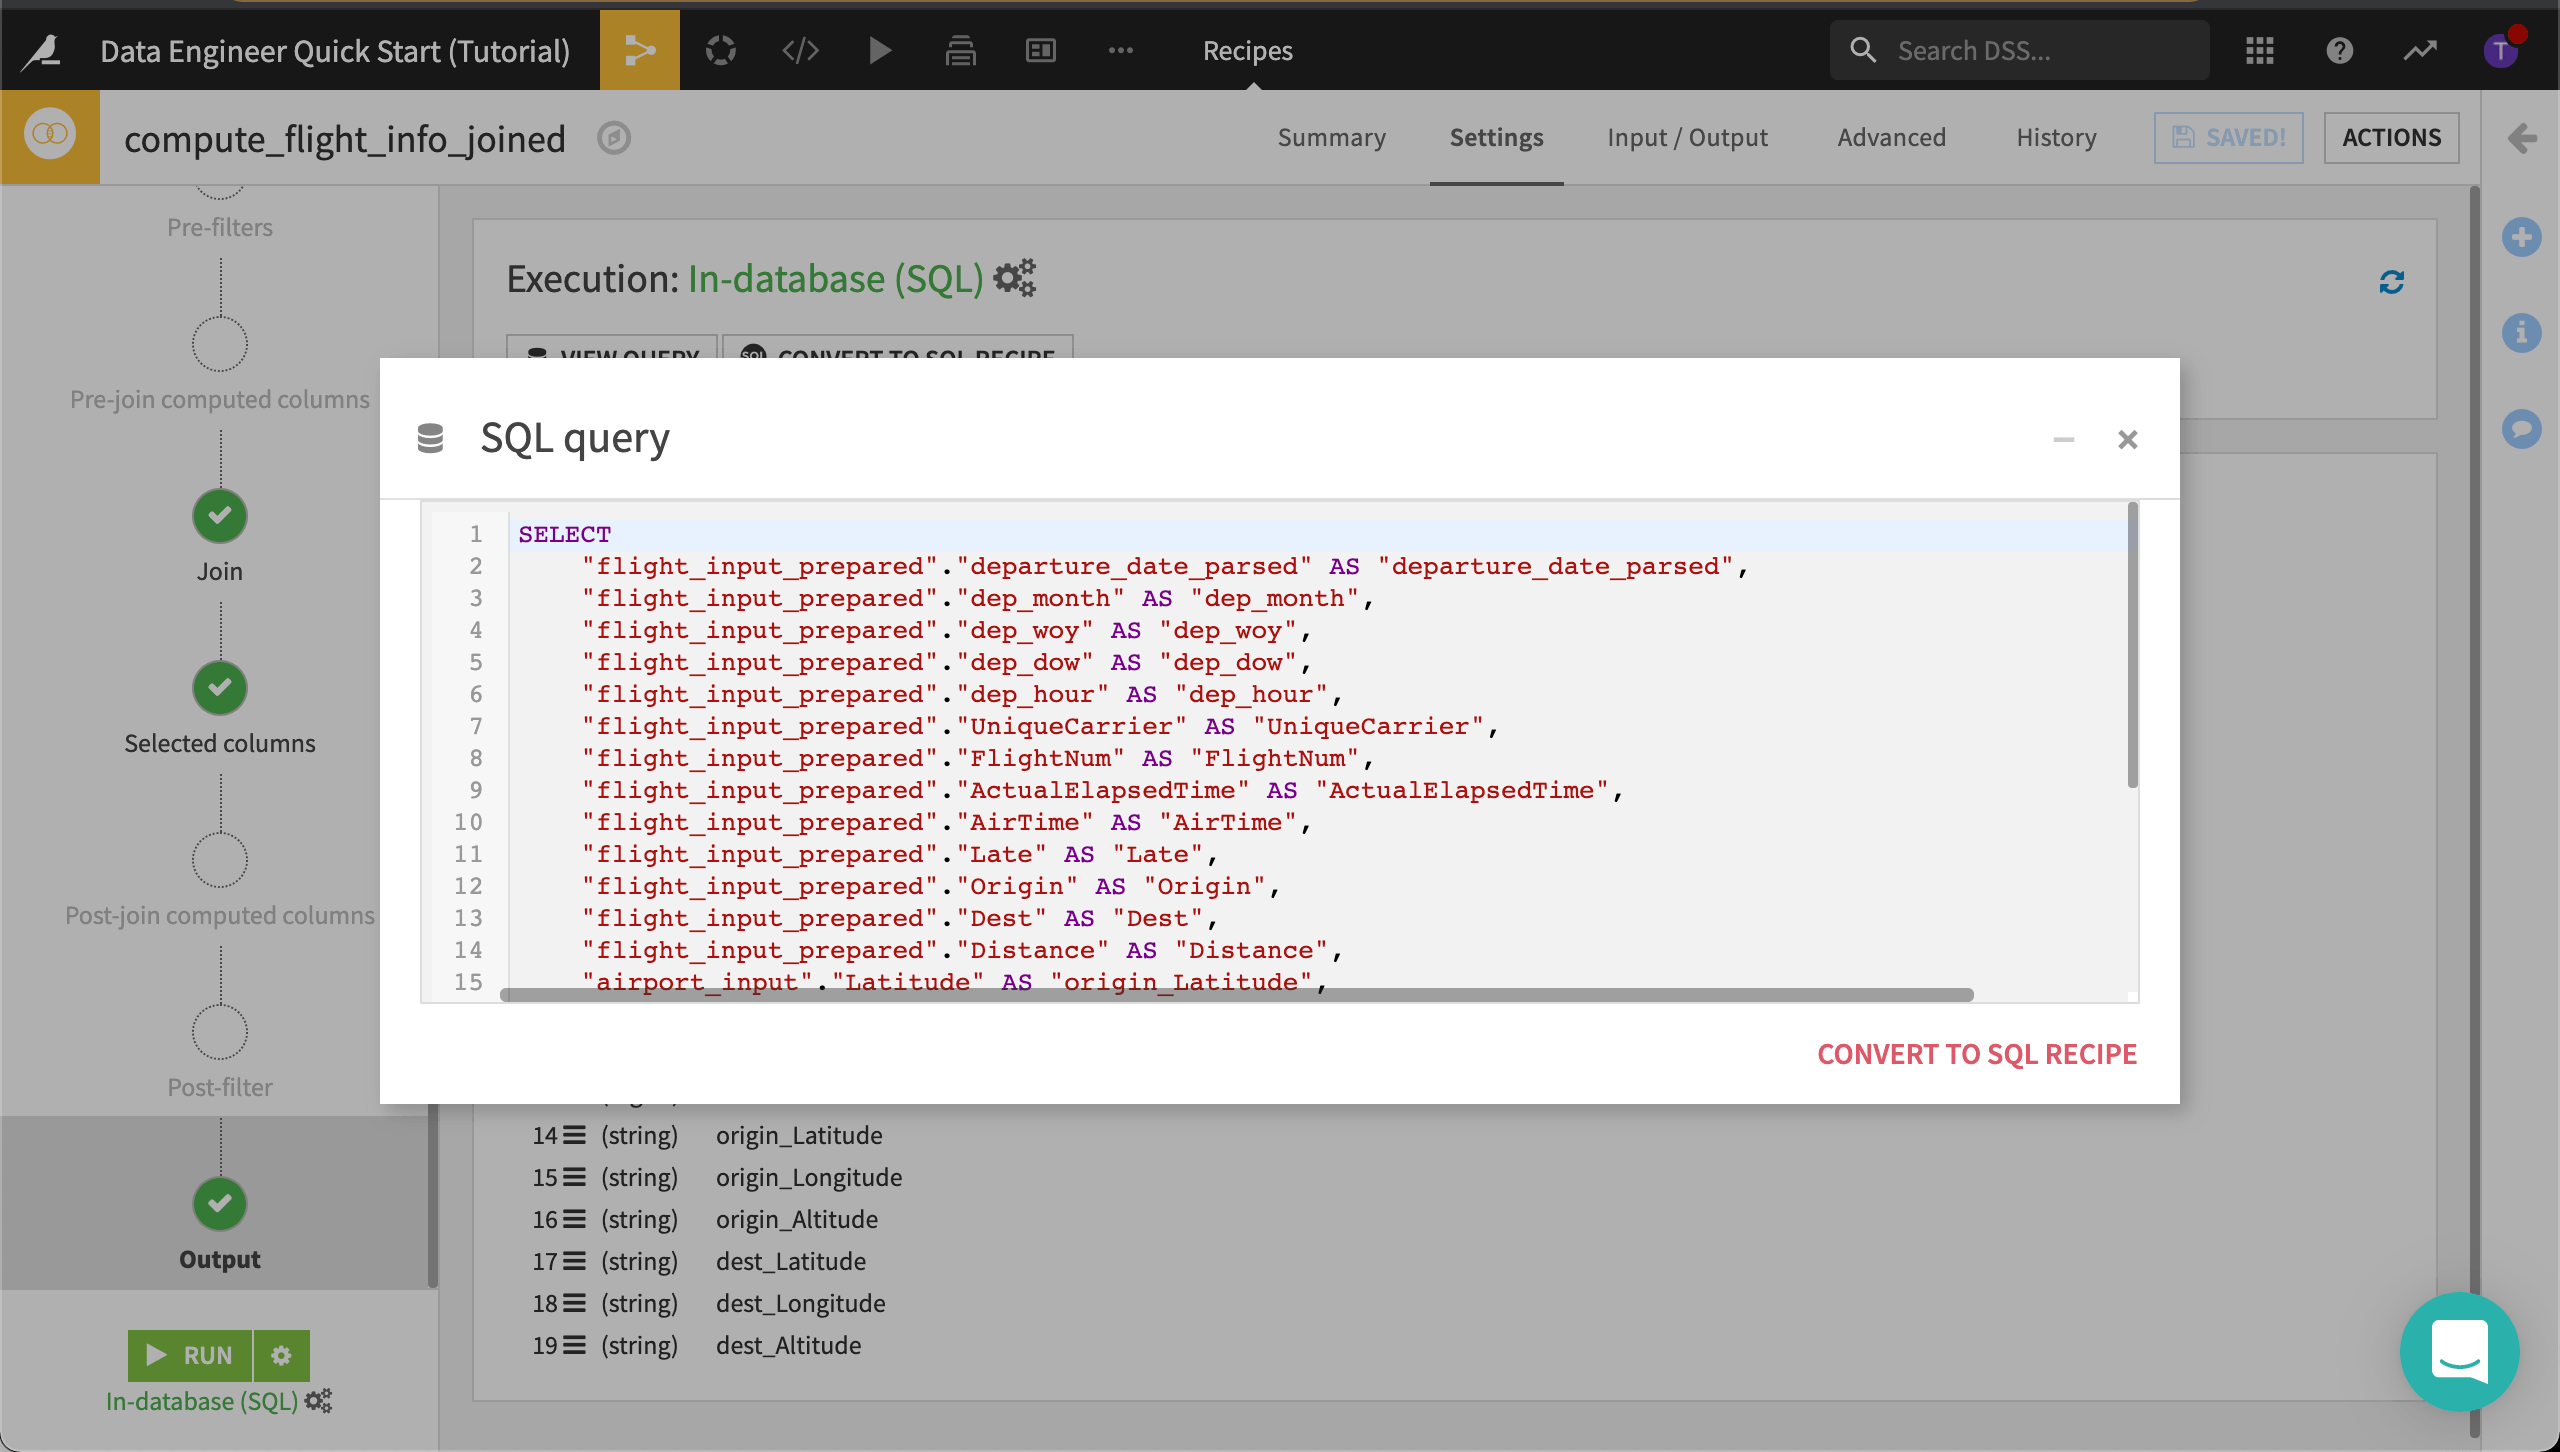
We could simply convert this query to a SQL recipe, but we want to keep both the visual recipe for comparison purposes. For now, we’ll use this query to create a new SQL recipe in the Flow.
Select the entire query and copy it to the clipboard.
Close the query and return to the Flow.
Join Datasets Using a Code Recipe
Let’s create a new SQL recipe using the query we just copied.
Click the dataset, flight_input_prepared, to select it.
Open the side panel by clicking the arrow at the top right corner of the page to view Actions.
In Code recipes, select SQL.
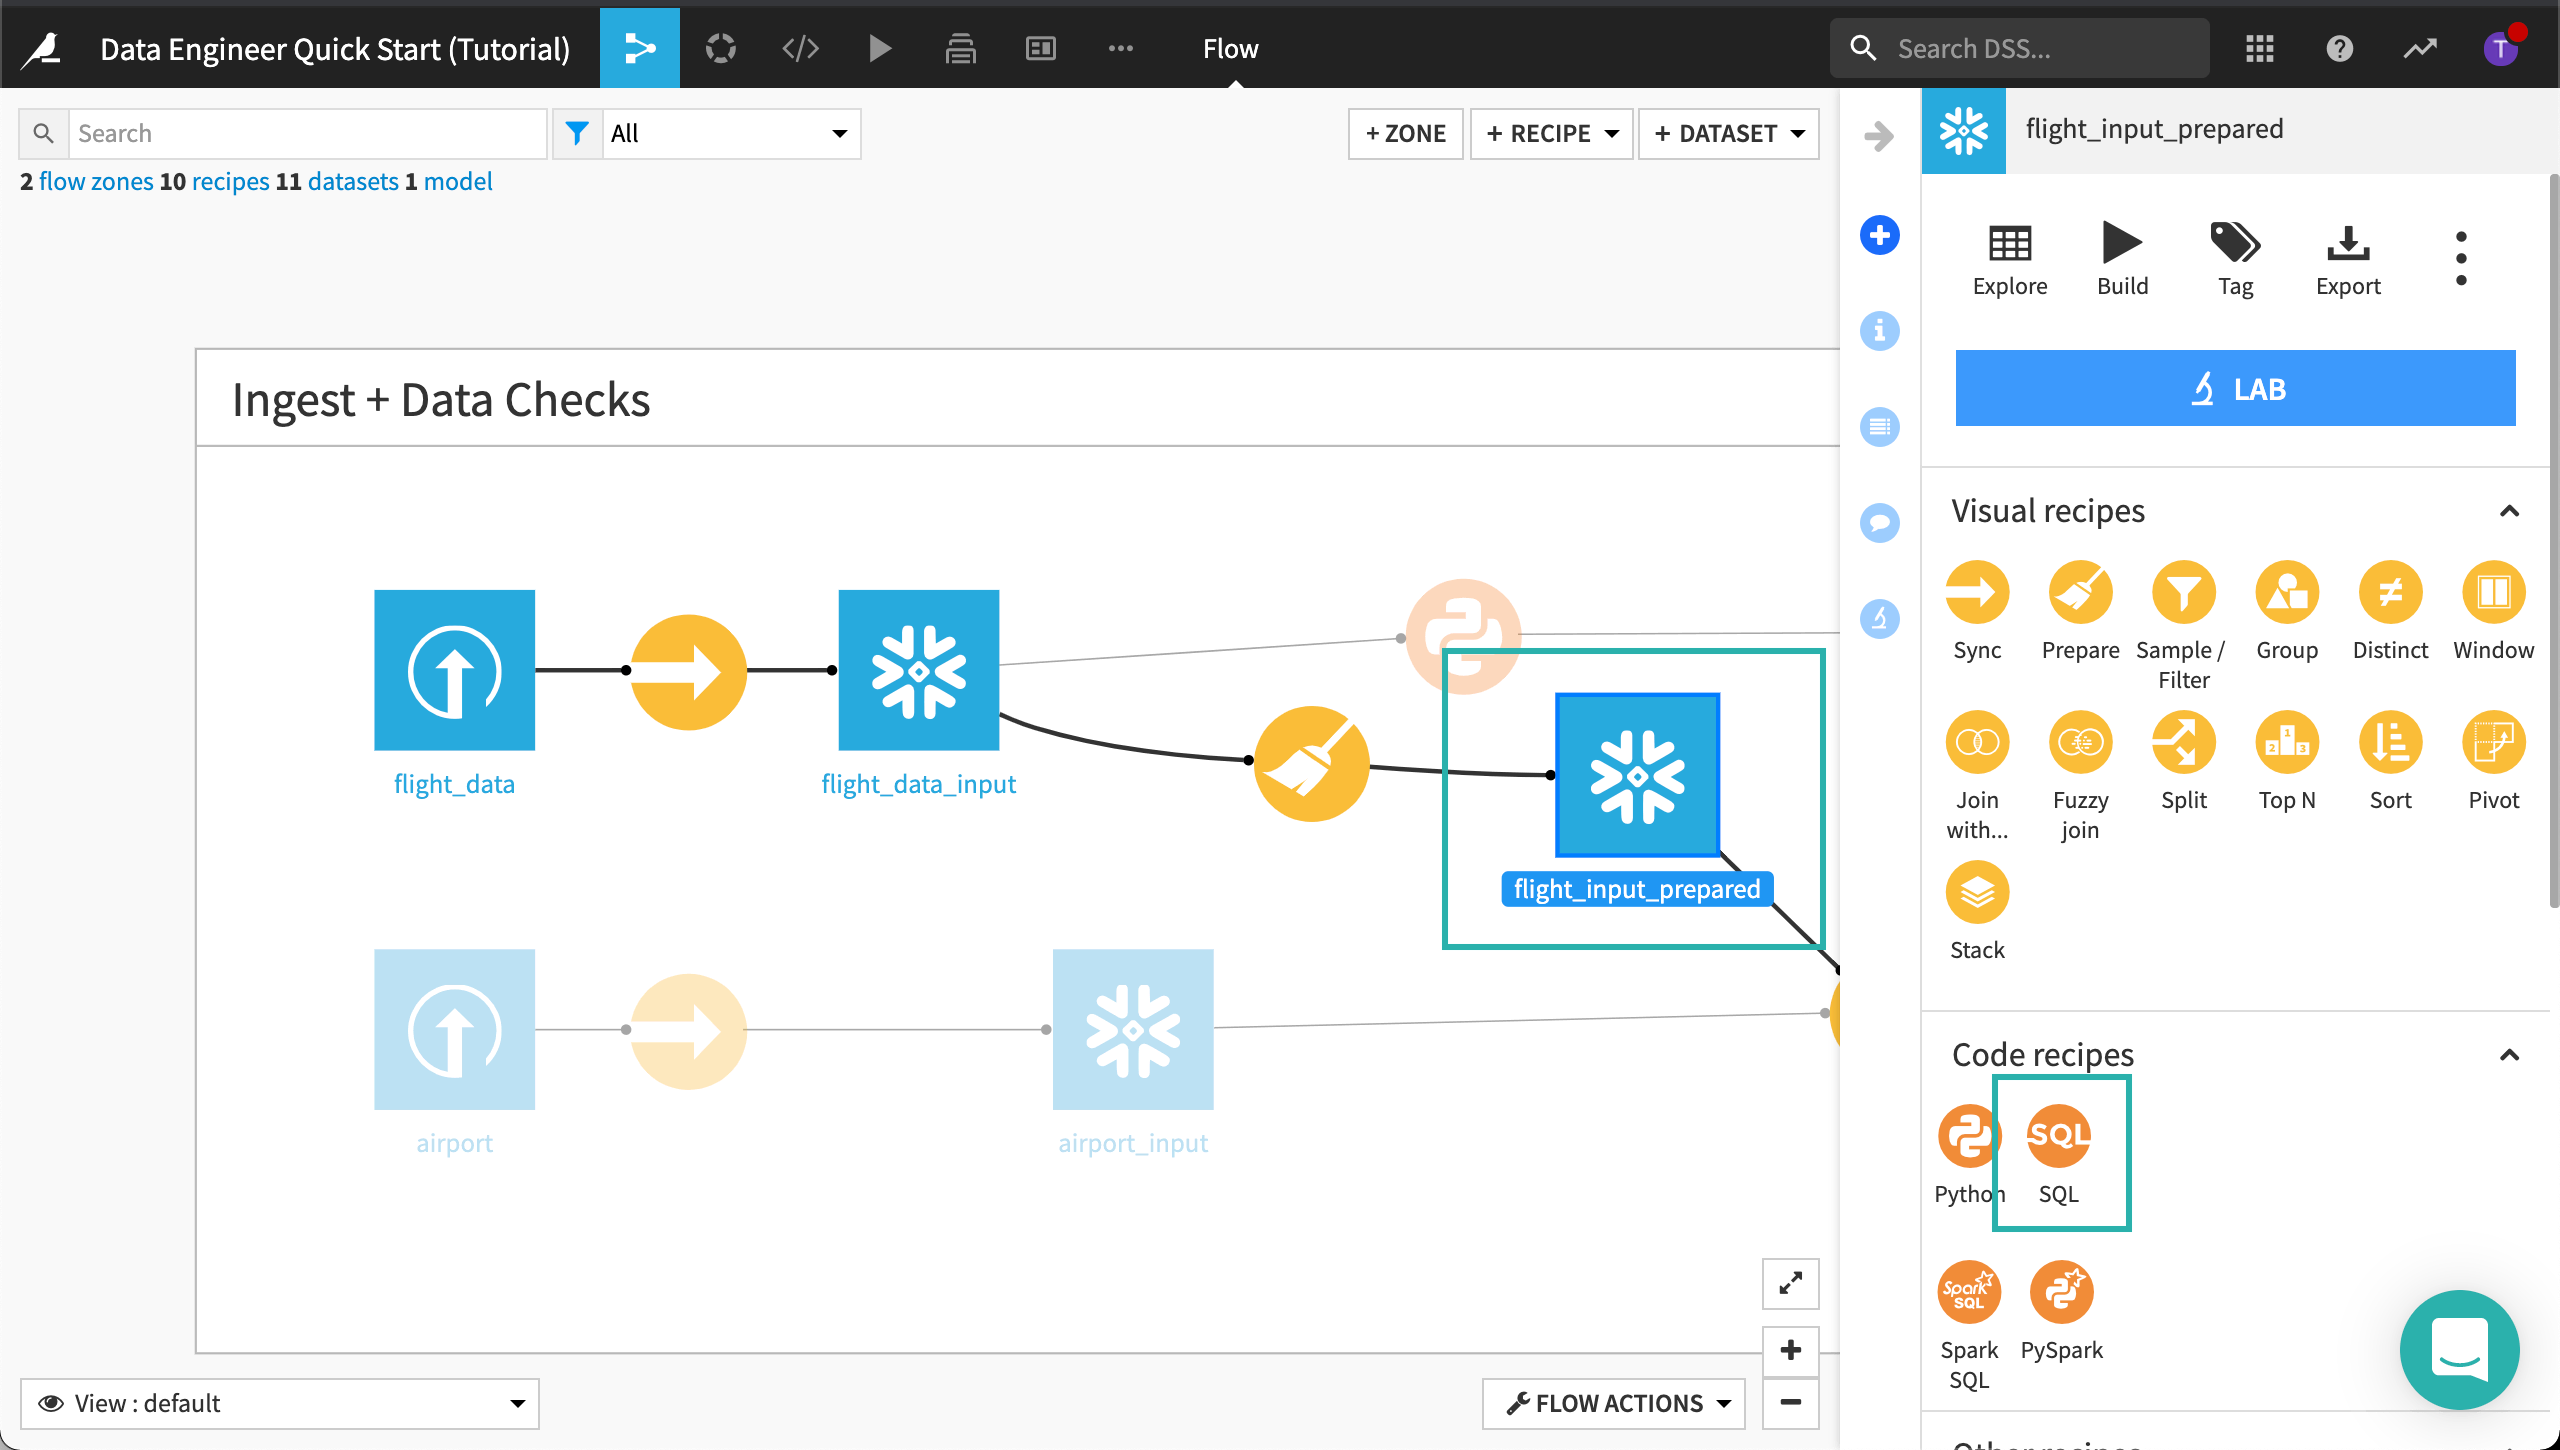
Click Create to create an SQL query.
Name the output dataset
flight_joined_sql.Store it into the same SQL connection as the input dataset, then click Create Dataset.
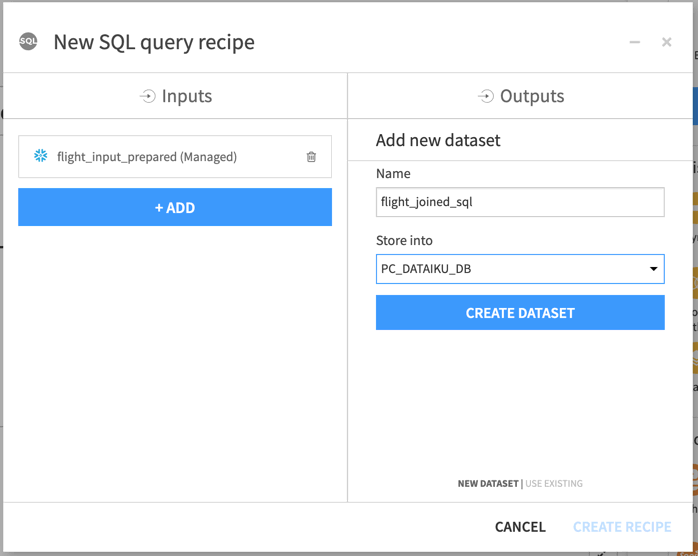
Click Create Recipe.
Replace the code with the query you copied in the previous section.
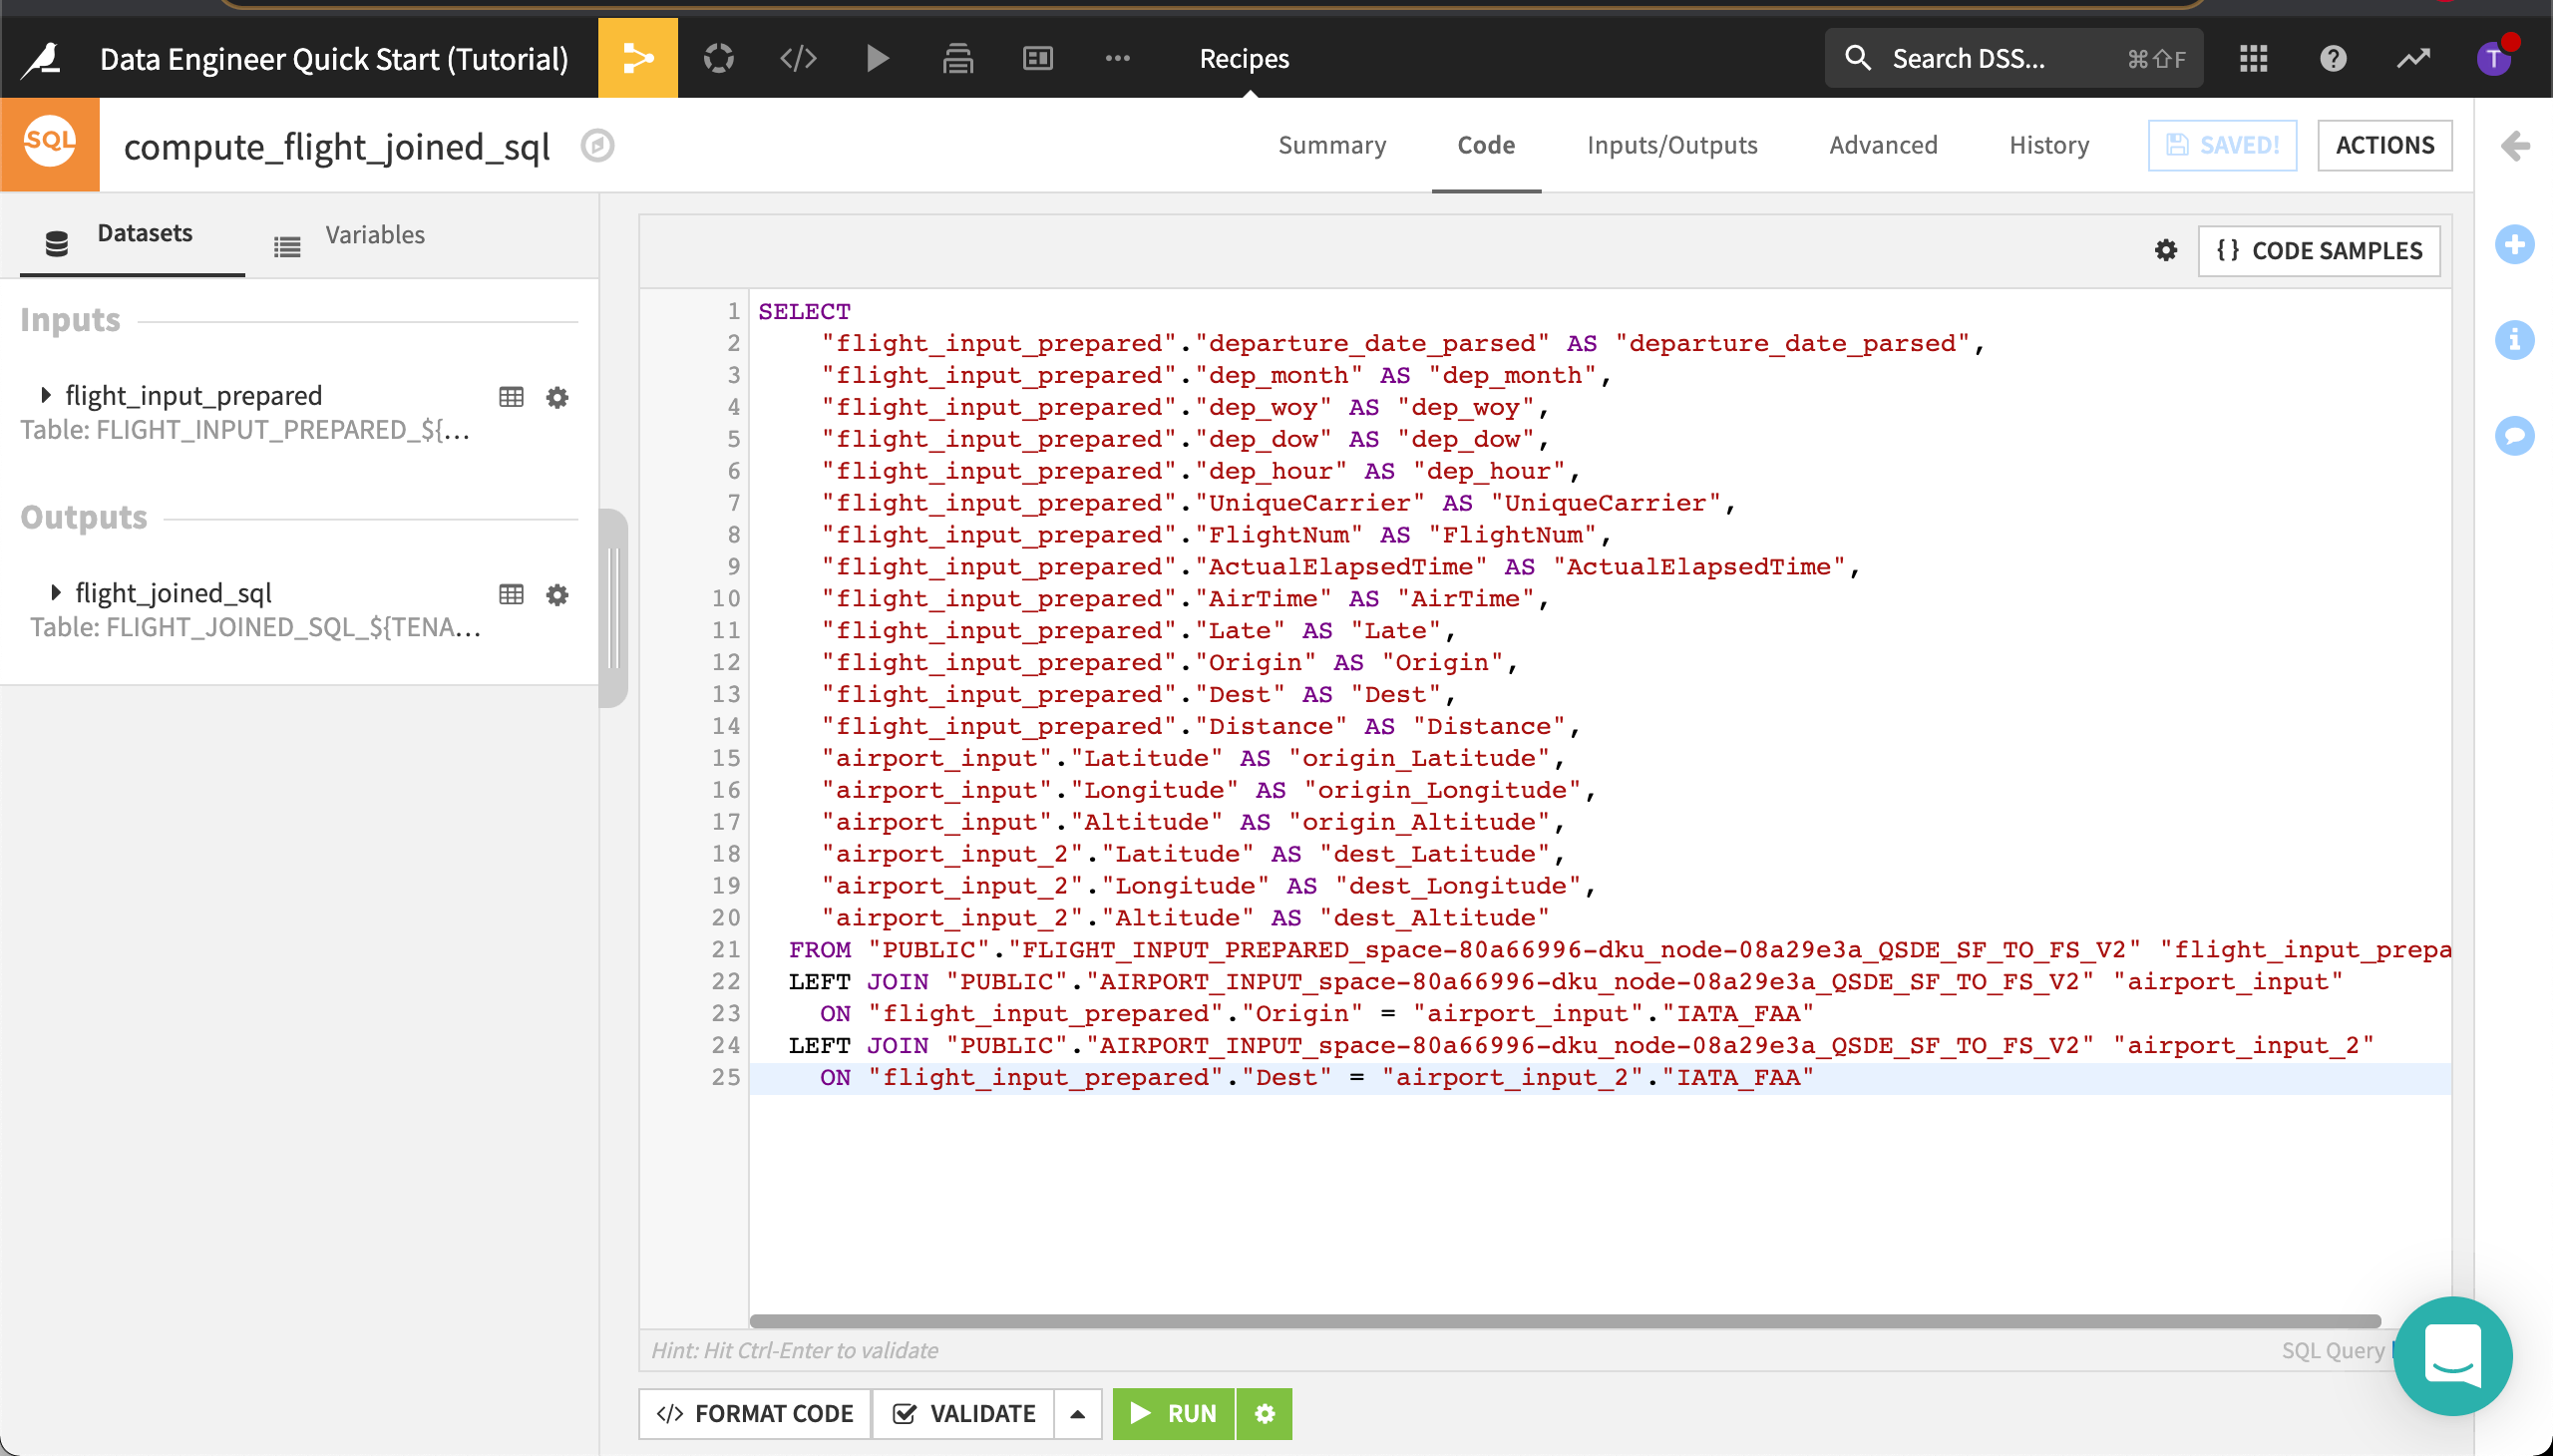
Save and Run the recipe, accepting the schema update if prompted.
Dataiku DSS creates the recipe.
Return to the Flow.
Automate the Heavy Lifting
In this section, we’ll automate the metrics and checks we created earlier.
The manual tasks involved in data pipeline rebuilding can become monotonous when its datasets are continuously refreshed. Dataiku’s automation features allow you to automate manual tasks, including intelligent data pipeline rebuilding, model retraining, reporting, and deployment.
Let’s look at ways we can use scenarios to automate the project so the workflow is built and the checks are performed automatically. In Dataiku DSS, we can use both step-based (point-and-click), and code-based scenarios. We’ll use both types of scenarios for comparison.
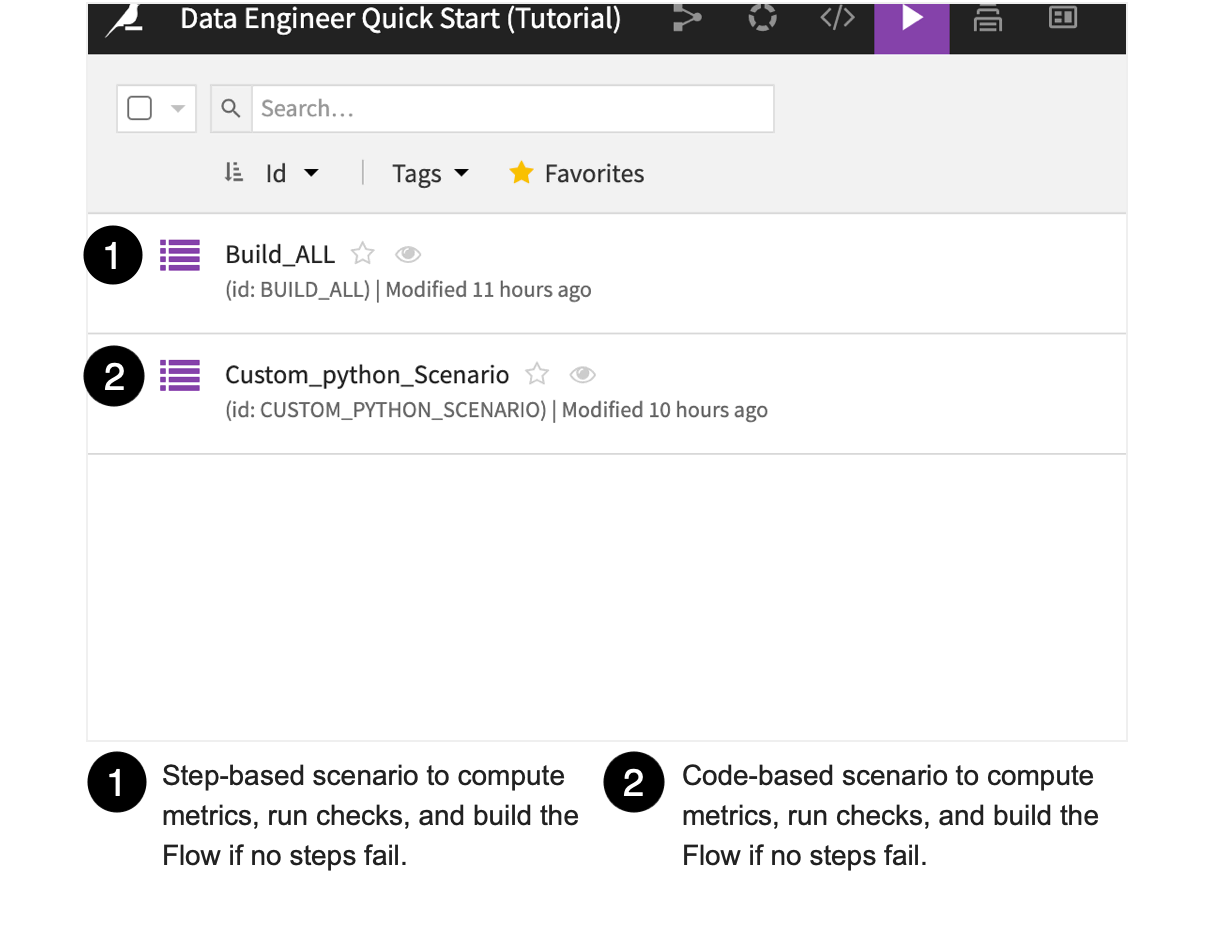
Since our upstream datasets, flight_data_input and flight_input_prepared, will change whenever we have fresh data, we want to be able to automatically monitor their data quality and only build the model evaluation dataset, flight_data_evaluated, if all dataset metrics meet the specific conditions we created.
To do this, we’ll set up an automation scenario to monitor checks of the metrics that have already been created for these datasets.
Automate Metrics and Checks Using a Step-Based Scenario
Let’s look at automating metrics and checks using a step-based scenario. We’ll also learn about scenario triggers and reporters.
Go to the Flow.
From the Jobs dropdown in the top navigation bar, select Scenarios.
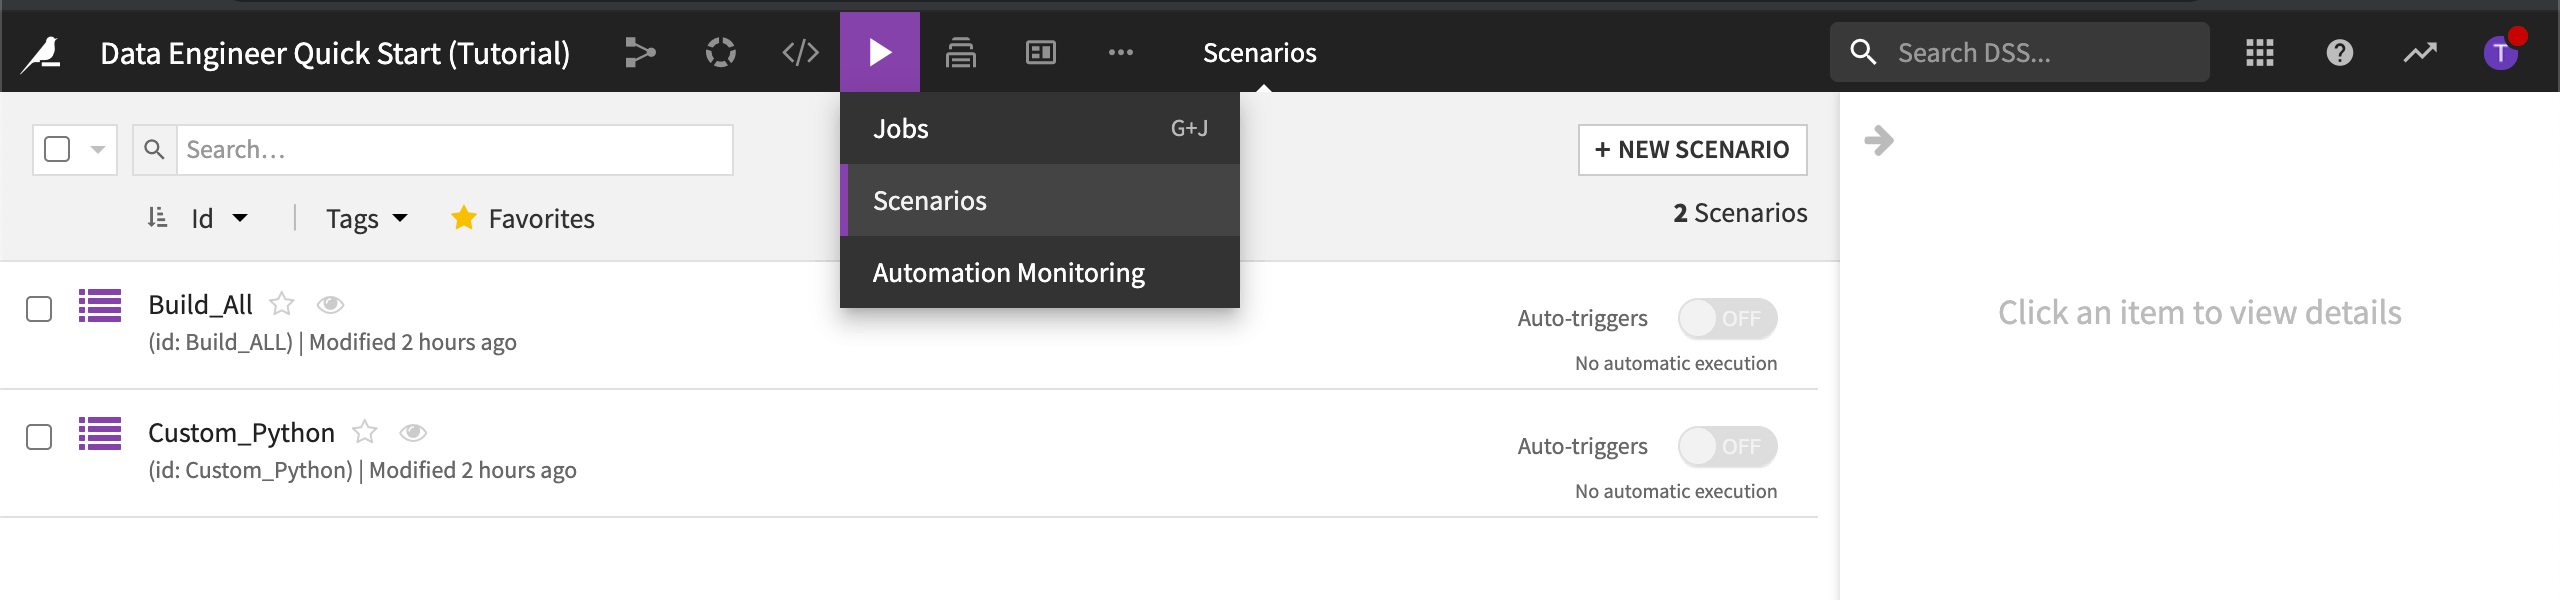
Select the Build_All scenario to open it.
Go to the Steps tab.
Creating the Steps of the Scenario
The Build_ALL scenario contains steps needed to build the flight input datasets, compute the metrics and run the checks, then build and compute metrics for the final dataset in the Flow.
Open the step used to build flight_data_evaluated.
The final step builds flight_data_evaluated only if no prior step failed. Its Build mode is set to Build required datasets (also known as smart reconstruction). It checks each dataset and recipe upstream of the selected dataset to see if it has been modified more recently than the selected dataset. Dataiku DSS then rebuilds all impacted datasets down to the selected dataset.
For more information, visit, Can I control which datasets in my Flow get rebuilt during a scenario?.
Note
Depending on your project and the desired outcome, the build strategy you follow may be different than the strategy used in this tutorial. For example, if there is a build step that builds the final dataset in the Flow, and the Build mode is set to Force-rebuild dataset and dependencies, Dataiku DSS would rebuild the dataset and all of its dependencies, including any upstream datasets. This build mode is more computationally intensive.
Triggering the Scenario to Run
Triggers are used to automatically start a scenario, based on one or more conditions. Each trigger can be enabled or disabled. In addition, the scenario must be marked as “active” for triggers to be evaluated.
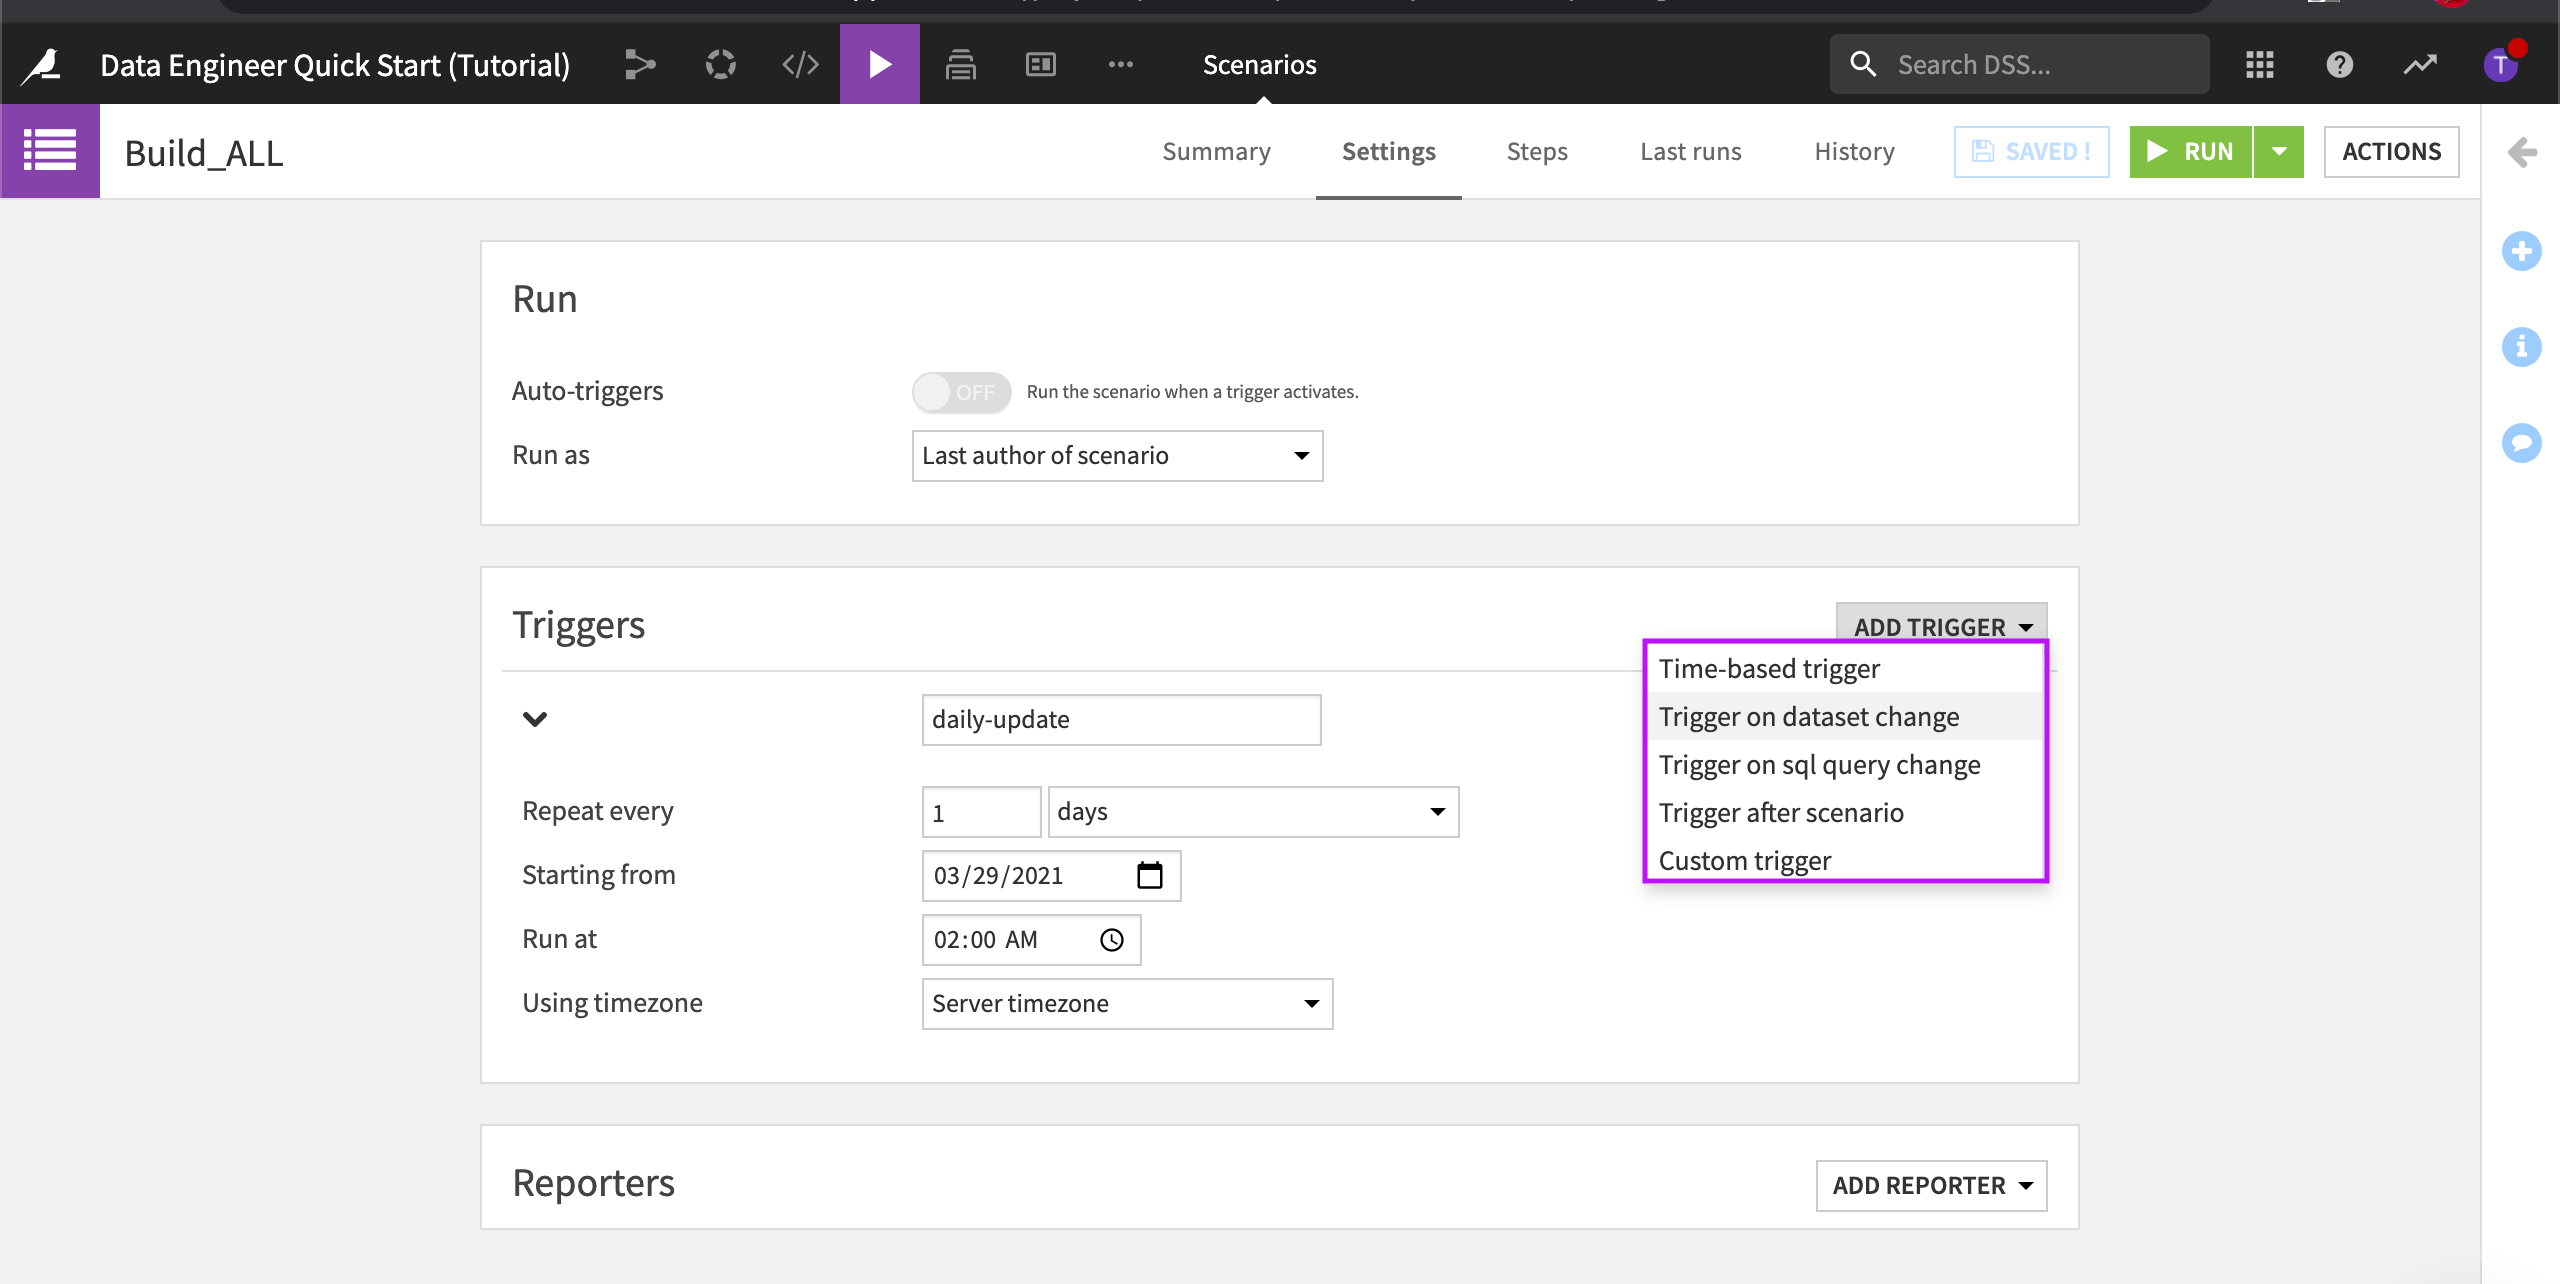
Go to the Settings tab.
In Triggers, expand the daily-update trigger to learn more about it.
This particular trigger is set to repeat daily. Dataiku DSS lets you add several types of triggers including time-based triggers and dataset modification triggers. You can even code your own triggers using Python.
Reporting on Scenario Runs
In Reporters, click Add Reporter to see the available options.
We can use reporters to inform our team members about scenario activities. For example, scenario reporters can send updates about the training of models or changes in data quality. Reporters can also create actionable messages that users can receive within their email or through other messaging channels.
Automate Metrics and Checks Using a Code-Based Scenario
Let’s discover how we can automate metrics and checks using a code-based scenario.
From the list of scenarios, select the Custom_Python scenario to open it.
Go to the Script tab.
Run the script.
This script performs the same steps as in the step-based scenario.
Share Metrics Using a Dashboard
Business stakeholders rely on data to make decisions. In Dataiku DSS, these stakeholders can view the project and associated assets (like dashboards), check the project’s overall status, and view recent activity. Let’s simplify this task for them by publishing relevant insights to the project’s dashboard.
Publish Metrics to the Dashboard
Let’s say that team members will want to know how many invalid records (where the actual flight duration is “NA”) were found in the input dataset and the length of time it takes to build the final dataset in the Flow, flight_data_evaluated.
To provide this information, we’ll need to publish the metrics that were computed for flight_data_input and flight_data_evaluated.
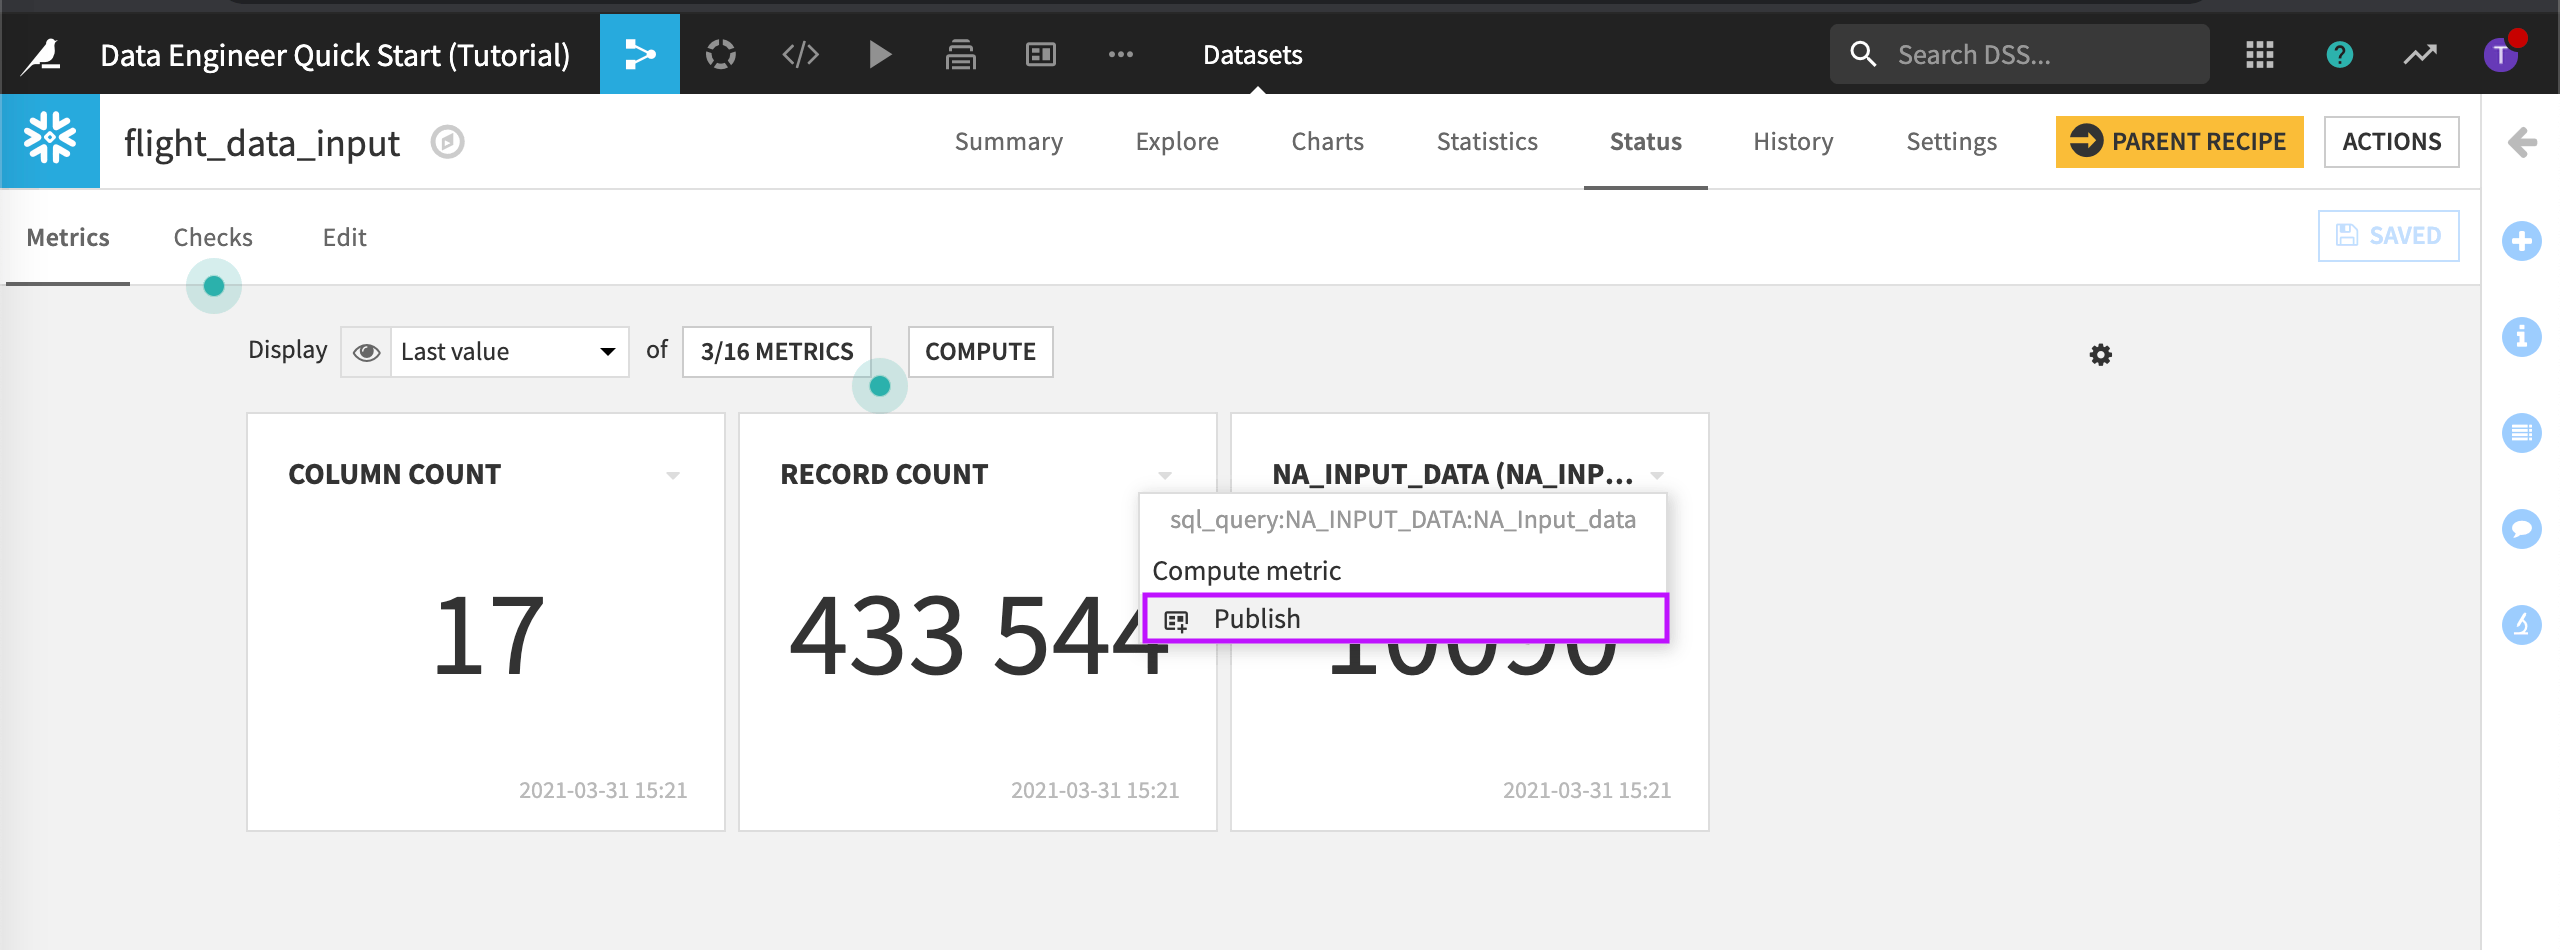
From the Flow, open the dataset, flight_data_input and go to the Status tab.
Click the drop-down arrow next to the “NA Input Data” computed metric.
Choose Publish.
Select the default dashboard and the Project information slide.
Click Create.
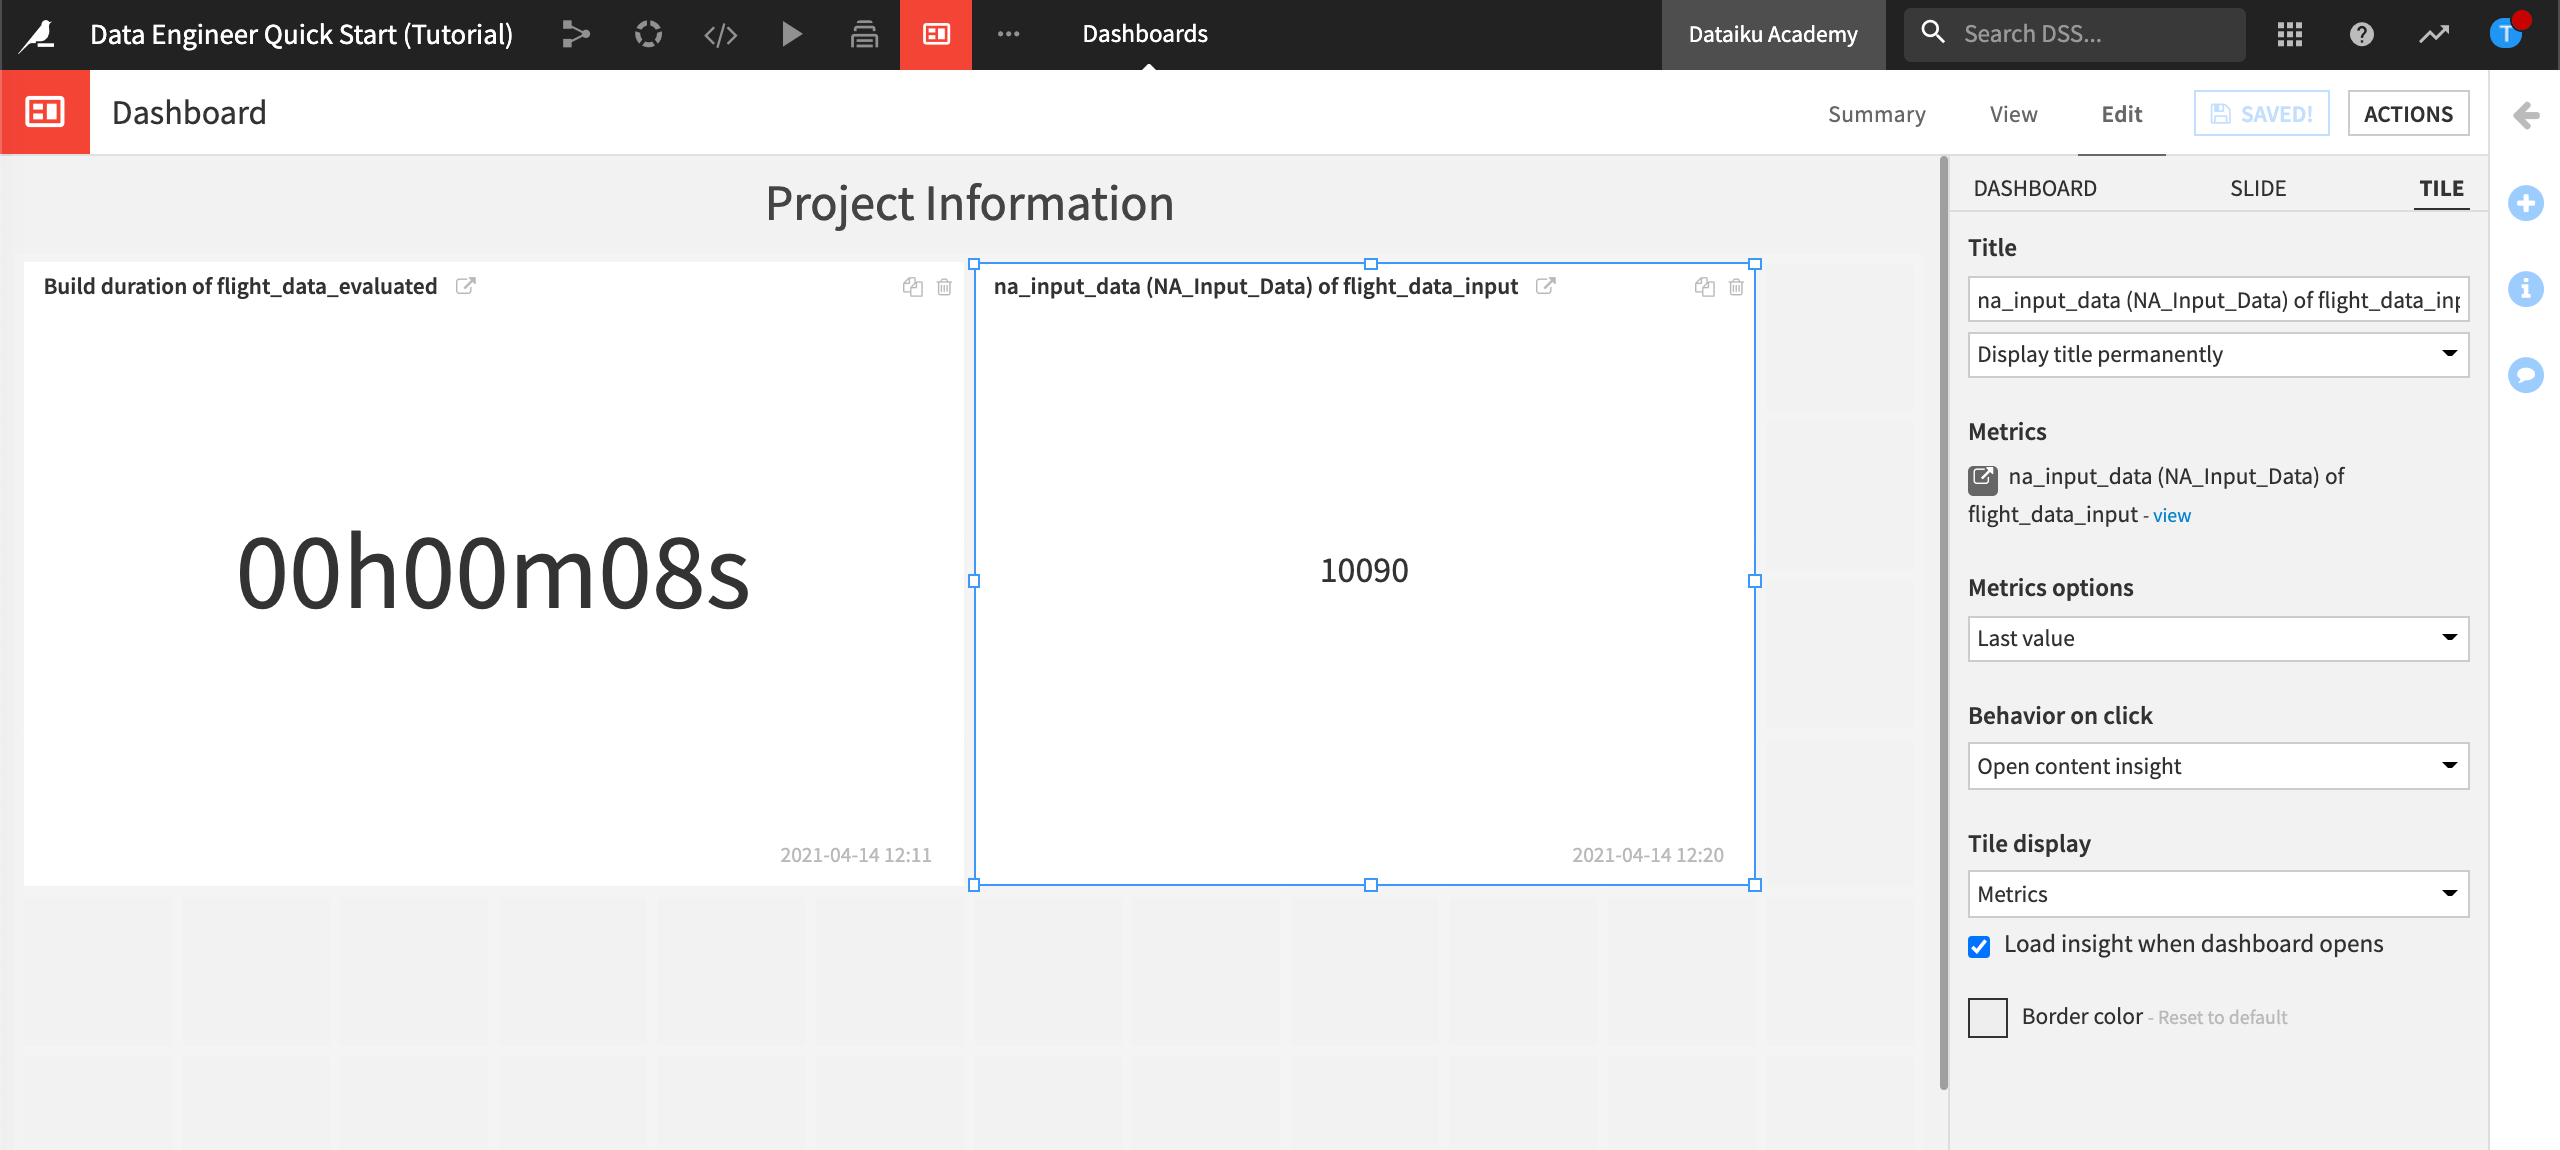
Dataiku DSS displays the default dashboard and the published metric. This dashboard already contains the metric to show the build duration of flight_data_evaluated.
Grab the handles of the newly published insight to resize it.
Save the changes.
Export the Dashboard
We could now export this dashboard to share it with users who do not have access to it. To do this:
In the upper right of the dashboard, click Actions.
Choose Export.
In File Type, select the type of file you want to export.
Click Export Dashboard.
Note
The dashboards export feature must be set up prior to being usable. For more information, visit Exporting dashboards to PDF or images.
Discover SQL Notebooks
Business stakeholders will want to know the top five airports–those with the most number of flight delays. We’ll write a query to find this information. To do this, we’ll use an SQL notebook.
SQL notebooks are interactive environments for performing queries on all SQL databases supported by Dataiku DSS. SQL notebooks support all kinds of SQL statements, from the simplest SQL queries to advanced DDL, and stored procedures.
Create a New SQL Notebook
Let’s create an SQL notebook with three queries. The purpose of the notebook will be to create a metric that finds the top five airports by volume of flight delays.
From the top navigation bar, go to the Code menu, then choose Notebooks.
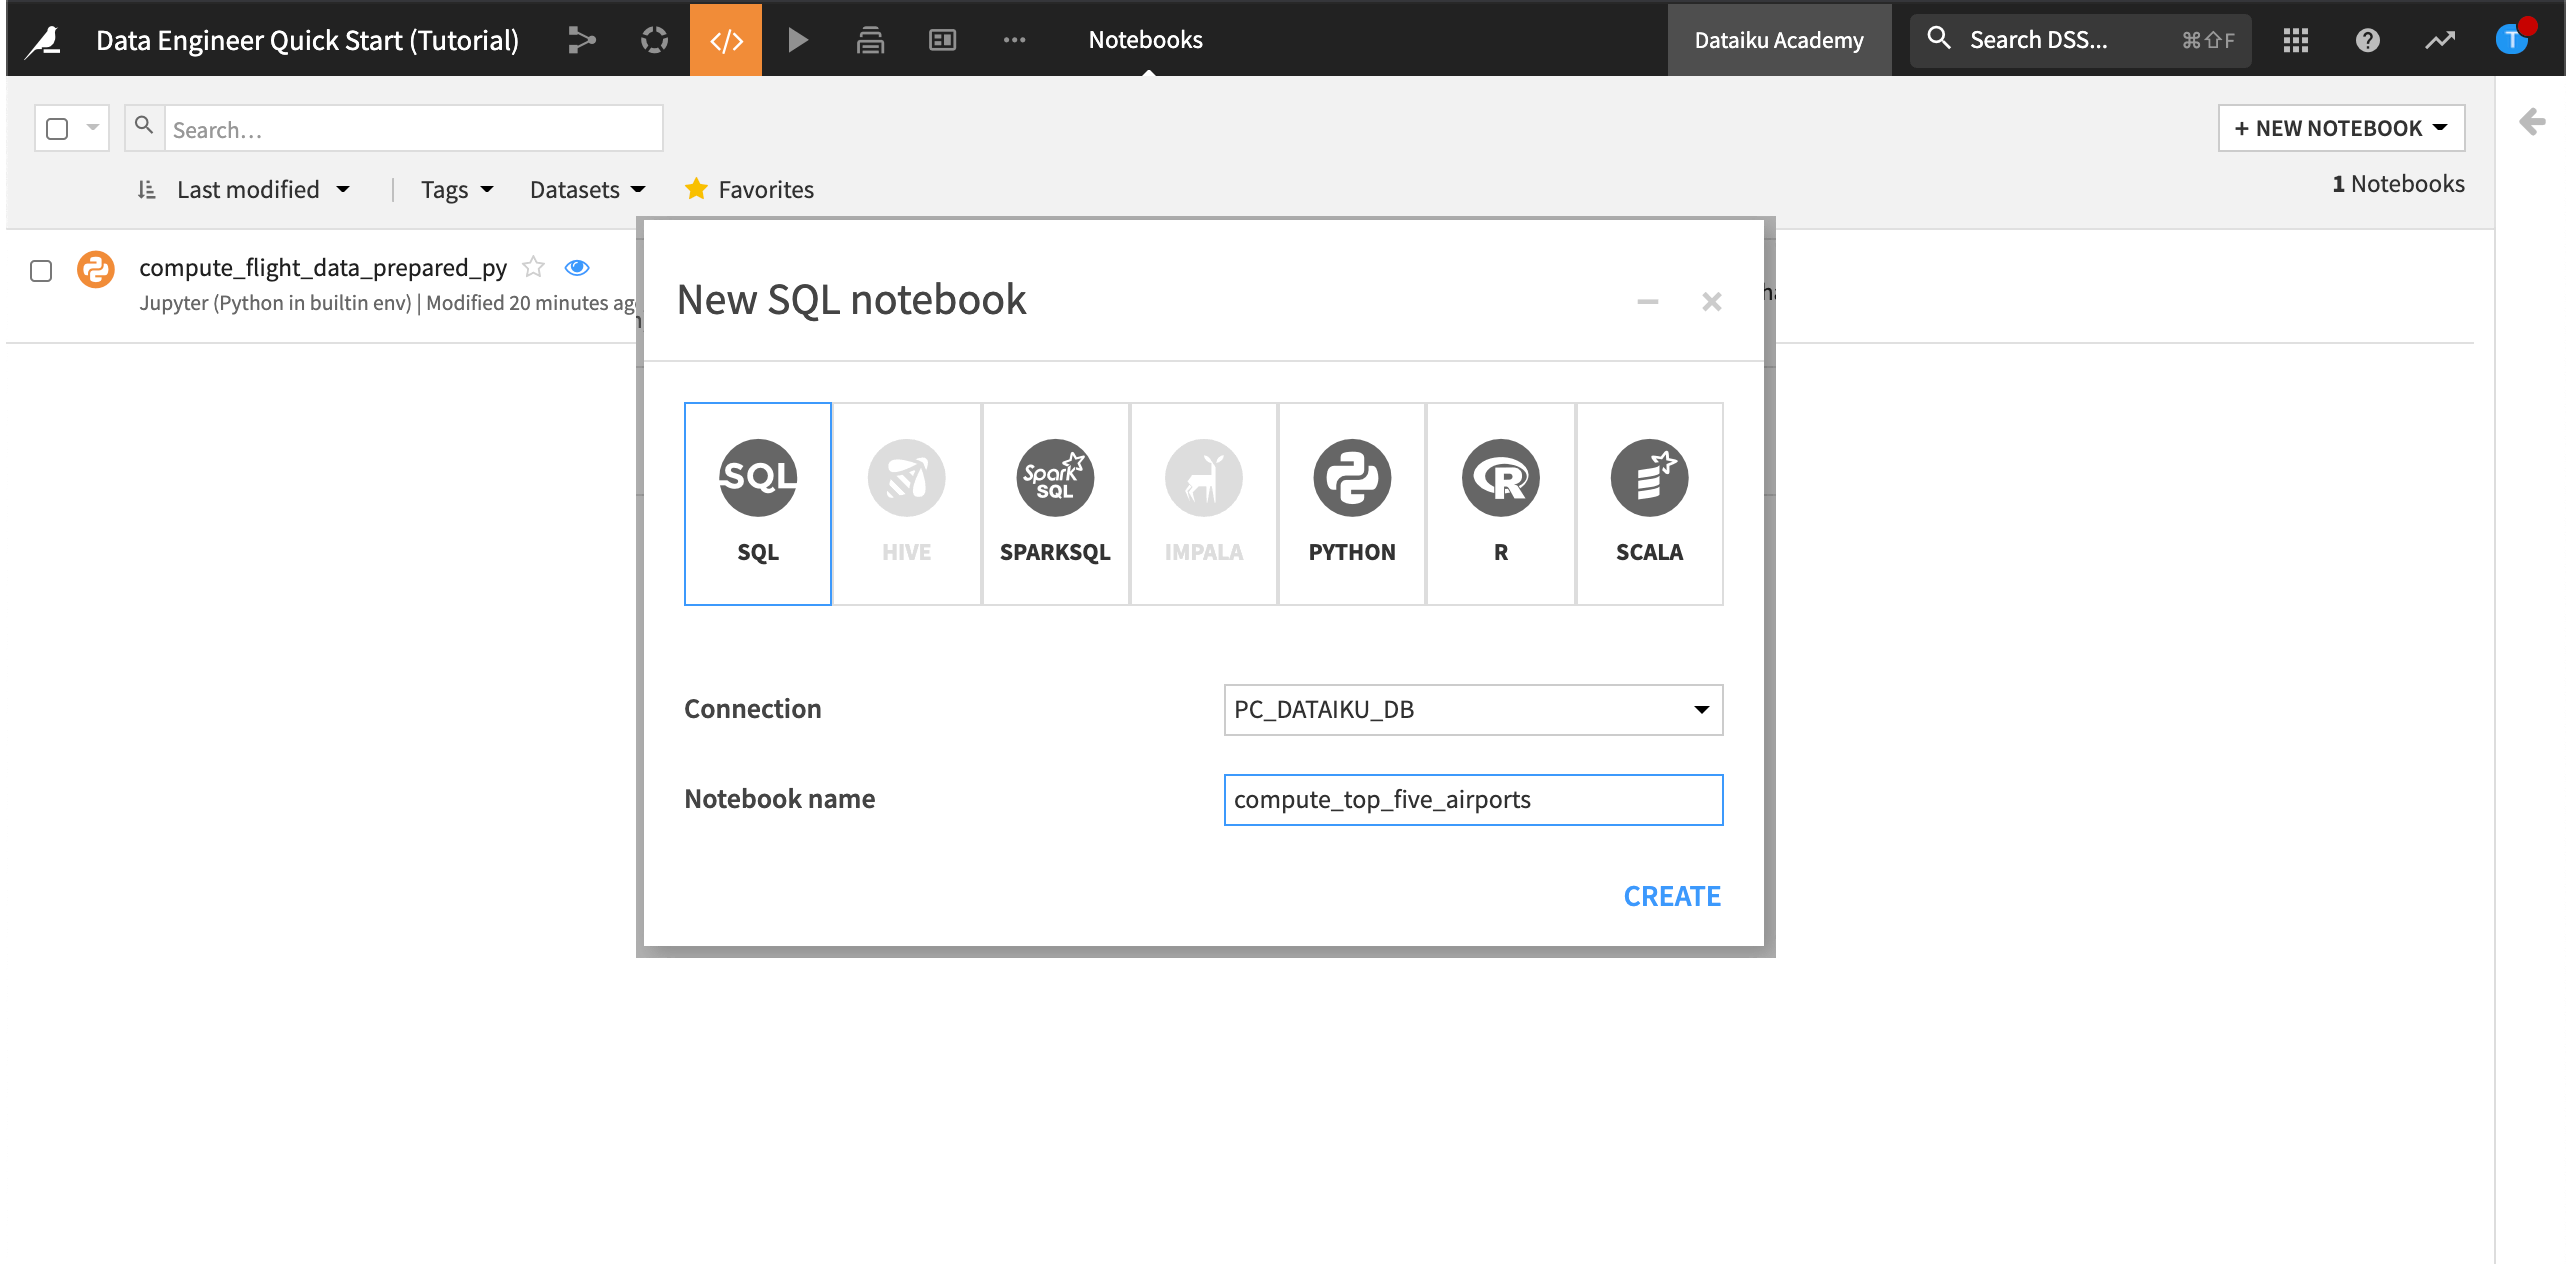
At the top right, click + New Notebook, then choose Write your own.
Select SQL and set the connection to the same SQL connection as the datasets in the Flow.
Name the notebook
compute_top_five_airports.Click Create.
Now we’ll add three new queries to the notebook.
Add A Query to Select All Rows from Flight Data Input
Let’s start with a basic query to ensure we have the right set up.
Click + Query, and name it,
Select ALL from Flight Data Input.In the left panel, click Tables to view the tables.
Click the + next to the flight_data_input table to create the query.
Run the query.
Note
You can always use ${projectKey} to tell Dataiku DSS to use your specific project key.
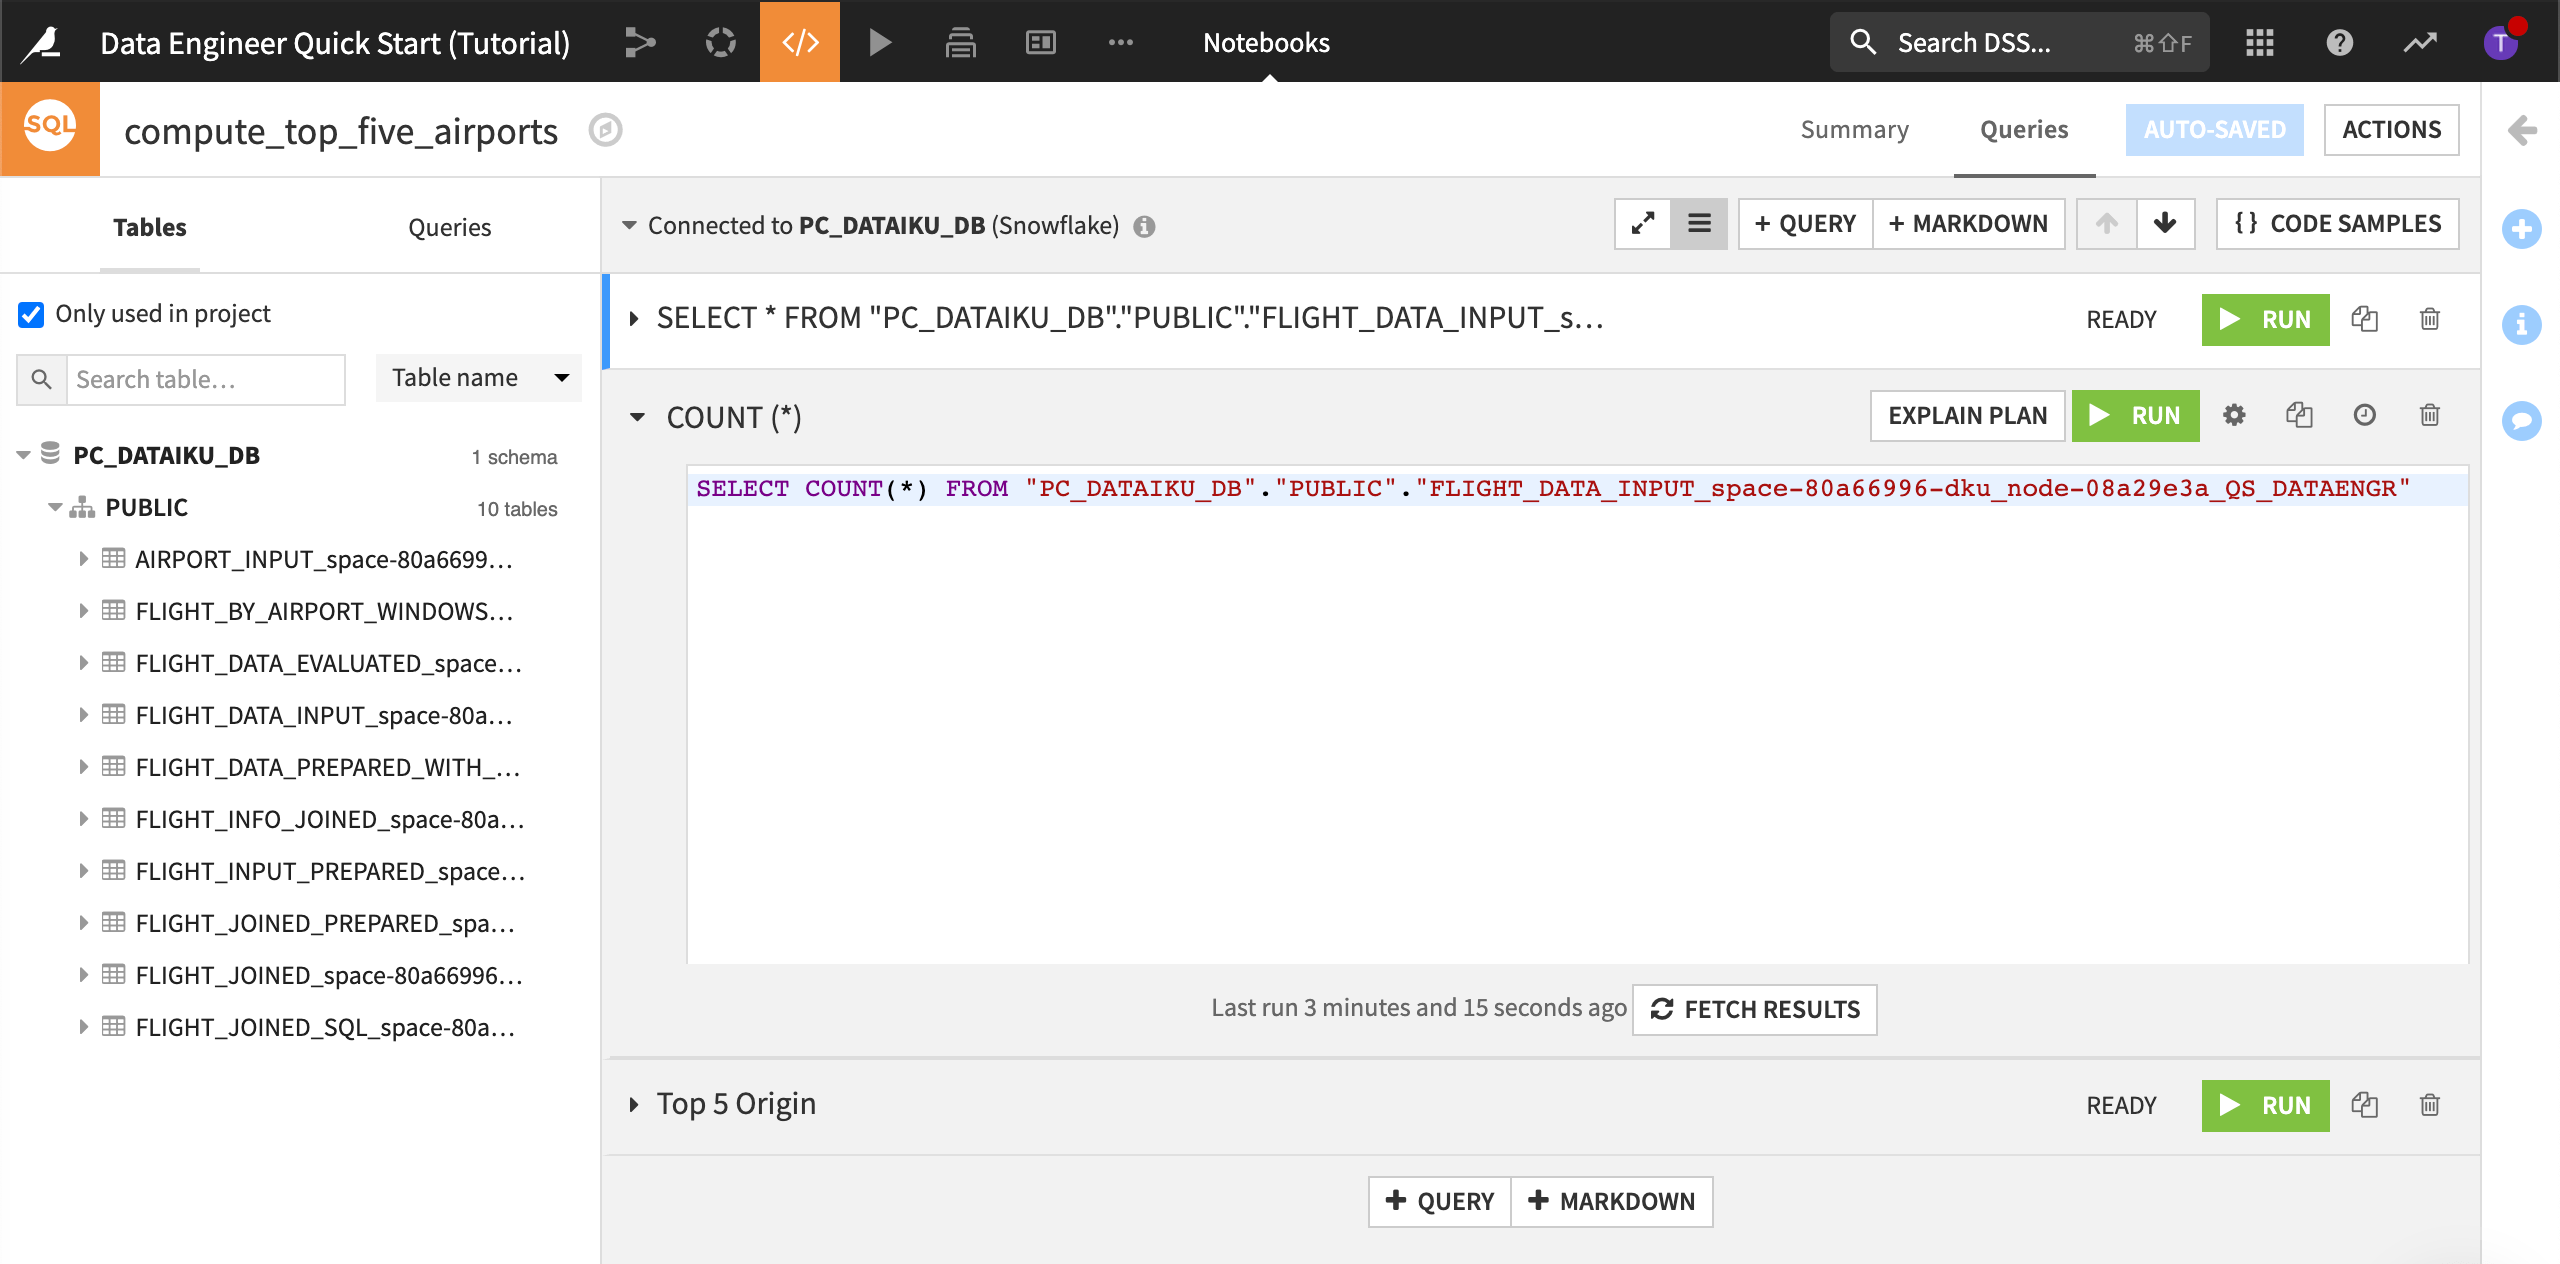
Add A Query to Count the Rows
Click + Query, and name it,
COUNT (*).Using the list of tables, create a query to compute the count of rows from flight_data_input.’
Run the query.
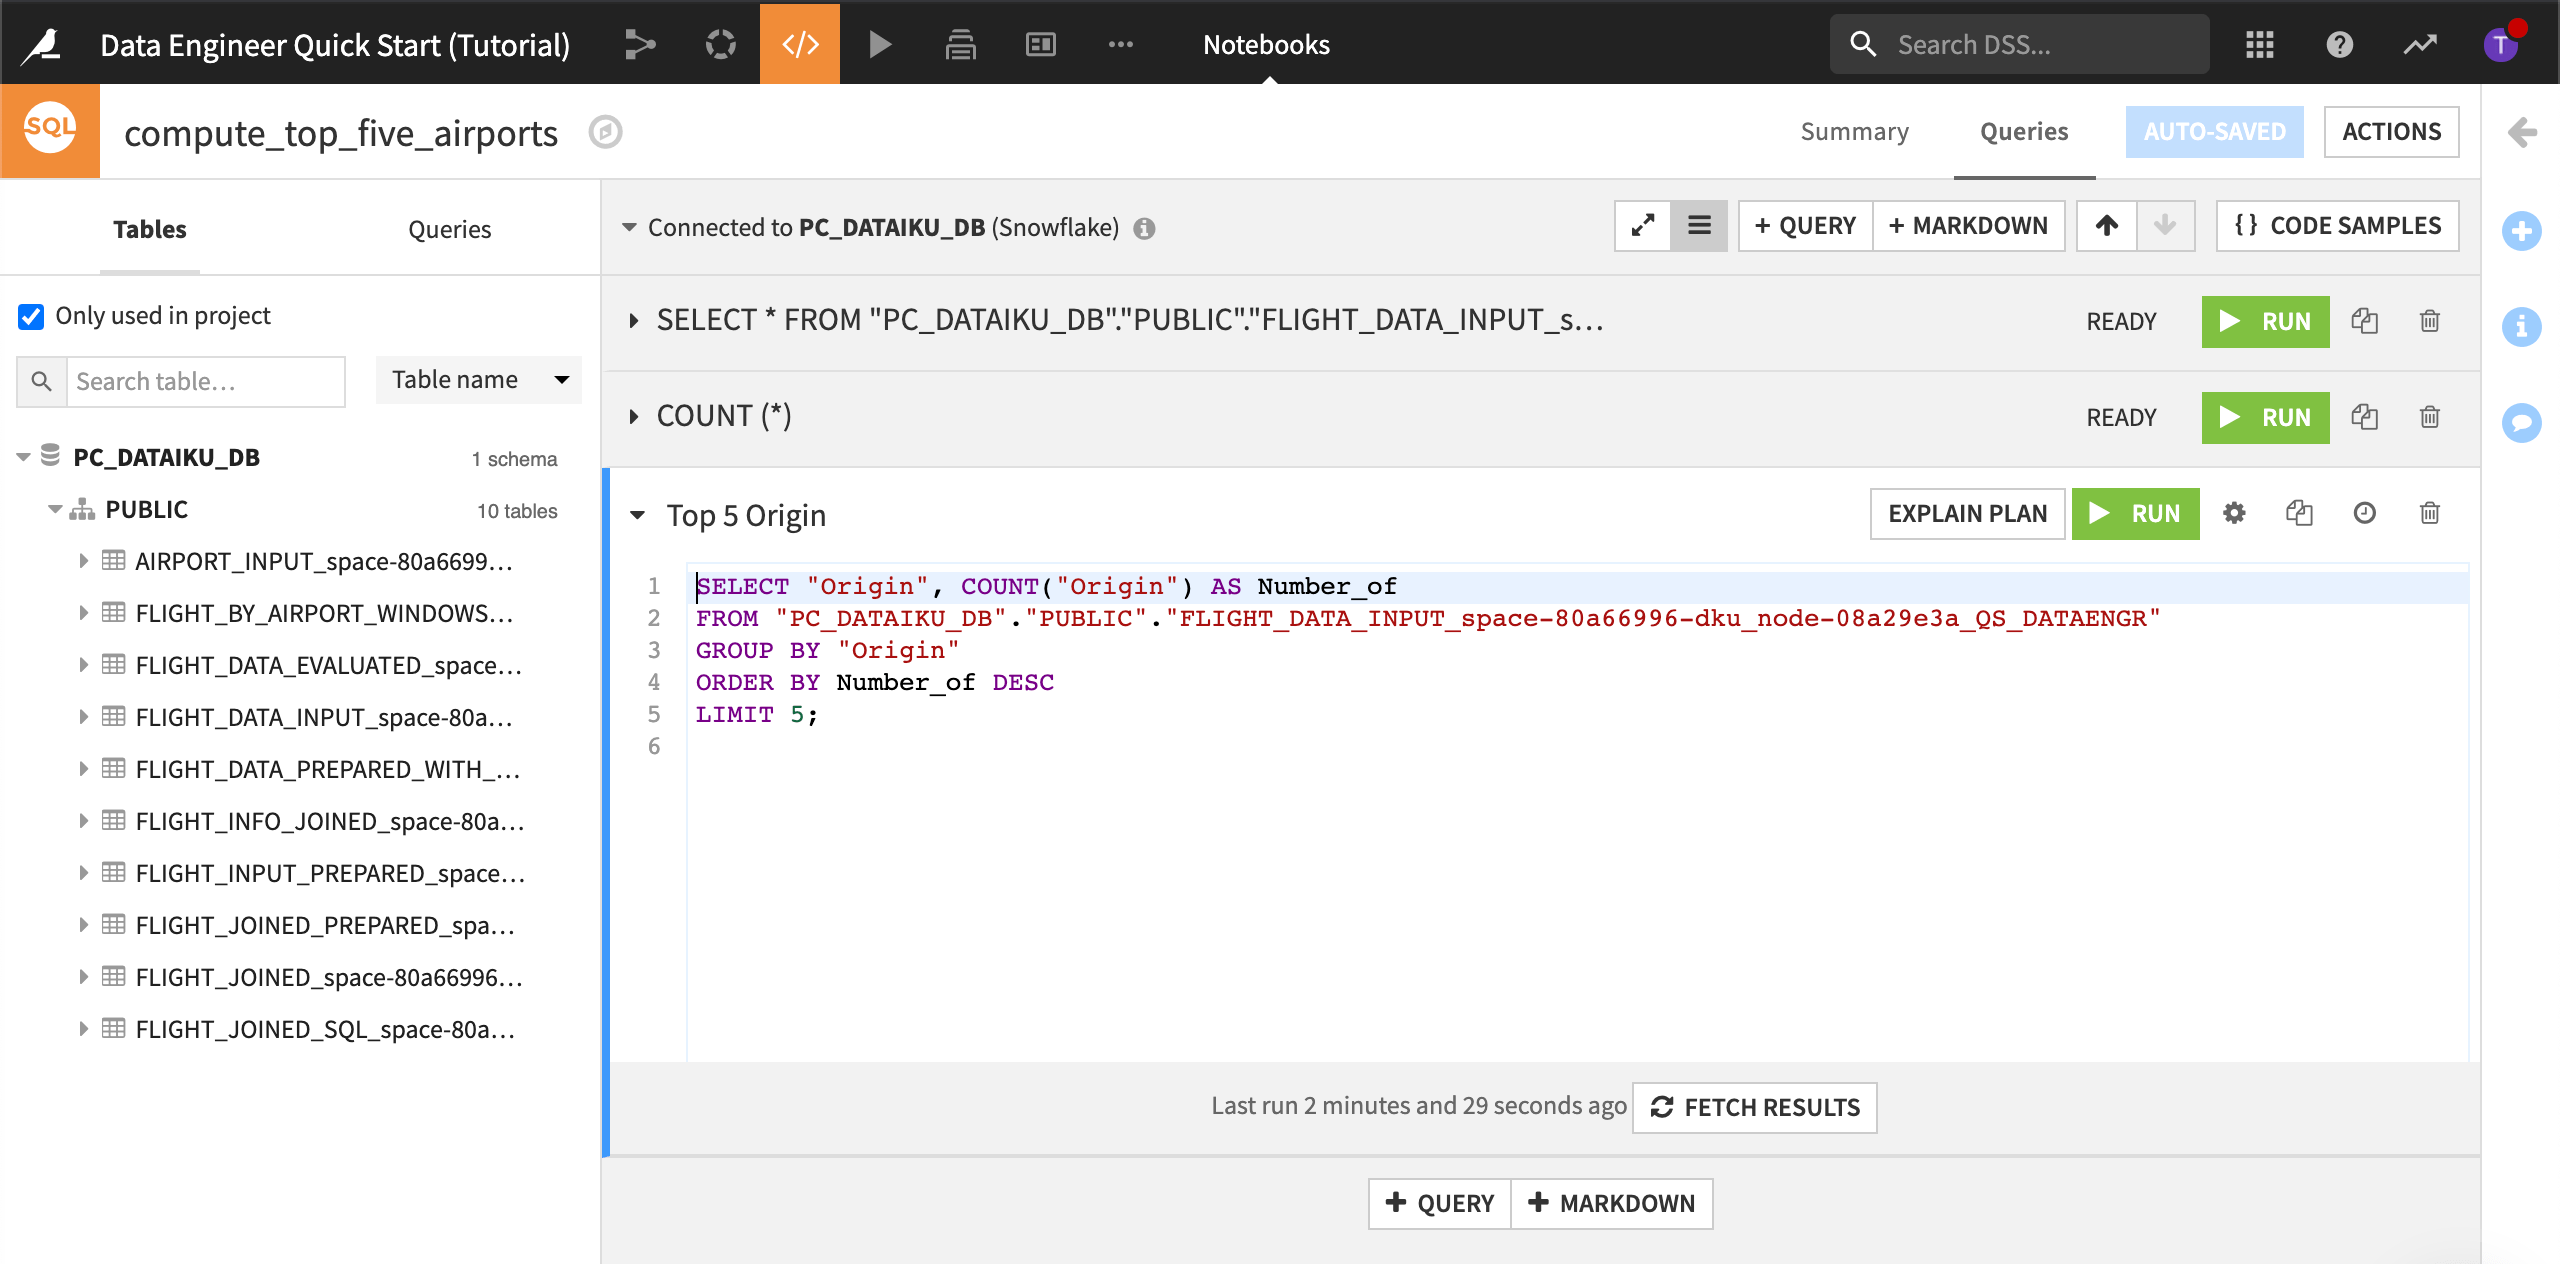
Add A Query to Output the Top Five Airports
Click + Query, and name it,
Top 5 Origin.Using the list of tables, create a query to output the top five origin airports in descending order.
Run the query.
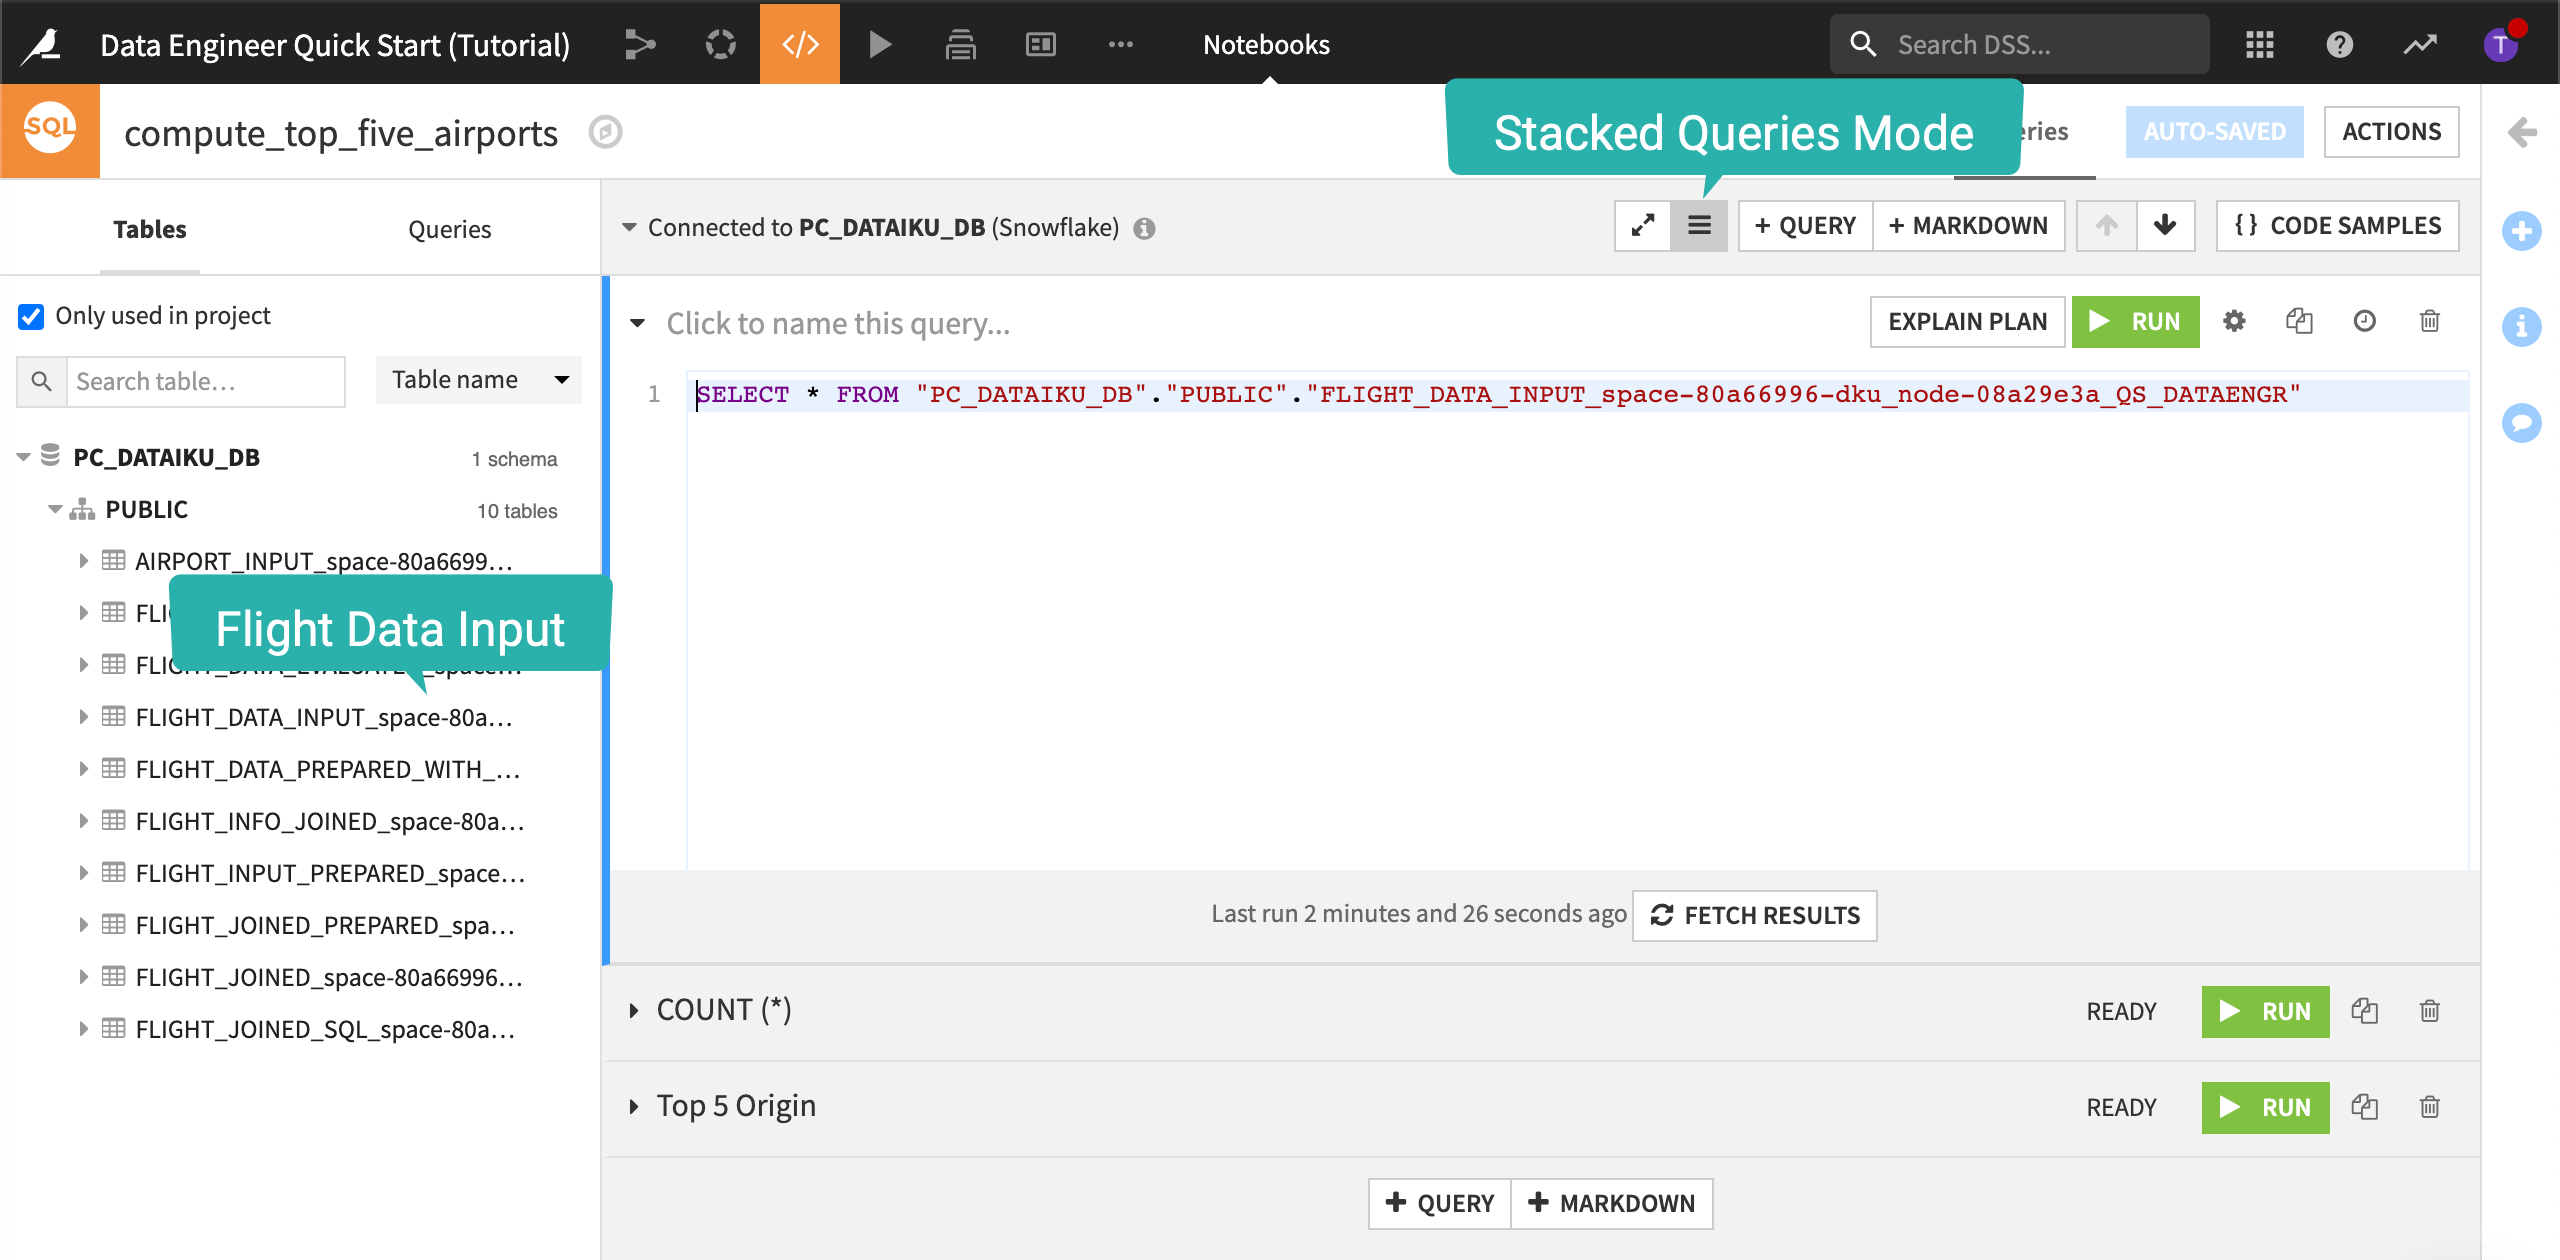
Organize the View
Let’s change the view from full-screen to stacked-queries mode and organize our view so we can see all the queries at once. To do this:
Click the Stacked queries mode icon.
Collapse each query.
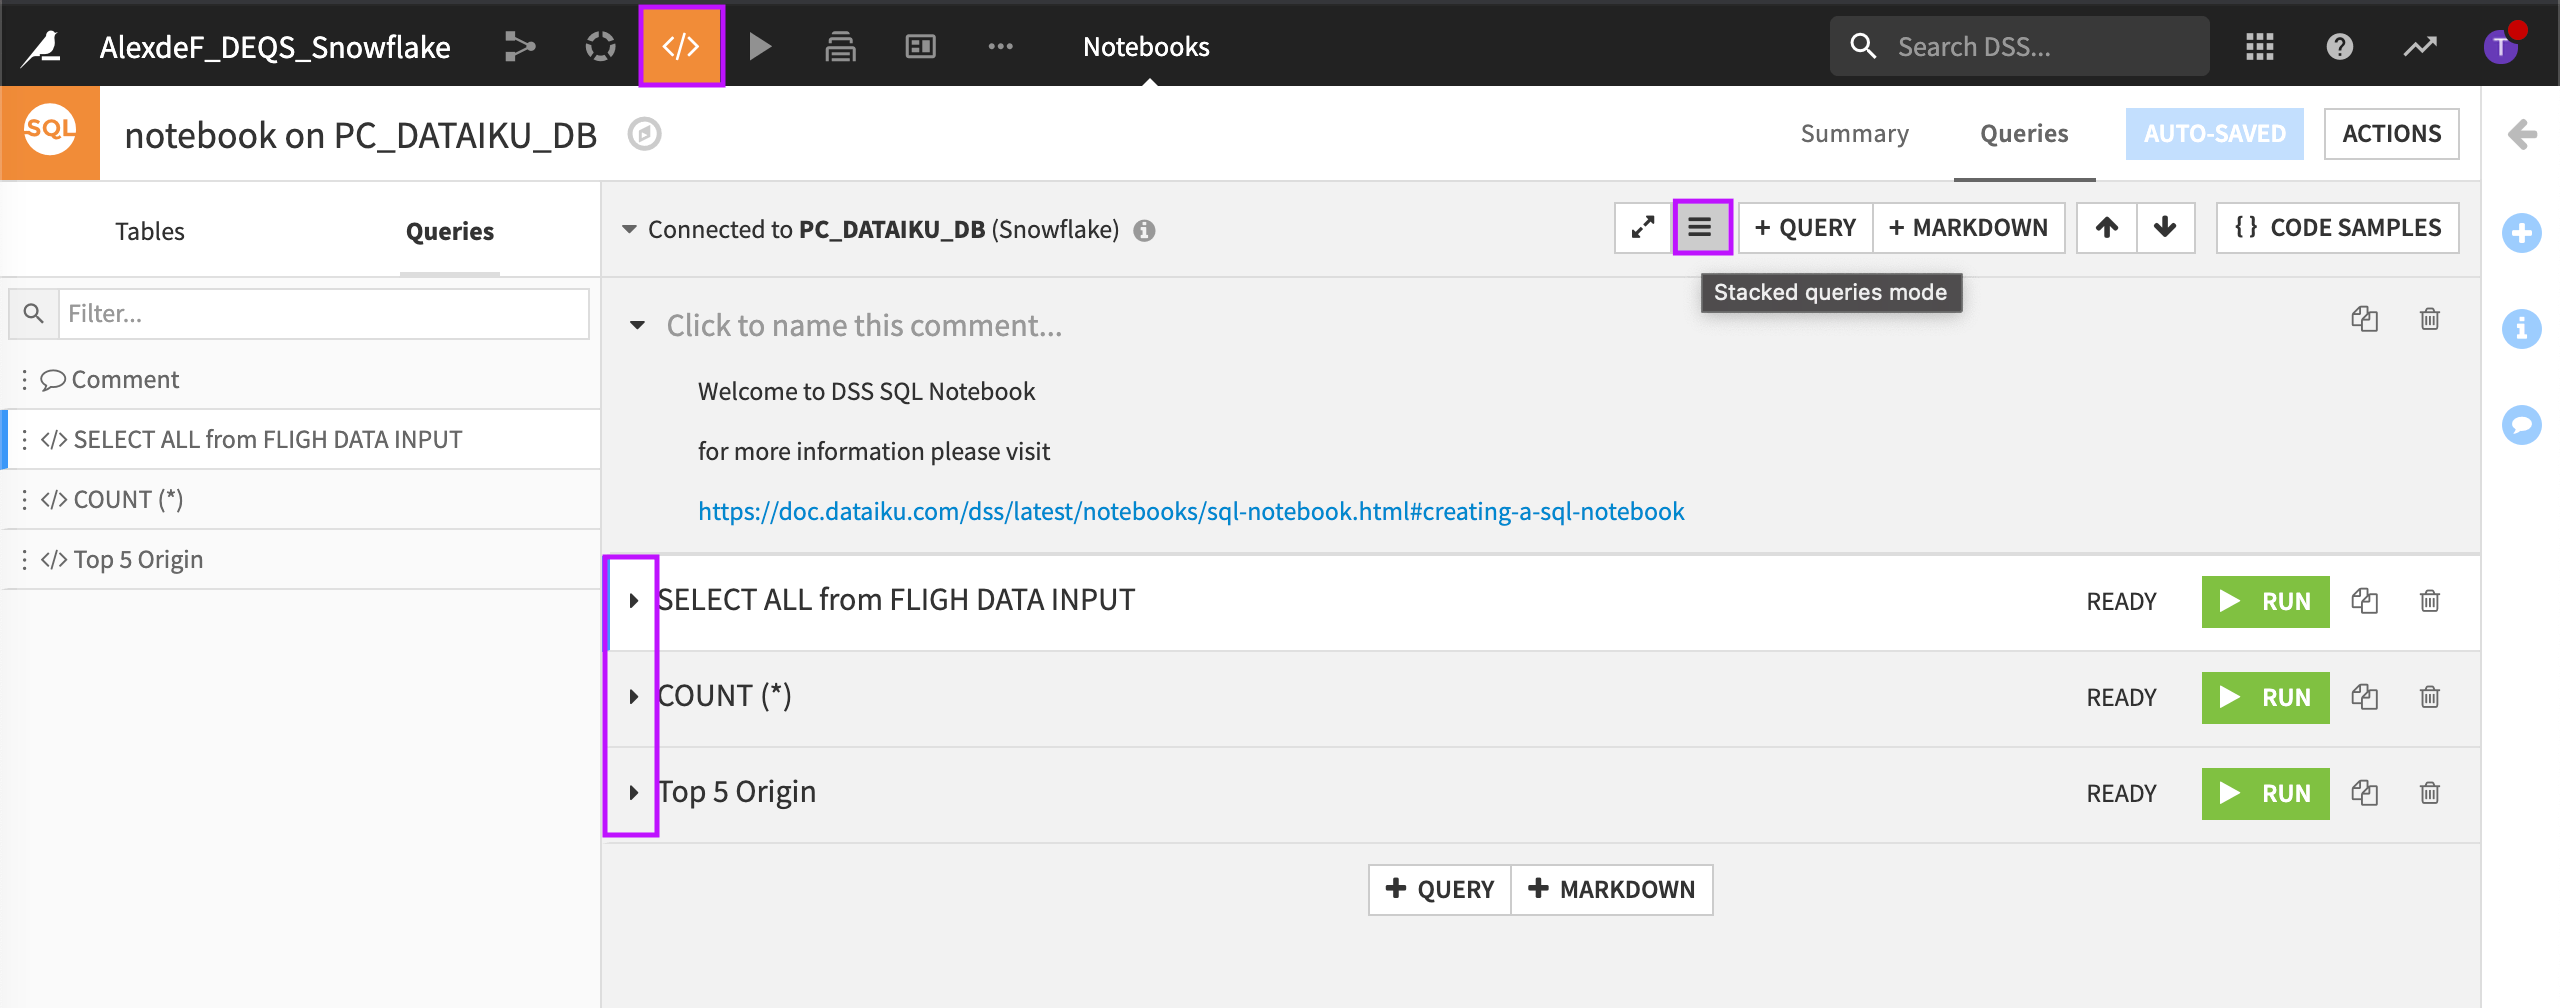
Using this view, we could check the status of and run each query.
For more information about SQL notebooks, visit Creating a SQL Notebook.
What’s Next?
Congratulations! In a short amount of time, you were able to use Dataiku DSS to connect to data, cleanse it, and automate tedious, manual tasks. You also learned that Dataiku DSS provides both code and visual recipes, allowing you to work the way you want.
In this tutorial, we cleansed the data that will be used by the machine learning model, but we did not build the model. To learn about machine learning in Dataiku DSS in a similar quick start program, visit Data Scientist Quick Start.
To learn more about some of the key concepts presented in this tutorial, visit the following Dataiku Academy and Knowledgebase resources:
For more information about some of the key concepts presented in this tutorial, visit the following Dataiku DSS Reference materials: