Hands-On Tutorial: Perform Univariate Analysis
Note
This lesson is a continuation of the Interactive Visual Statistics hands-on tutorial.
In the previous hands-on lesson, you created a new worksheet on the Statistics page of the winequality dataset and opened the “Select a card type” window. Let’s now look at ways to describe and summarize the data.
To do this, we begin by performing univariate analysis. This kind of analysis is useful for exploring the data distribution for individual variables side-by-side. For example, we might be interested in seeing the data distribution for the three variables: density, alcohol, and type.
From the “Select a card type” window, click the Univariate analysis box. This brings up the “Univariate analysis” window.
The first column of the window lists the number of available variables, with the symbol “\(\#\)” denoting a numerical variable, and “\(\mathrm{A}\)” denoting a categorical variable.
Select density, alcohol, and type, and click the “plus” icon to add them to “Variables to describe”.
Notice that DSS automatically selects the statistical “Options” (in the third column of the window) that are appropriate for the numerical variables (density and alcohol) and the categorical variable (type). You can deselect any of these options if you so choose.
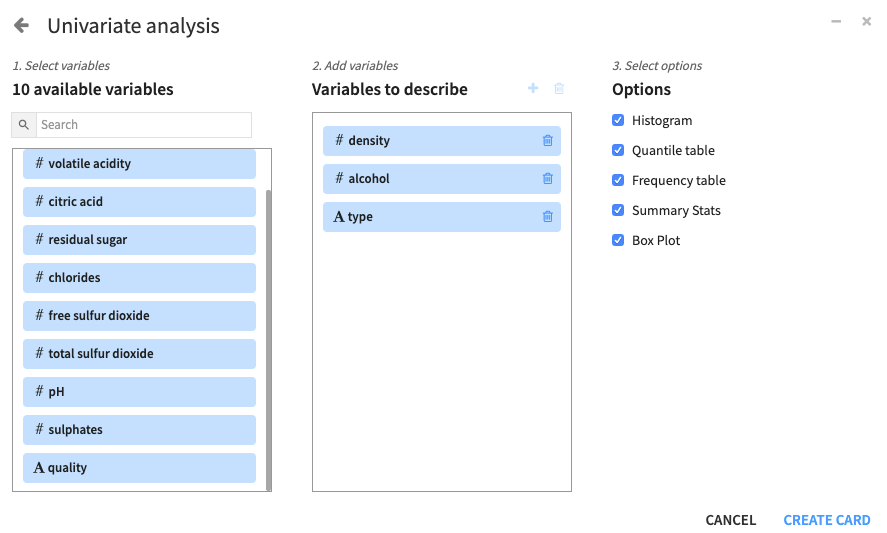
Click Create Card to create the univariate analysis card.
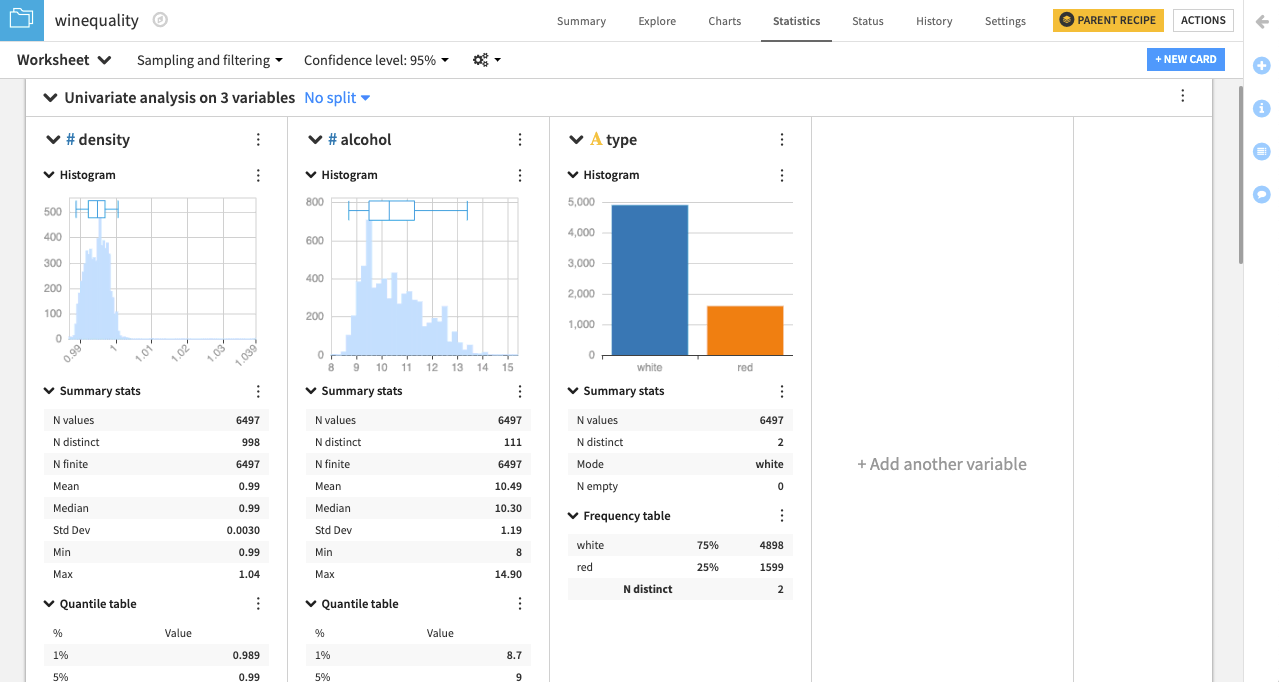
DSS creates a card with one section for each variable. The type of statistical chart and descriptive statistic in each section depends on whether the variable is categorical or numerical. For example, type, a categorical variable, has a bar chart (or categorical histogram), while density and alcohol each have a numerical histogram and box plot insert. Also, the quantile table is applicable to the numerical variables, while the frequency table is applicable to the categorical variable.
Note
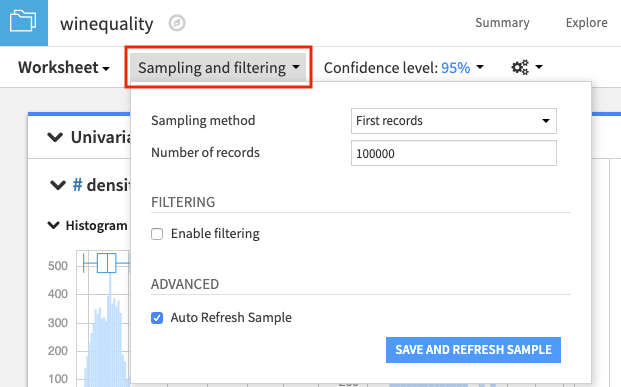
By default, DSS computes worksheet statistics on a sample of the first records in your dataset. You can configure this setting by clicking the drop-down arrow next to Sampling and filtering.
For more information about the univariate analysis card, see Univariate Analysis in the reference documentation.