Creating Excel-Style Pivot Tables with the Pivot Recipe
A pivot table allows you to summarize selected columns and rows of detailed data into a meaningful report.
Before jumping into the hands-on portion of the tutorial, you can watch the following video, which walks through the outline of the steps.
Conceptual Understanding
Suppose we have a dataset that contains the order log from a retail company, and each row represents a separate order.
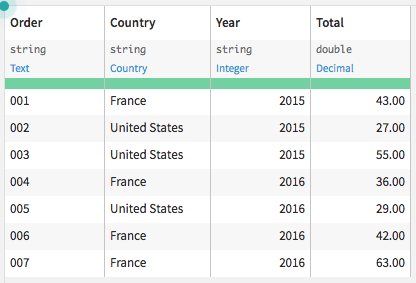
If we want to examine the yearly order totals by country, we might aggregate and reorganize the data to get the following pivot table:
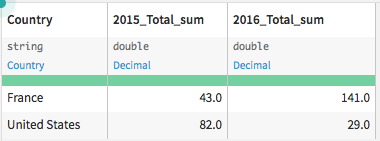
This tutorial will show you how to use the Pivot recipe to create these Excel-style pivot tables that have columns with aggregated values.
Supporting Data
We’ll work with the Haiku T-shirt company’s Orders_enriched_prepared dataset, which can be found in the project +New Project > DSS Tutorials > Automation > Deployment (Tutorial) or you can download the data and import it into a new project.
Note
You can also download the starter project from this website and import it as a zip file.
Note
If you separately download the data and import it into a new project as a CSV file, you may need to initiate a Prepare recipe so DSS can infer data storage types.
The dataset contains a separate row per order placed and its customer information.
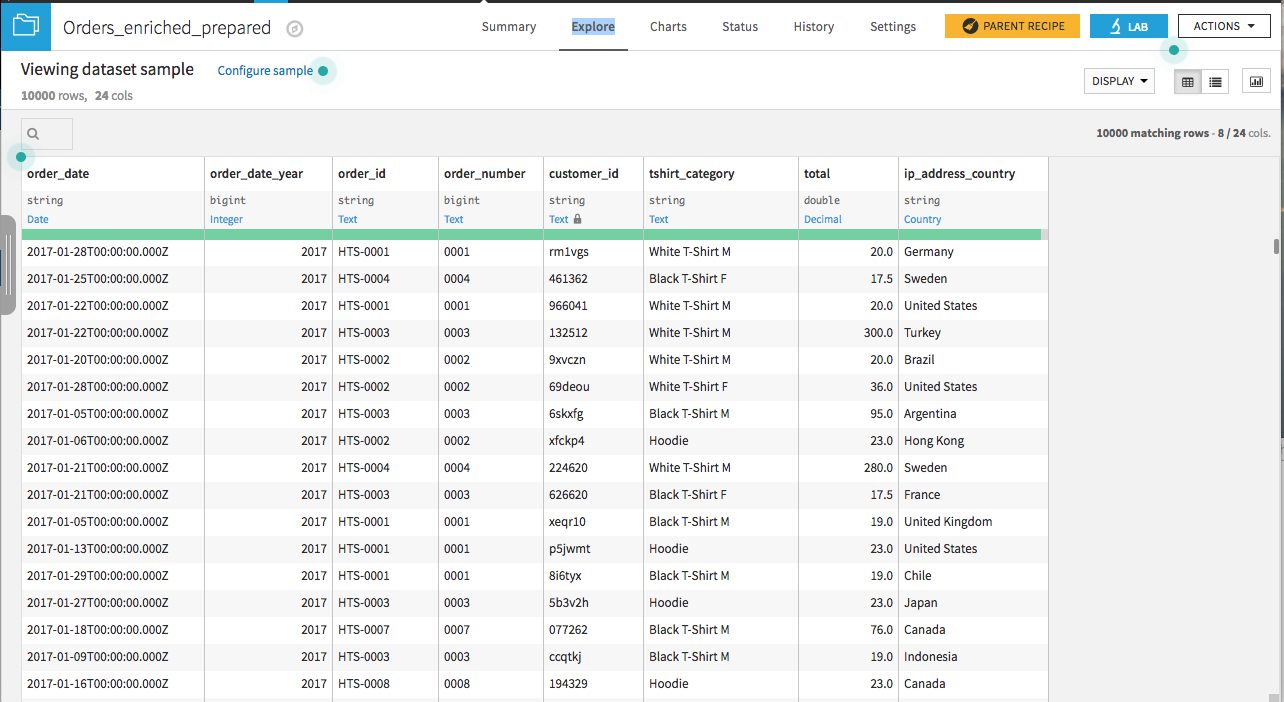
We are interested in examining the yearly order totals by country. We could use the Group recipe to sum the order totals with order_date_year and ip_address_country as keys, and the resulting dataset would have the information we’re interested in, but in long format. Using a pivot recipe will allow us to create an output with one column per year and one row per country.
Creating the Pivot Table
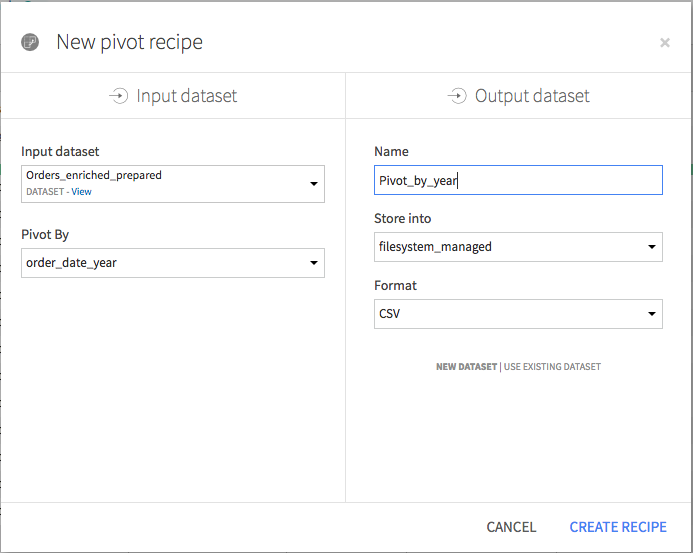
From the Actions menu of the Orders_enriched_prepared dataset, choose Pivot. Choose order_date_year as the column to pivot by. Give the output dataset a descriptive name like Pivot_by_year and click Create Recipe.
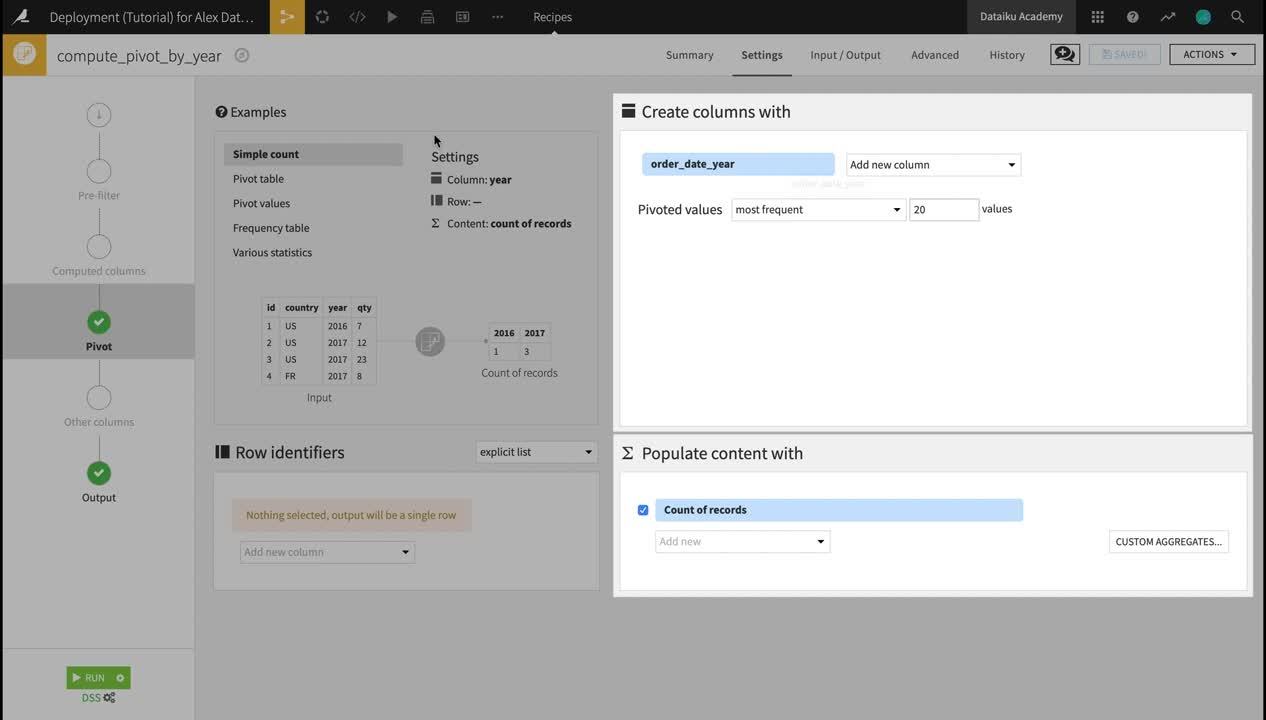
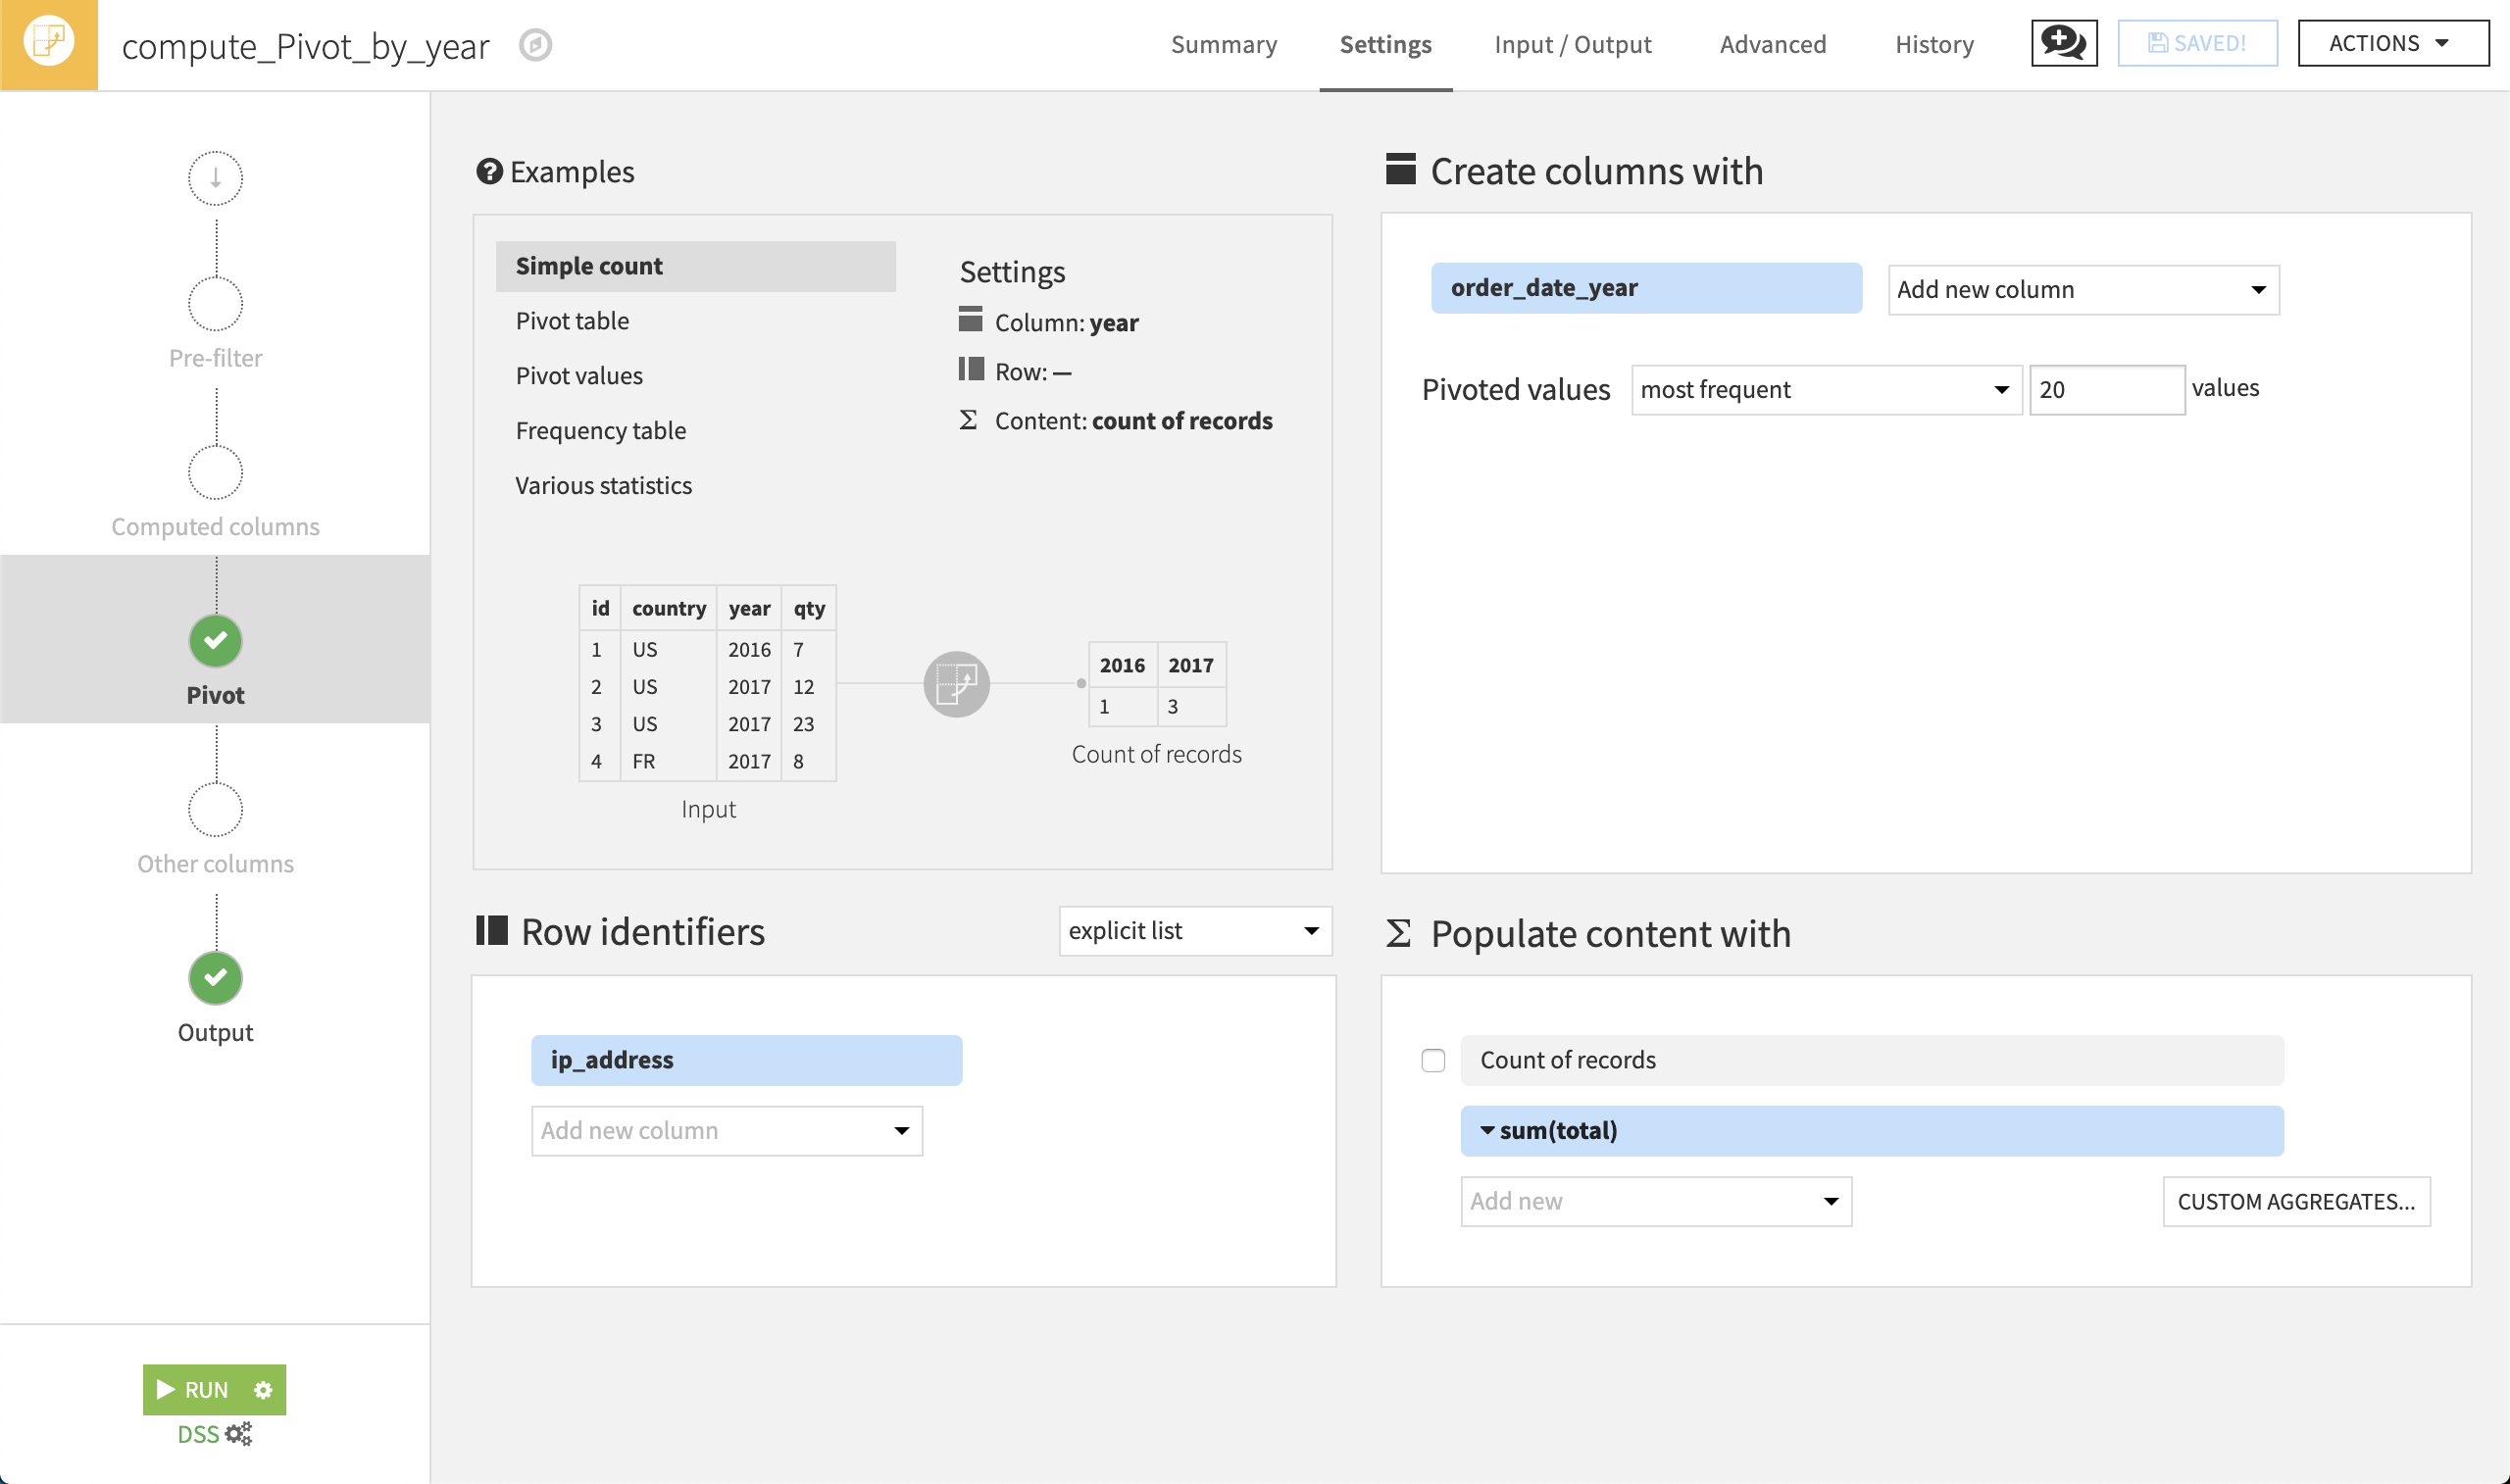
In the Pivot recipe:
the Create columns with field is already populated by order_date_year. For each distinct value of this column, the Pivot recipe will create a new column for each statistic specified in the Populate content with section.
Select ip_address_country as the Row identifier. The output dataset will have a single row for each country.
Choose to populate content with total. By default it selects the count of total; change the aggregate to sum using the dropdown. Deselect Count of records. The pivoted values in the output dataset will show total spending per country per year.
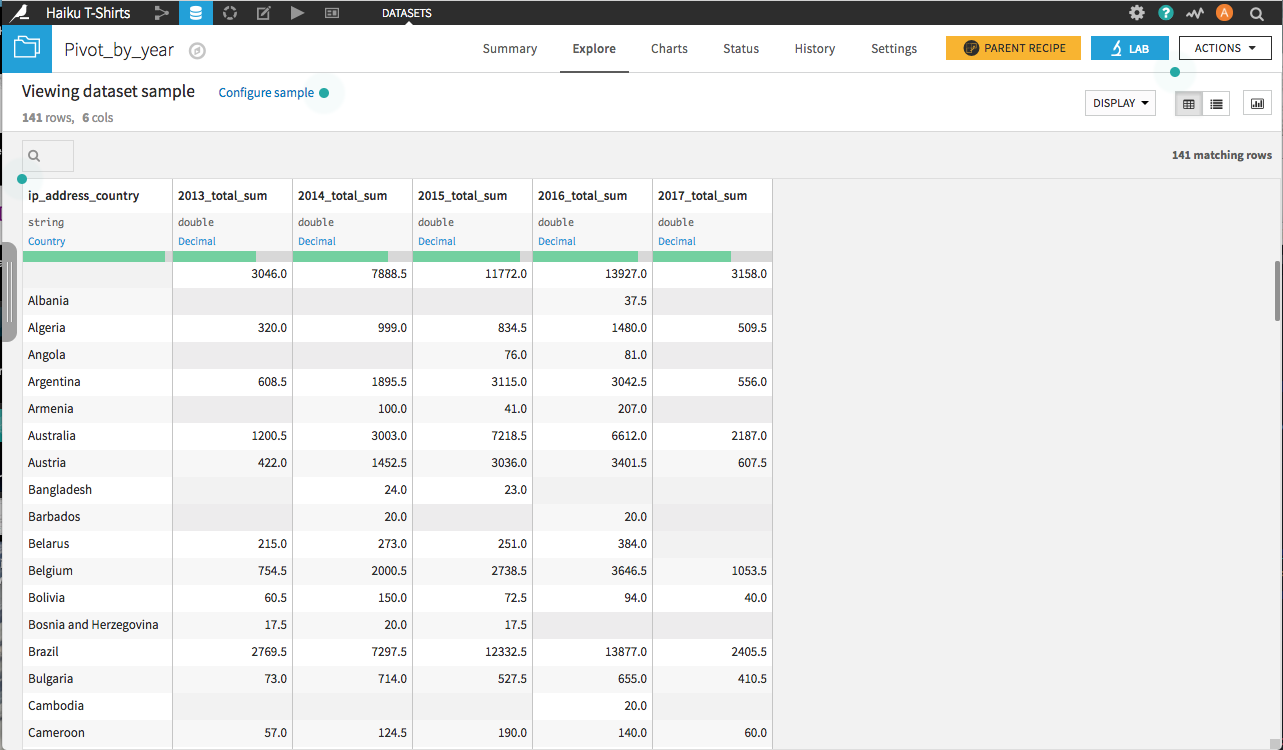
Click Run. In the resulting dataset, there is a row where the country name is blank, for customers whose country of origin could not be determined. There are also blank values for some countries in years where there were no sales to customers from that country.
What Happens When New Data Is Added
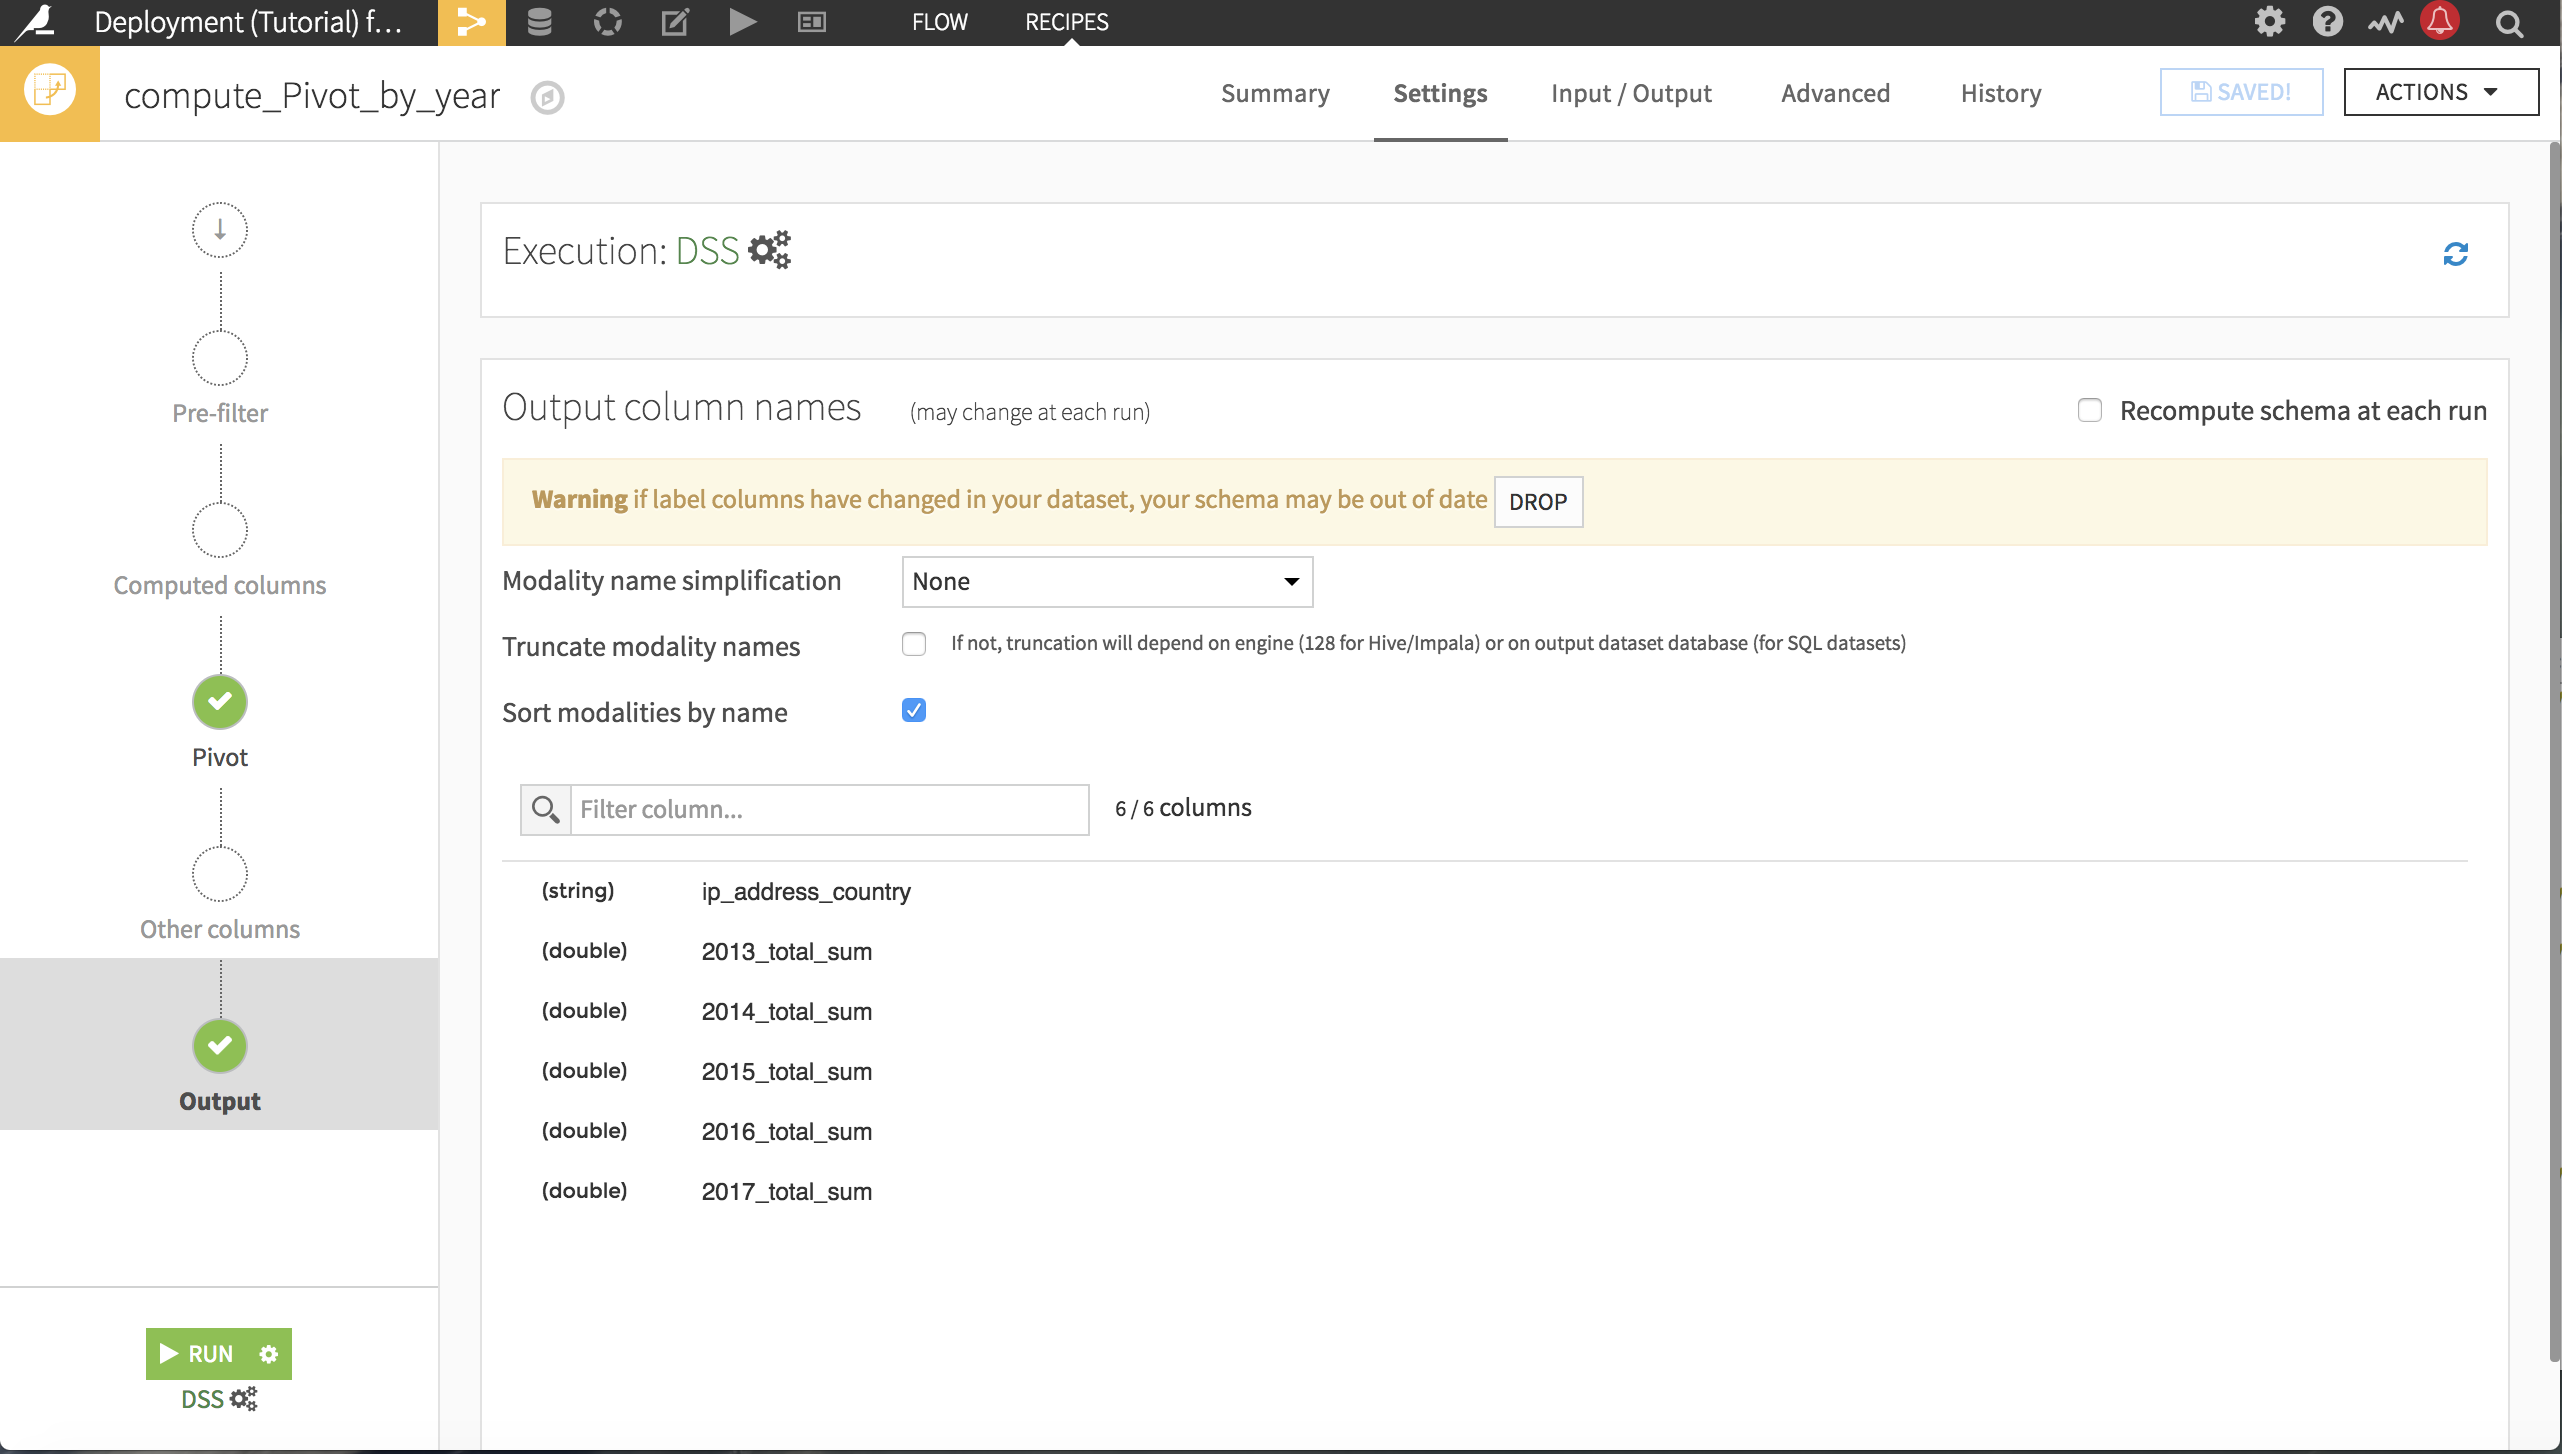
Unlike most other recipes, the schema of the output dataset of a Pivot recipe is affected by the values of the input dataset. In this case, the number of columns in the output dataset was determined by the fact that the company order log spans the years 2013-2017. But what happens when a new year of data is added? Let’s go back to the Output step of the Pivot recipe.
The Pivot recipe is a two-pass algorithm that determines the values to pivot on in the first pass in order to construct the schema of the output dataset, and then uses the second pass to do the pivot.
Warning
If there are a lot of unique values in the column to pivot by, the number of columns in the output dataset can grow out of control, so take care to Analyze the column to pivot by and choose the number of values to pivot carefully. By default, the maximum number of columns created by the Pivot recipe is 200.
The schema of the output dataset was established the first time we ran the pivot recipe. Rebuilding the dataset continues to use the same schema, performing a single pass on the input of the pivot recipe–and ignoring any new values of order_date_year. There are two options for updating the schema from the Output step of the Pivot recipe:
You can manually drop the existing schema by clicking the Drop button.
You can select Recompute schema at each run and it will automatically update every time the Pivot_by_year dataset is built. The danger in this method is that an updated schema can break the flow if the following recipes expected the old schema.
What’s Next
You can examine a completed version of this Pivot recipe on the Dataiku gallery.
The Pivot recipe can also be used to pivot values. Pivoting values is similar to pivot tables, but is a more generic manipulation that populates the pivoted columns with individual, rather than aggregated, values.