Hands-On: Fit Bivariate Distributions
Note
This lesson is a continuation of the Interactive Visual Statistics hands-on tutorial.
Similarly, the 2D Fit Distributions card is available for visualizing and estimating bivariate probability distributions on your dataset.
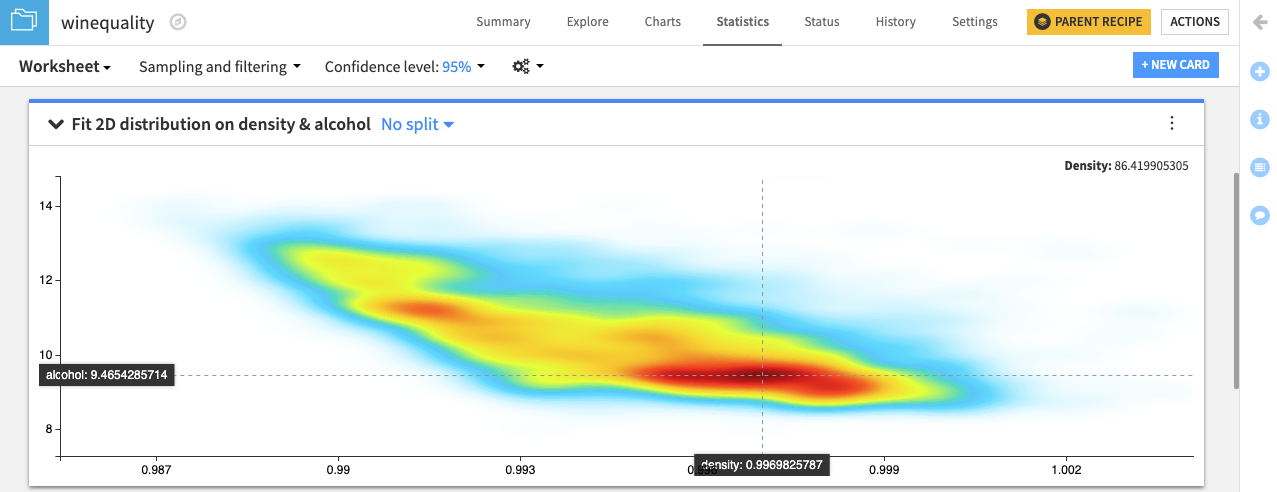
For example, let’s attempt to fit a 2D kernel density estimate (KDE) to the dataset, considering only the density and alcohol variables.
Click the New Card button from the “Worksheet” header, then select Fit curves & distributions.
Select the 2D Fit Distribution card.
Specify density as the “X Variable” and alcohol as the “Y Variable”.
Select the “2D KDE” radio button. Notice that the “X relative bandwidth” and “Y relative bandwidth” have the default value of
15. Let’s keep these default values. However, you can increase the values to make the KDE plot smoother, or decrease the values to make the plot less smooth.Click Create Card to create the card.