How to sort on a measure that is not displayed in charts?
When creating a chart (for example a column chart), you can sort the dimension (i.e. the columns) either:
By its “natural ordering” (i.e. alphabetical or numerical ordering)
Or by the ordering of a “measure”, i.e. the result of an aggregation. For example, the count of records, the average of the age, …
However, this only allows you to sort based on measures that are “displayed” in the chart. There are some cases where you may want to sort on another measure.
For example, if you are graphing the average sale amount per country, you may want to order your countries, not by the average sale amount but by the total sale amount.
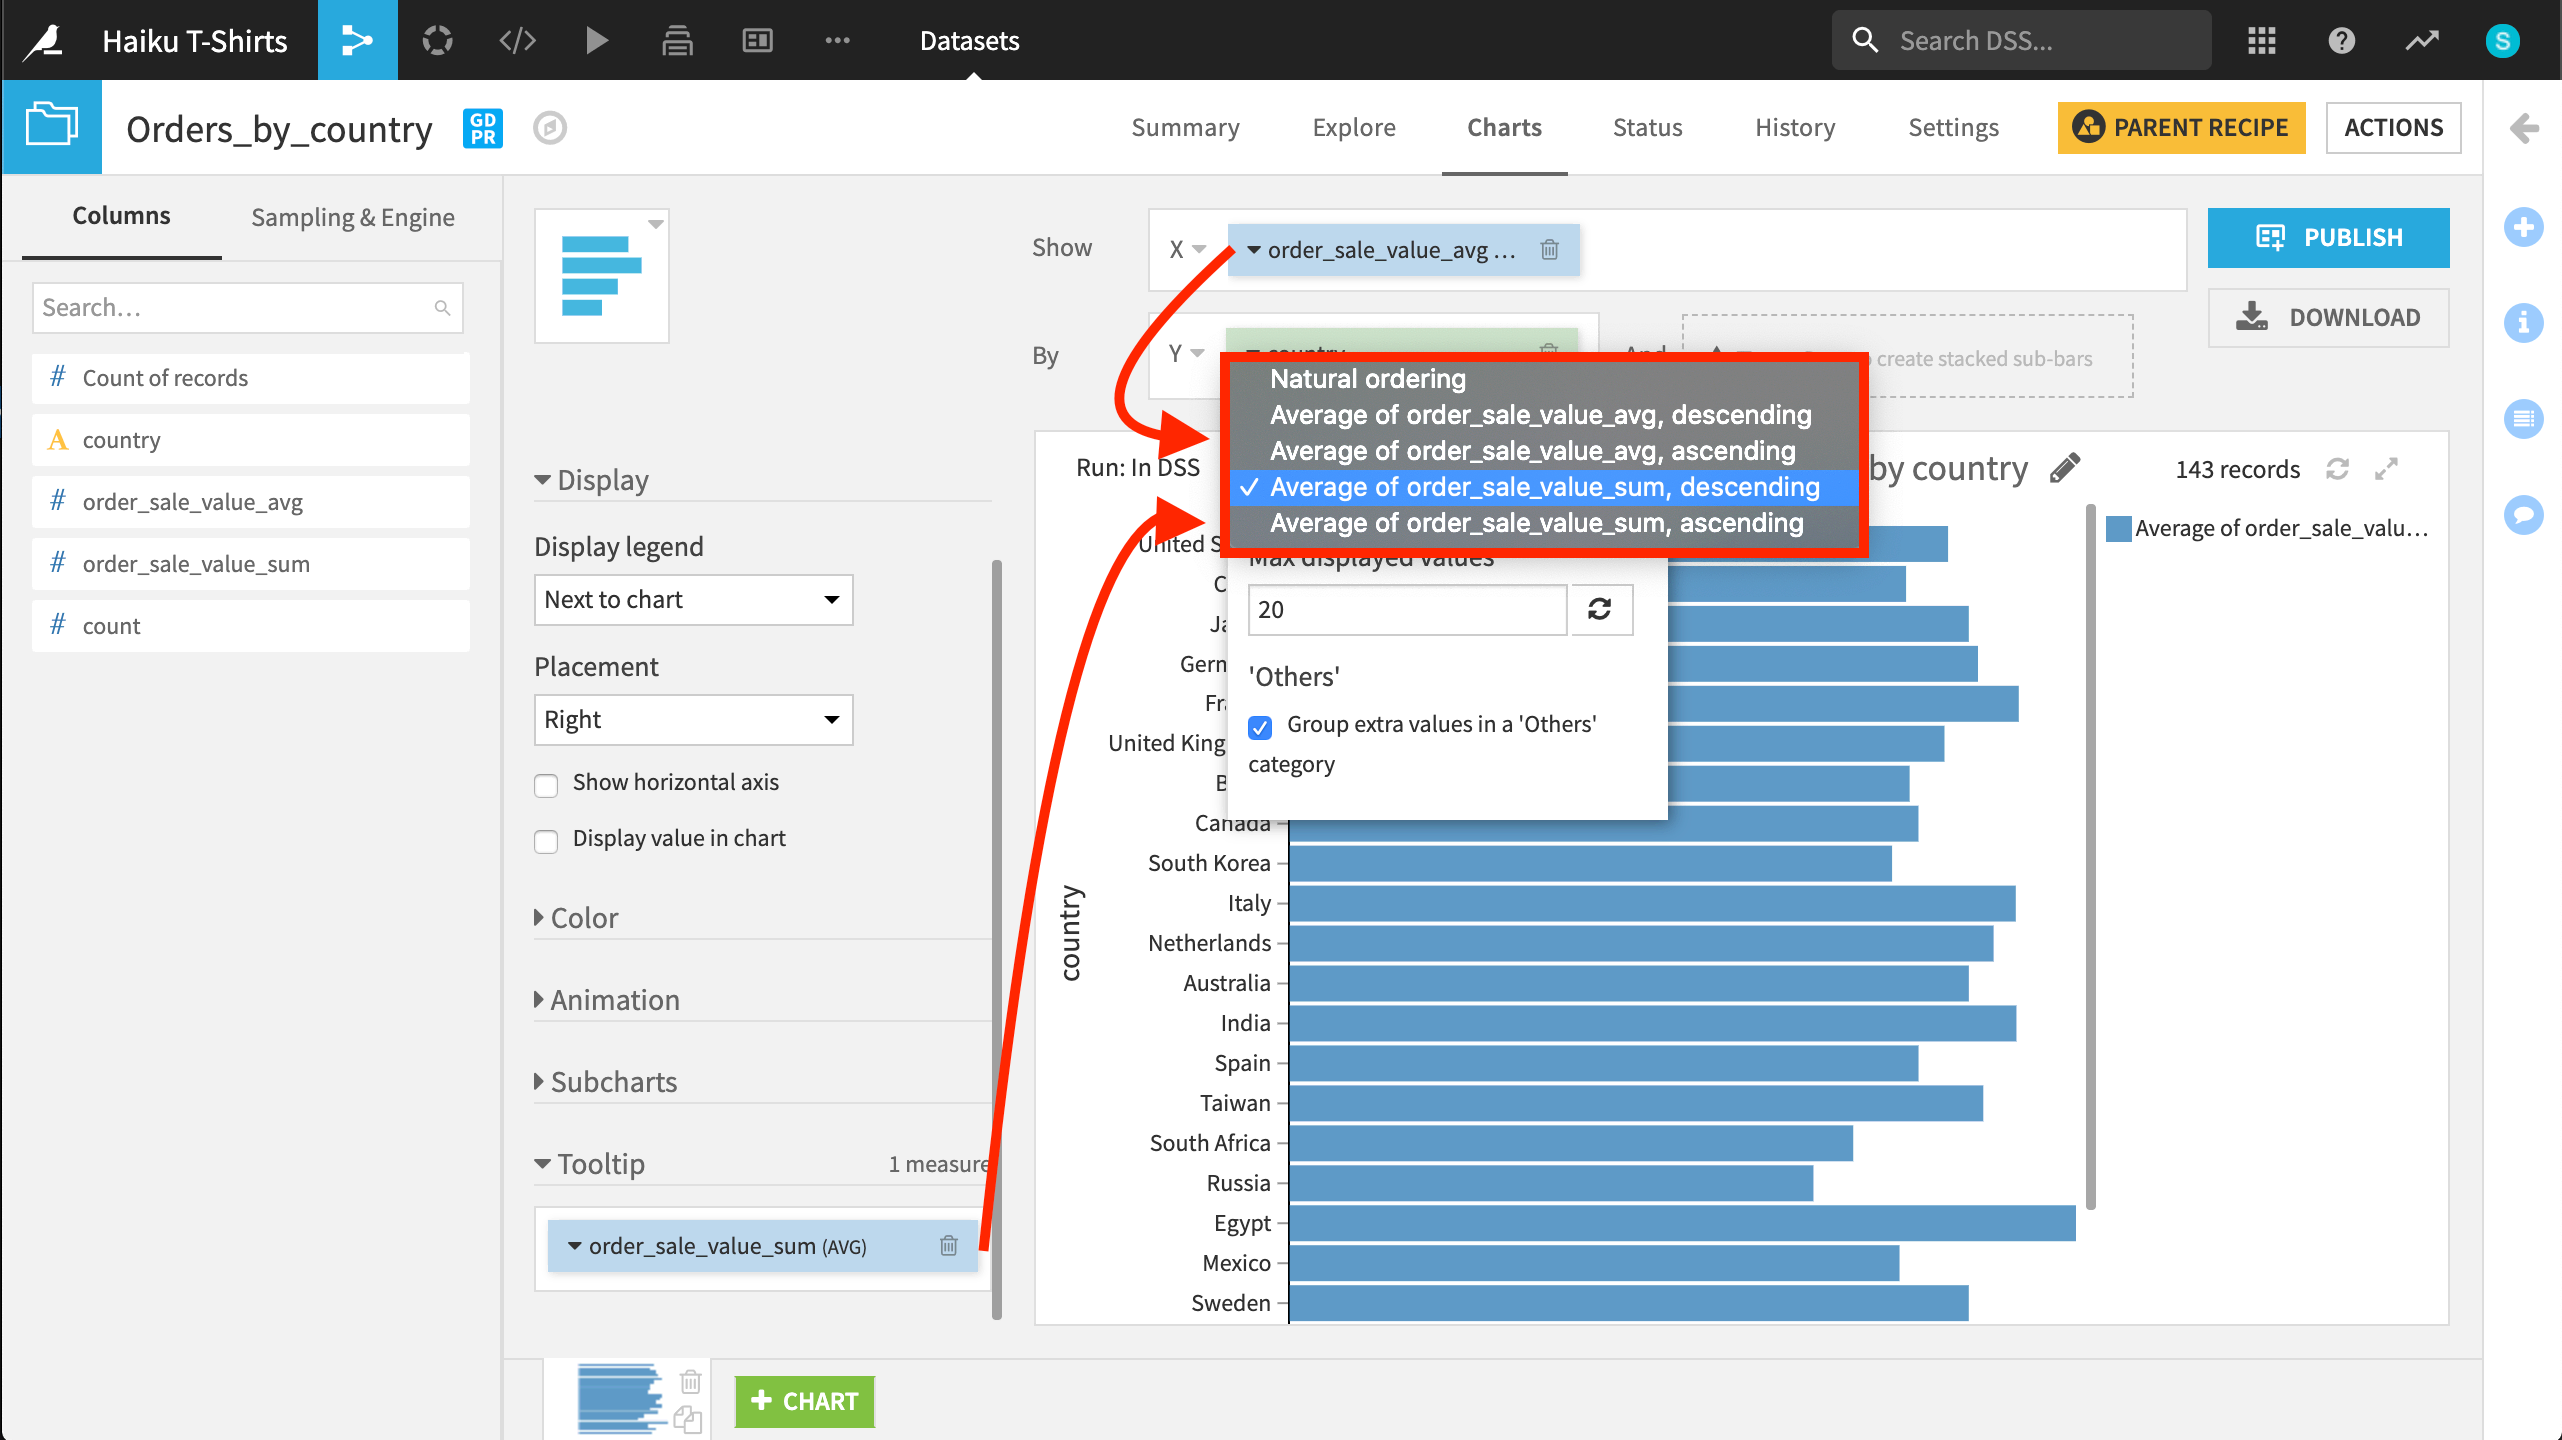
To be able to do that, drag the measure you want to sort on to the “Tooltip” section of the Chart designer. This will put this measure in the tooltip, and allow you to sort based on it.
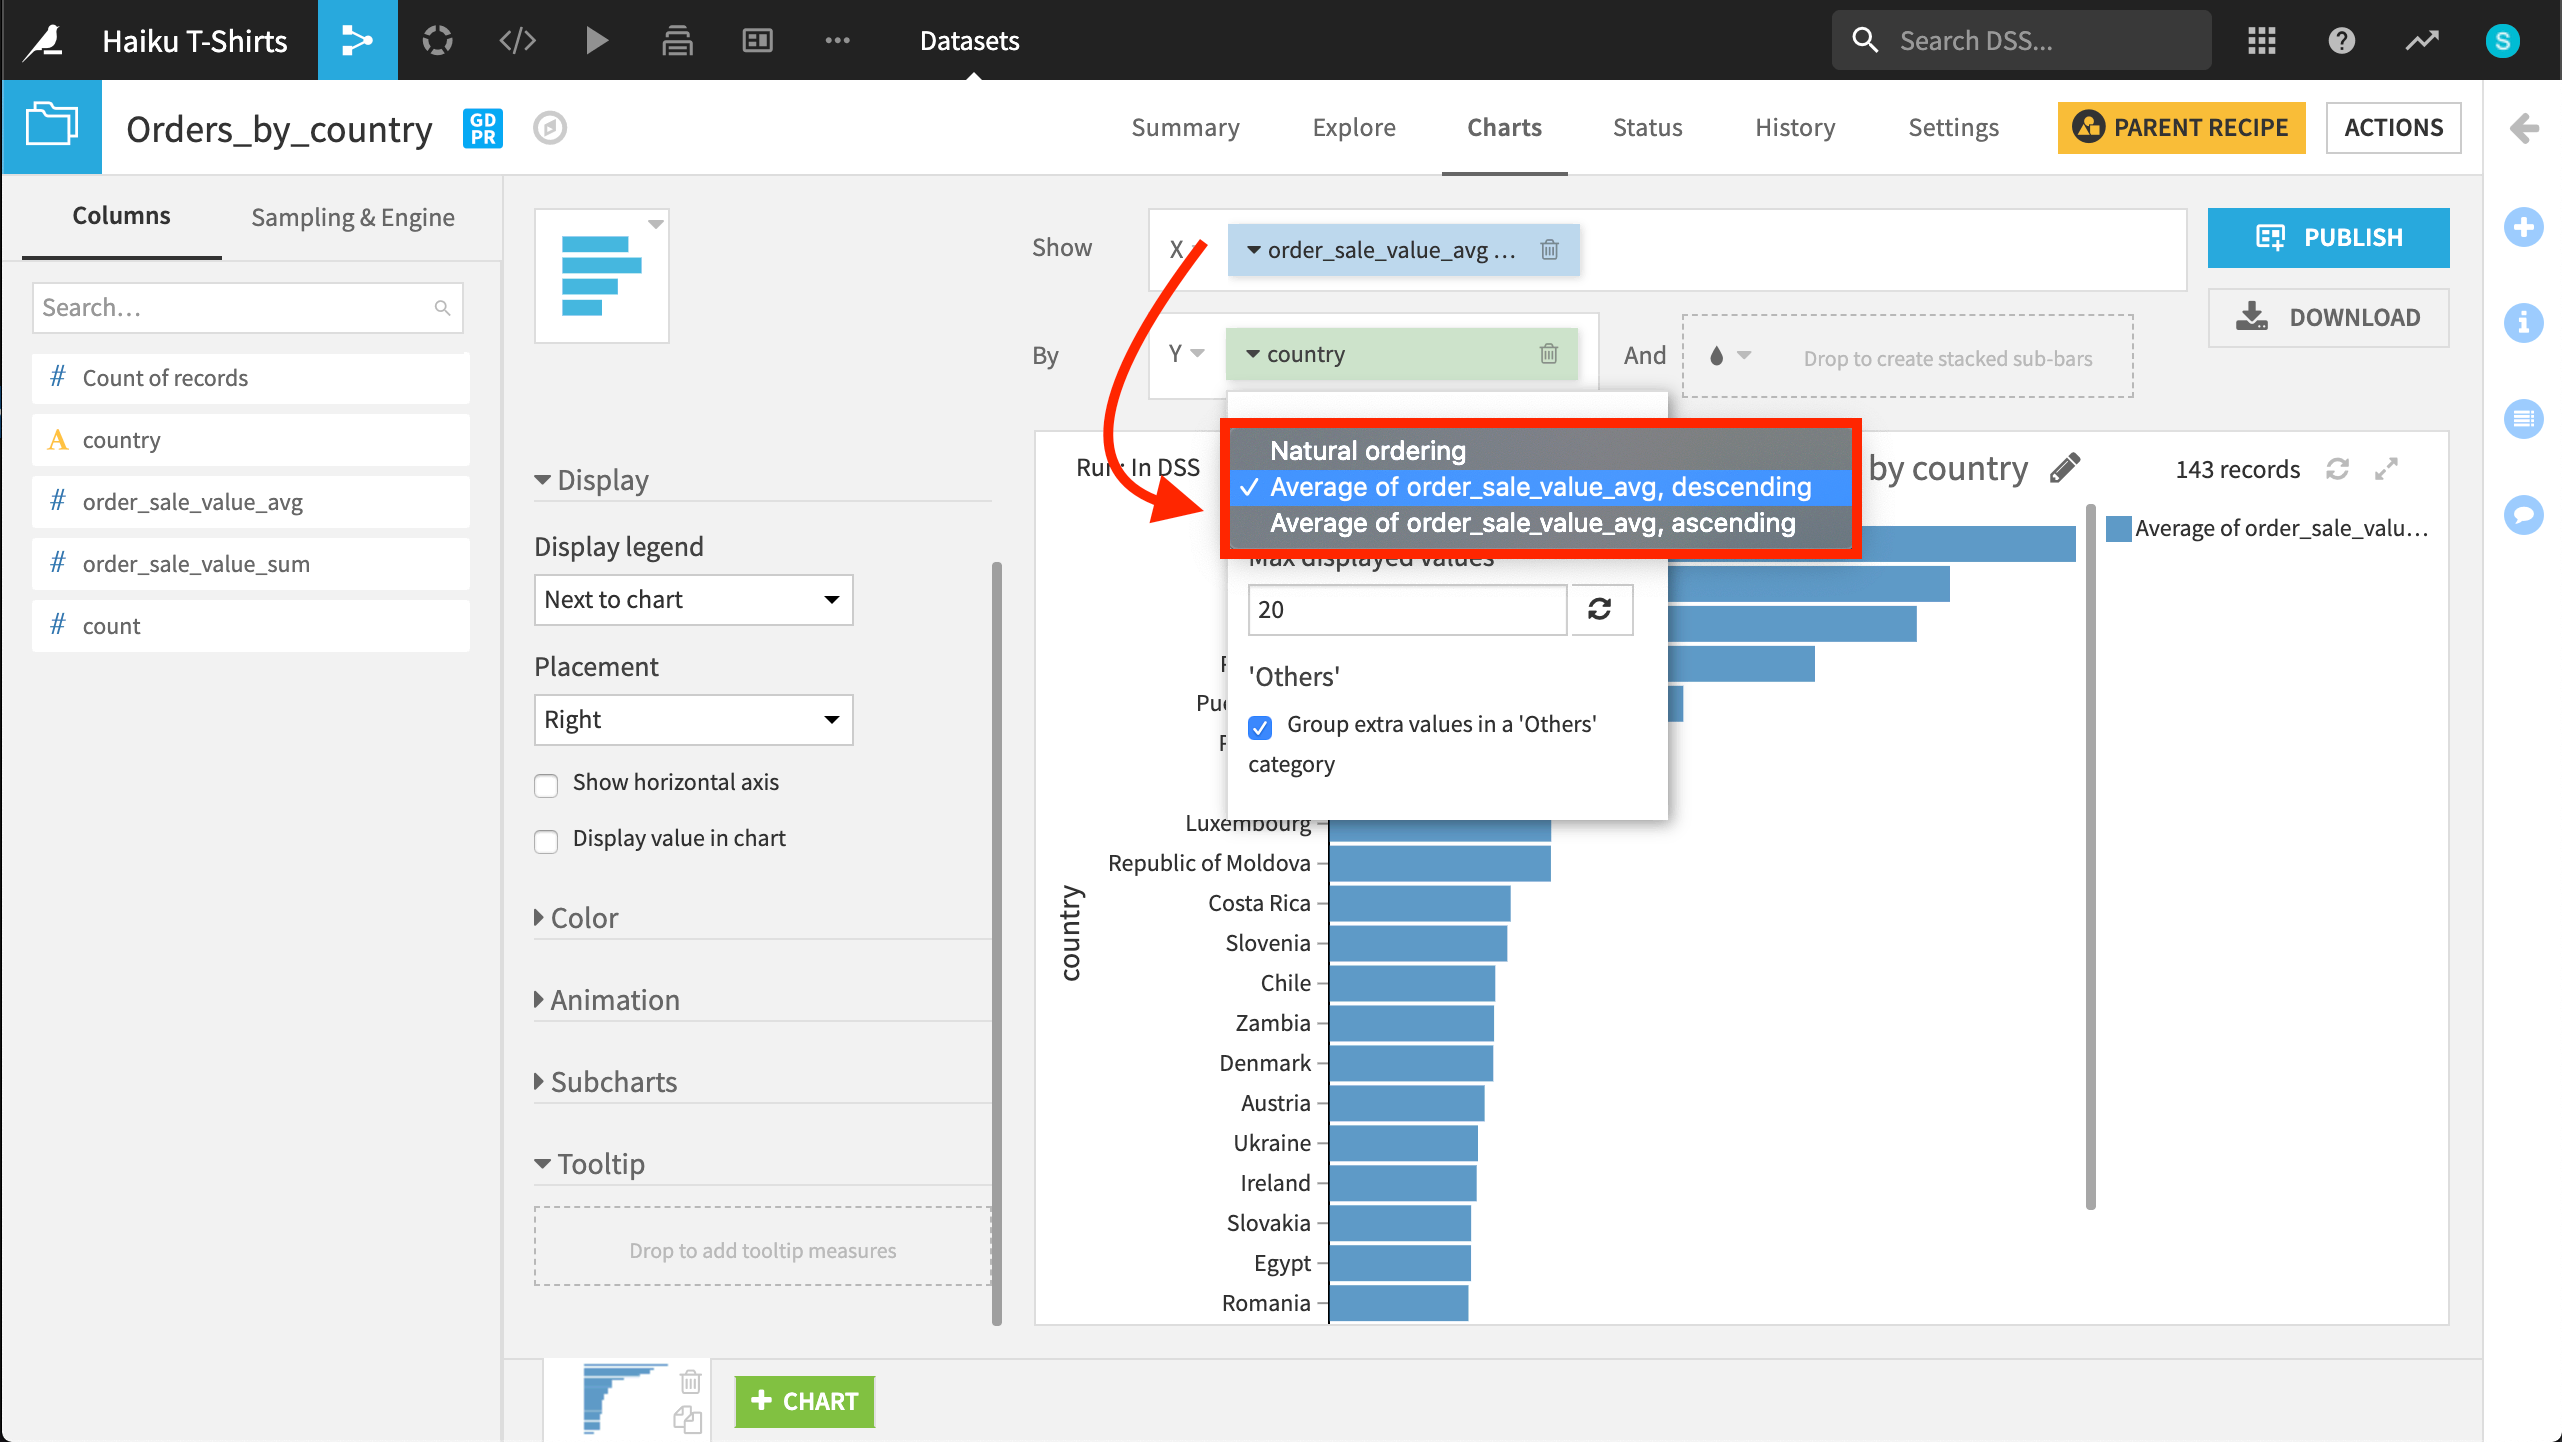
For example, in the chart below, you can sort values on three measures: natural ordering and the ascending or descending average of the X variable.
However, in the same chart below, a Tooltip variable has been added. Now, you can sort the values in the Chart on five measures: the previous three and the ascending and descending average of the new Tooltip variable.