Reshaping Data from Long to Wide Format
Pivoting values, sometimes called unstacking, is the action of reshaping a dataset from long format to wide format.
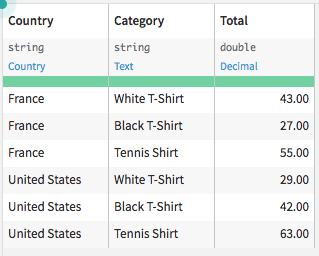
Suppose we have a dataset that contains an aggregated order log from a retail company, and each row represents the total orders per country, per type of item sold.
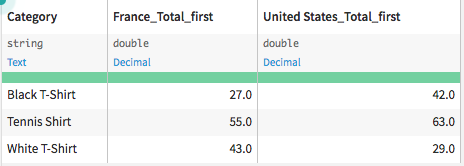
If we want to examine the amount spent on each item, across countries, we could reorganize the dataset by pivoting the values as follows:
This tutorial demonstrates how to reshape a dataset from long (sometimes called narrow) to wide format using the Pivot recipe. For completeness, it will also show how to return a dataset from wide to long format using the Prepare recipe.
Prerequisites
We’ll work with the Haiku T-shirt company’s Orders_by_Country_Category dataset, which can be found by selecting +New Project > DSS Tutorials > General Topics > Haiku Starter. Alternatively, you can download and import this dataset alone into a new project.
Note
You can also download the starter project from this website and import it as a zip file.
Note
If you import your own CSV file, you will need to initiate a Prepare recipe so Dataiku DSS can interpret data storage types. Be sure to have total_sum stored as double, rather than string before beginning.
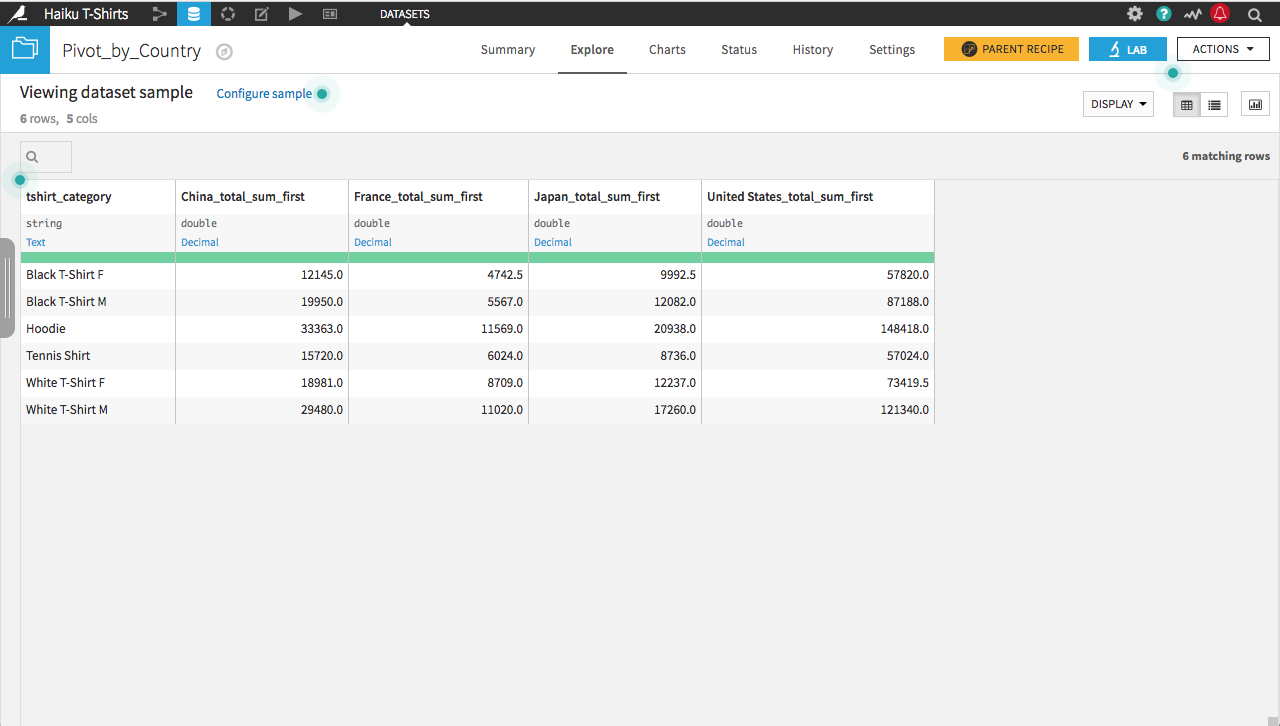
The original dataset contains a separate row per country, per t-shirt category.
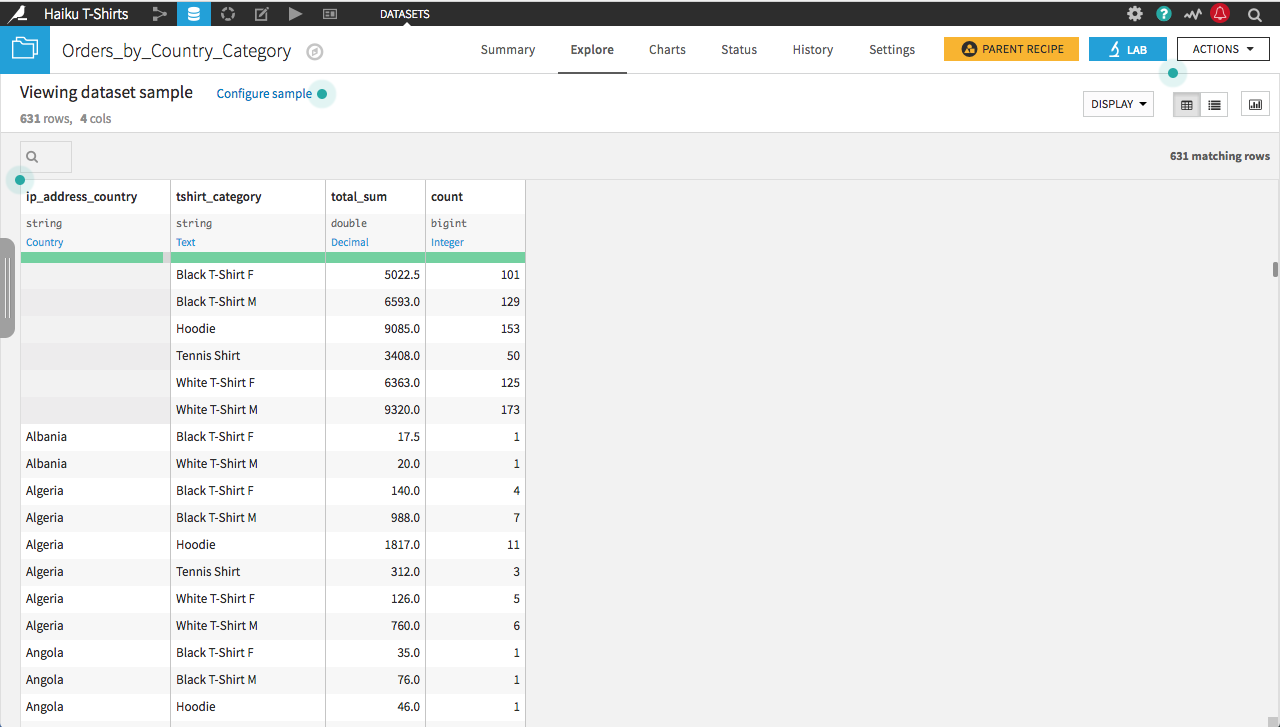
We are interested in examining how sales of categories of shirts compare across countries; however, the current long-form dataset is hard to read for this purpose. Instead, we want to pivot the dataset on the country, so that each row corresponds to a different t-shirt category, and each column records the amount spent in each country.
Pivoting Values
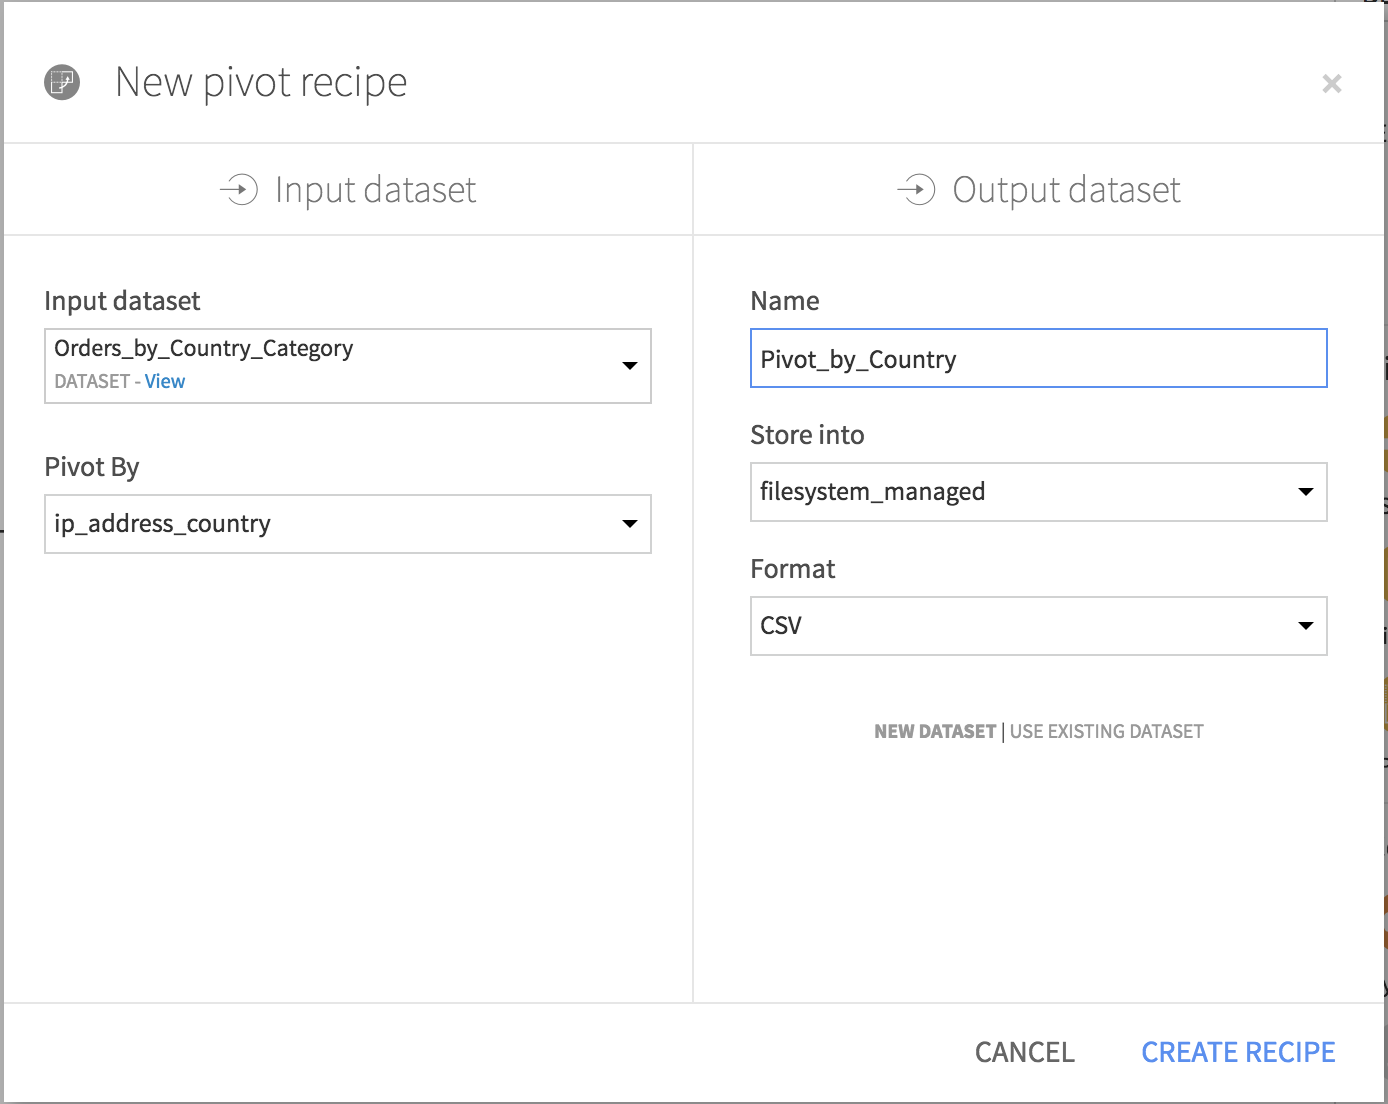
From the Actions menu of the Orders_by_Country_Category dataset, choose Pivot. Choose ip_address_country as the column to pivot by. Give the output dataset a descriptive name like Pivot_by_Country and click Create Recipe.
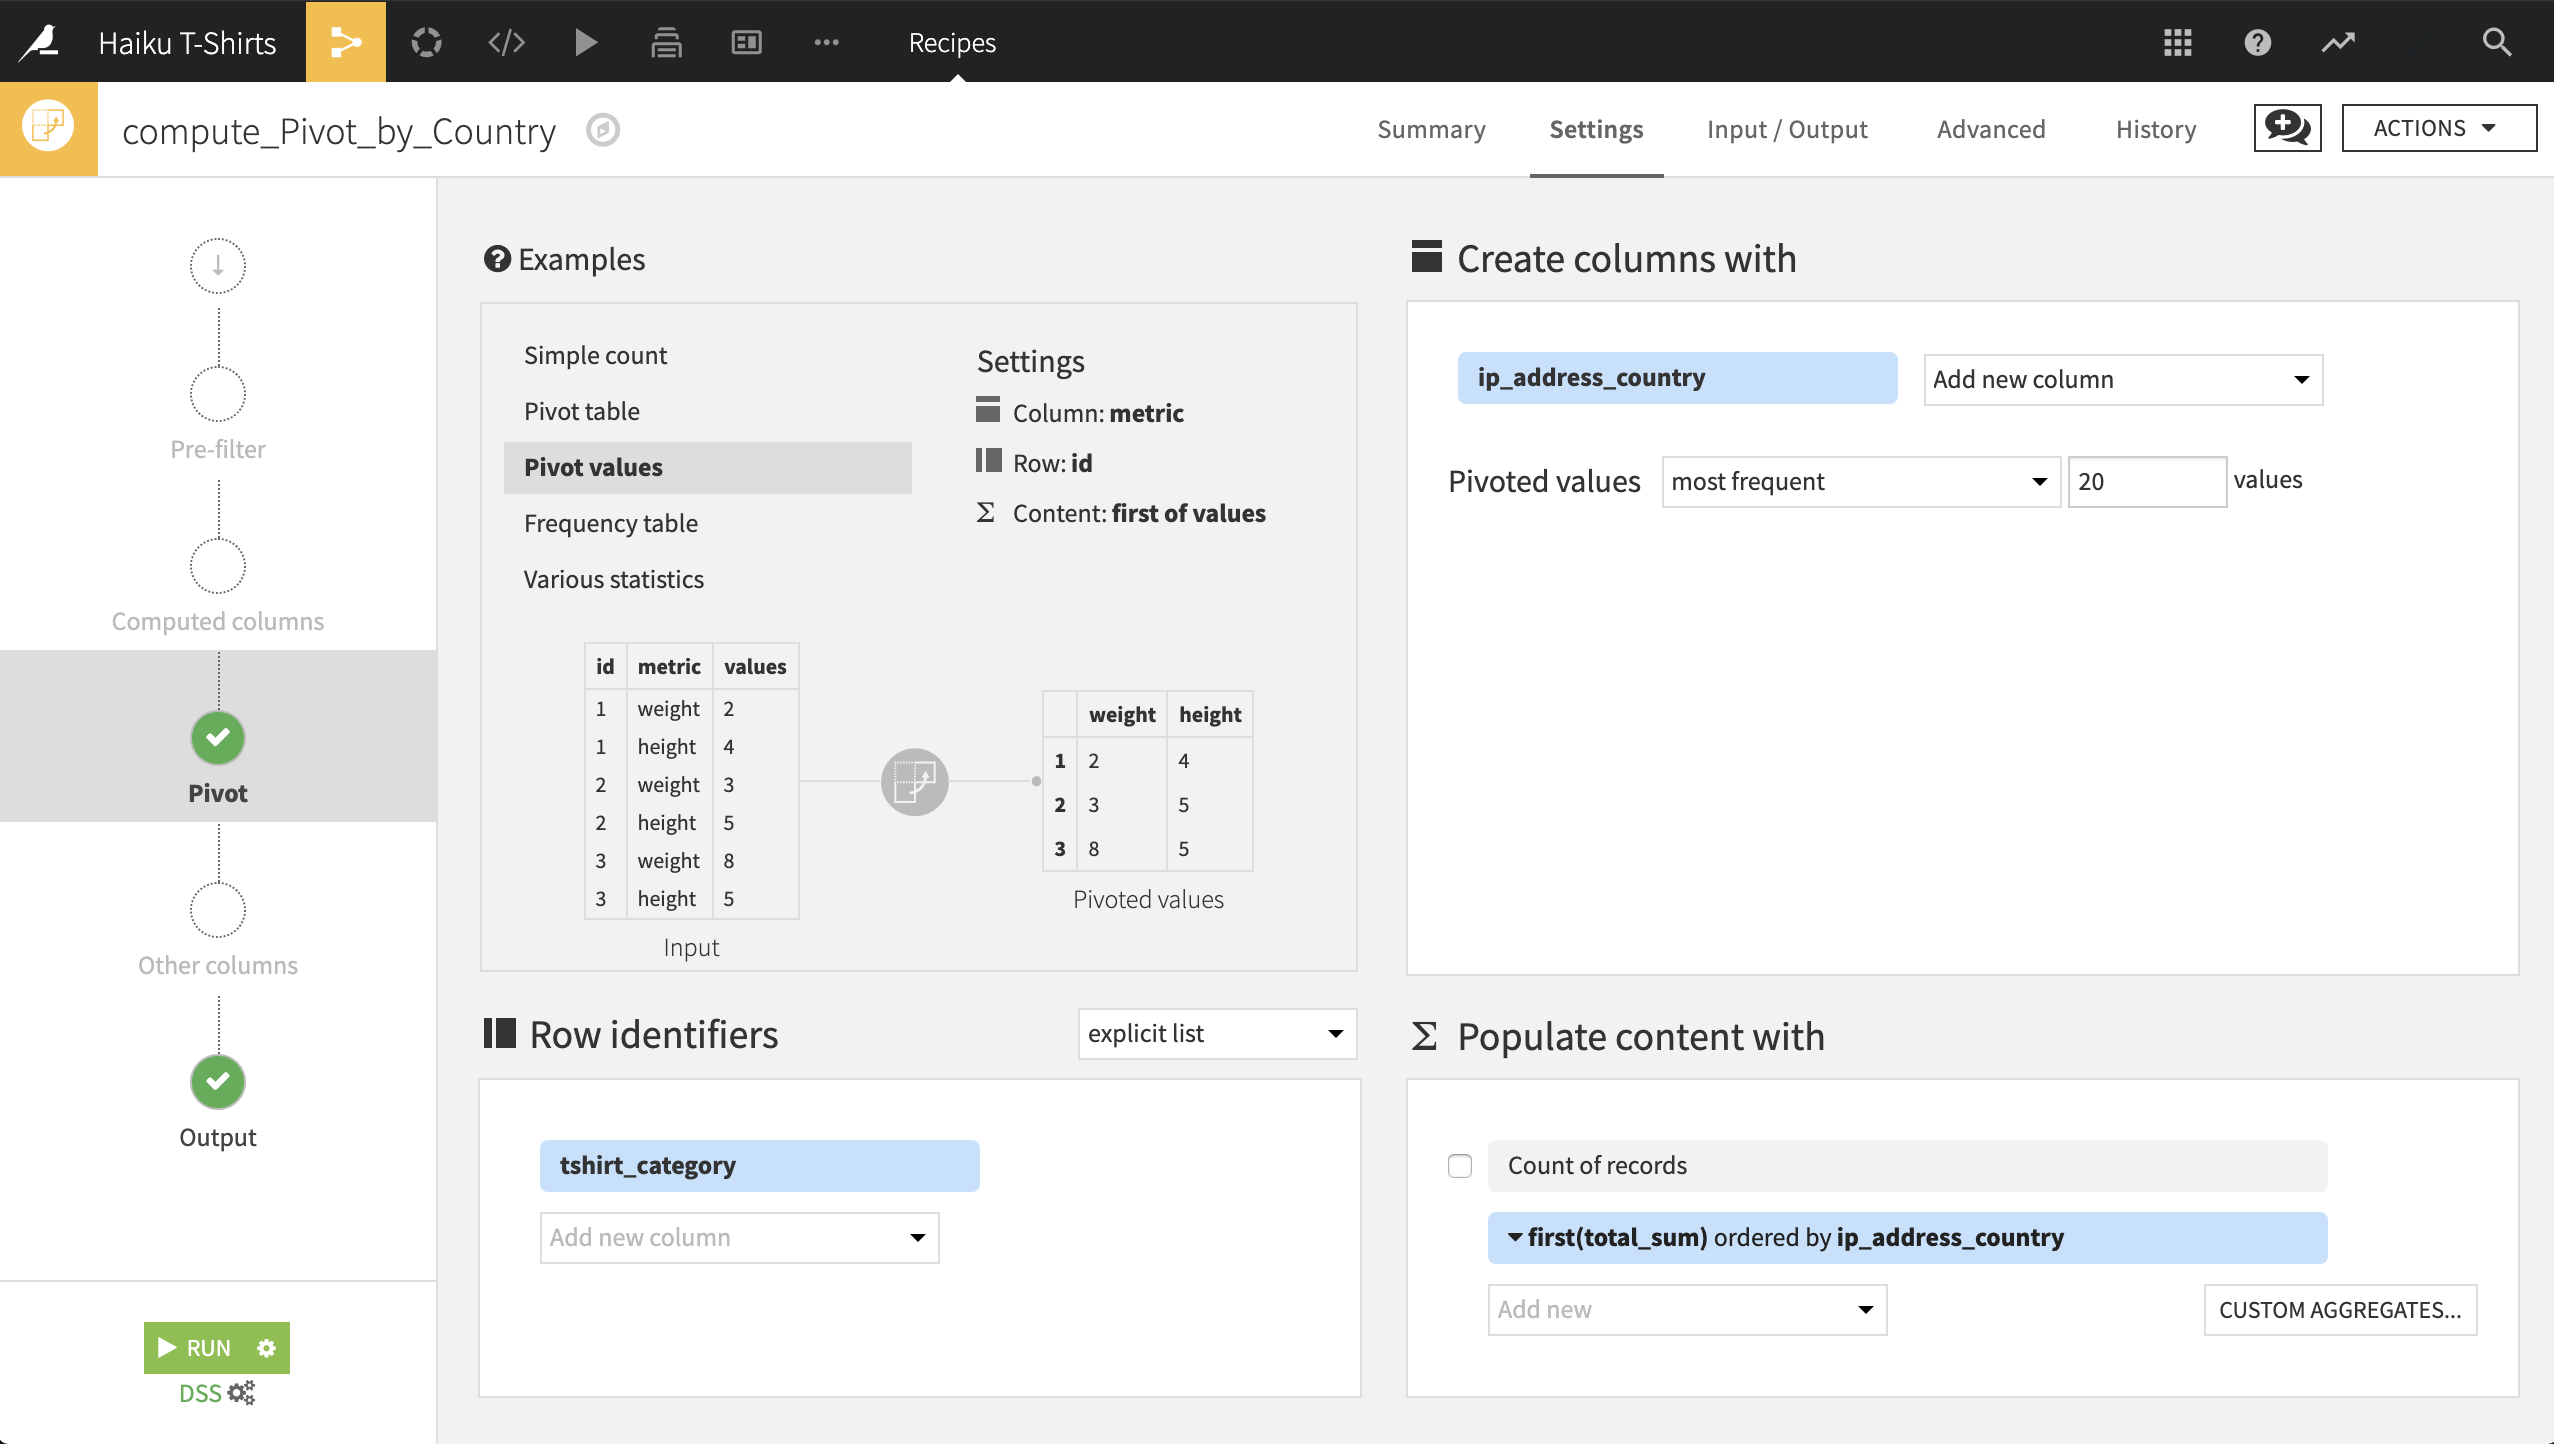
In the Pivot recipe:
The Create columns with field is already populated by ip_address_country. For each distinct value of this column, the Pivot recipe will create a new column for each statistic specified in the Populate content with section. By default, only the 20 most frequently occurring values are pivoted.
Select tshirt_category as the Row identifier. The output dataset will have a single row for each category of t-shirt.
Choose to populate content with total_sum. By default it selects the count of total_sum; change the aggregate to first. Since each combination of country and t-shirt category is unique, it shouldn’t matter whether you use the first, last, min, max, sum, or average as the aggregation method. Deselect Count of records.
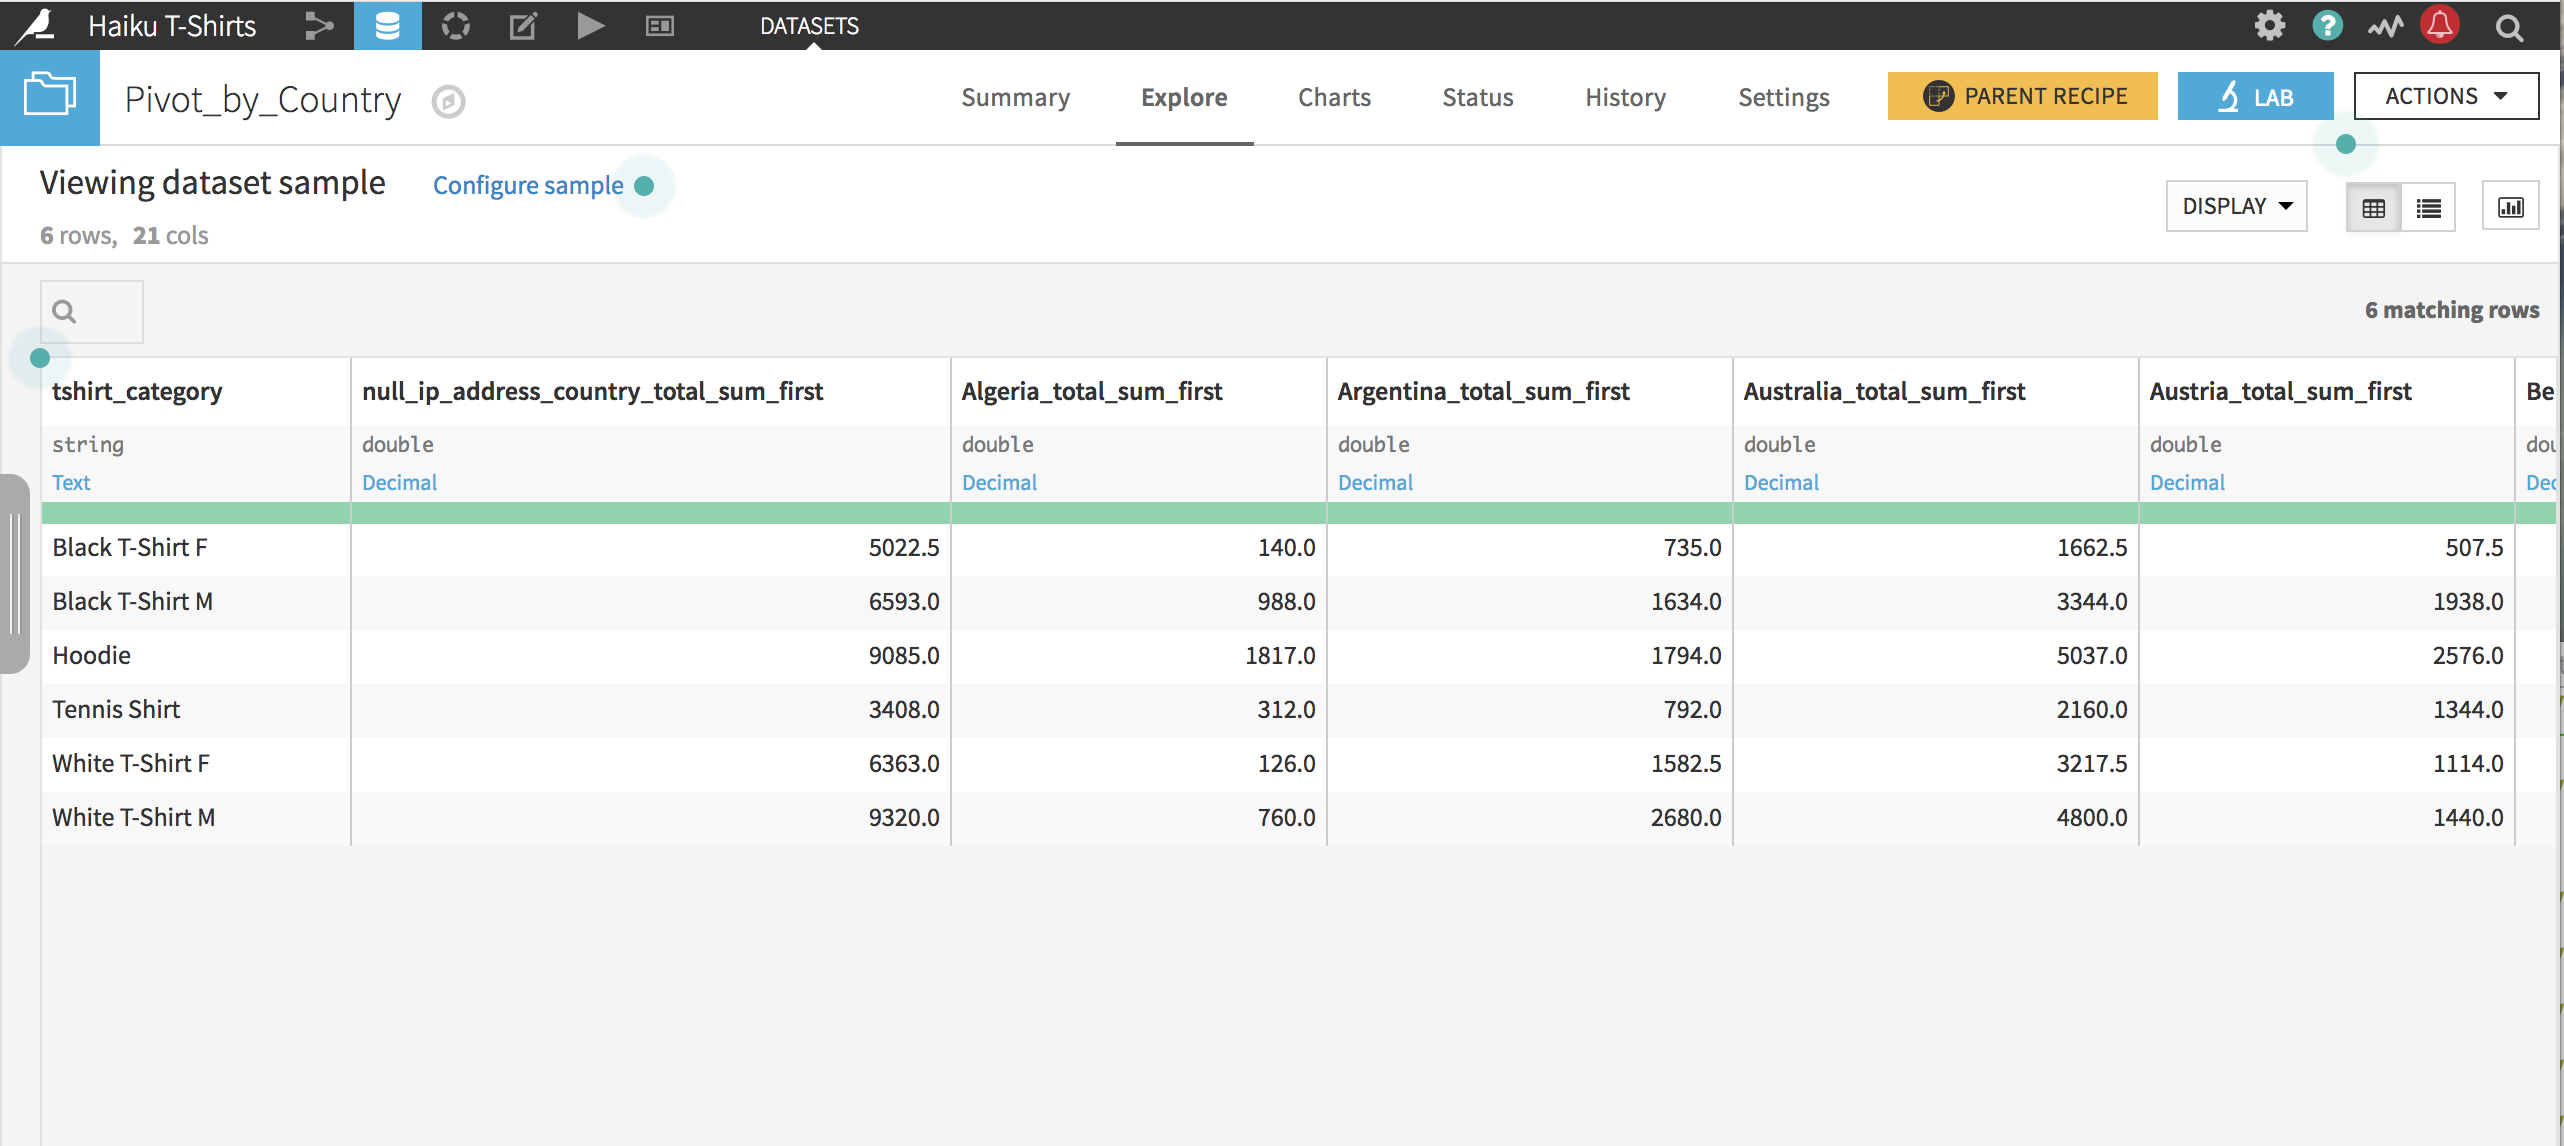
After clicking Run, the resulting dataset is ready to go. Note that because all categories of shirts have been sold in many countries, more than 20 countries are the “most frequently occurring”, and the Pivot recipe chooses 20 from among the ties.
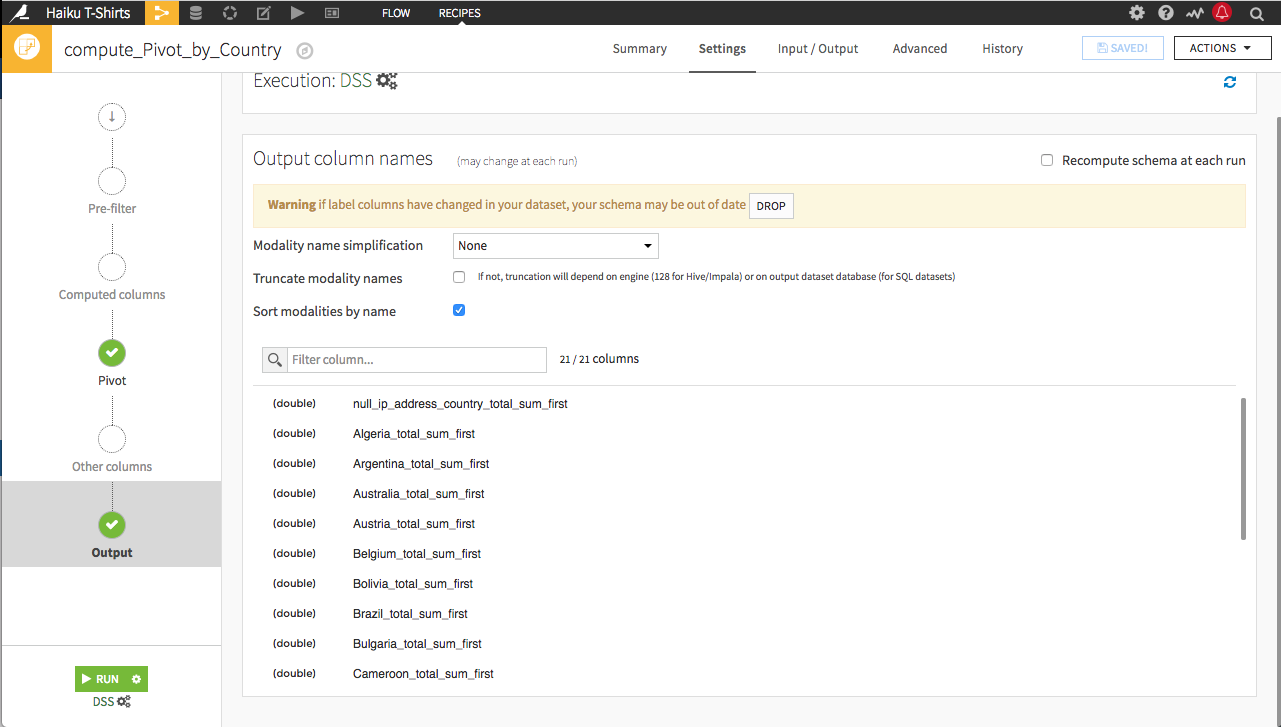
What Happens When New Data Is Added
Unlike most other recipes, the schema of the output dataset of a Pivot recipe is affected by the values of the input dataset. In this case, the number of columns in the output dataset was determined by the fact that there are more than 20 countries, so the number of columns is limited to the 20 most frequent. But what happens as new orders come in? Let’s go back to the Output step of the Pivot recipe.
The Pivot recipe is a two-pass algorithm that determines the values to pivot on in the first pass in order to construct the schema of the output dataset, and then uses the second pass to do the pivot.
Warning
If there are a lot of unique values in the column to pivot by, the number of columns in the output dataset can grow out of control, so take care to Analyze the column to pivot by and choose the number of values to pivot carefully. By default, the maximum number of columns created by the Pivot recipe is 200.
The schema of the output dataset was established the first time we ran the Pivot recipe. Rebuilding the dataset continues to use the same schema, performing a single pass on the input of the Pivot recipe–and ignoring any changes to which 20 countries are the most frequently occurring, unless we update the schema. There are two options for updating the schema:
You can manually drop the existing schema by clicking the Drop button and
You can select Recompute schema at each run and it will automatically update every time the Pivot_by_Country dataset is built. The danger in this method is that a changed schema can break the flow if there are recipes that expect the old schema.
If there are particular countries that we want to examine, we can provide an explicit list to the Pivot recipe.
Choosing the Values to Pivot
Let’s go back to the Pivot step of the Pivot recipe. We can specify the list of values we want to pivot by selecting explicit list from the pivoted values dropdown, and then using +Add Value to add each individual value. Alternatively, if we want to include most of the column’s values, we can use +Values from Dataset and then remove the undesired values from the list.
Use the first method to add China, France, Japan, and the United States.
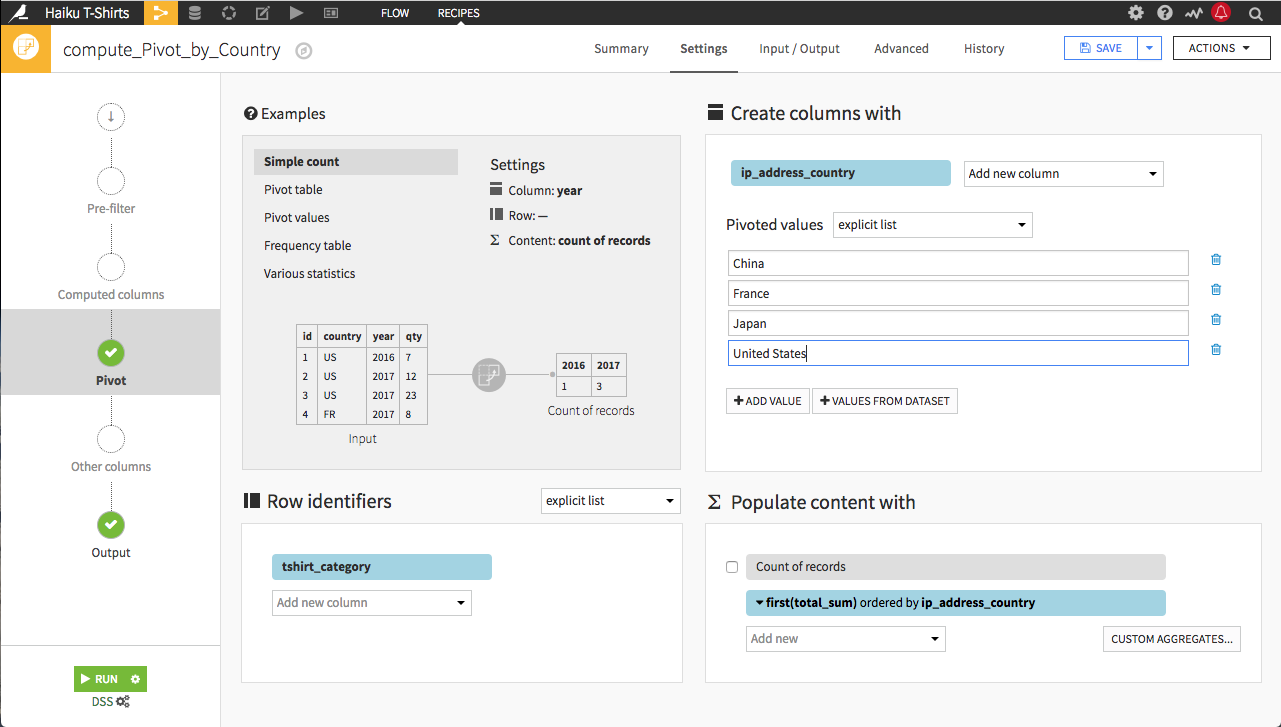
Click Run, and the resulting dataset has the number of pivoted columns limited to those explicitly listed in the Pivot recipe. By providing an explicit list, the schema of the output dataset is also determined in advance, and only a single data pass is required to do the pivot.
Reshaping Data from Wide to Long Format
The data was initially in long format, and we used the pivot recipe to reshape it into wide format. Dataiku makes recovering the long format simple; we only need to look to the Flow to find the original. However, if initially presented with data in a wide format, we should also know how to “unpivot” the data from wide to long format.
From the Flow, copy the compute_Pivot_by_Country recipe. Name the output dataset Pivot_by_All_Countries. Instead of an explicit list, select “all” as the pivoted values so columns will be produced for all countries. Running the recipe should produce an output dataset of 6 rows and 142 columns. This is the entire dataset in a wide format.
From this output dataset, start a Prepare recipe. Two options in the Processors Library can assist in this transformation: “Fold multiple columns” or “Fold multiple columns by pattern”. Because the names of the columns we want to gather follow a regular pattern, we can use the latter.
Note
The reference documentation for the Fold multiple columns by pattern processor can be found here.
Use “(.*)_total_sum_first” as the Columns to fold pattern, ip_address_country as the Column for fold name, and total_sum as the Column for fold value. Be sure to remove folded columns.
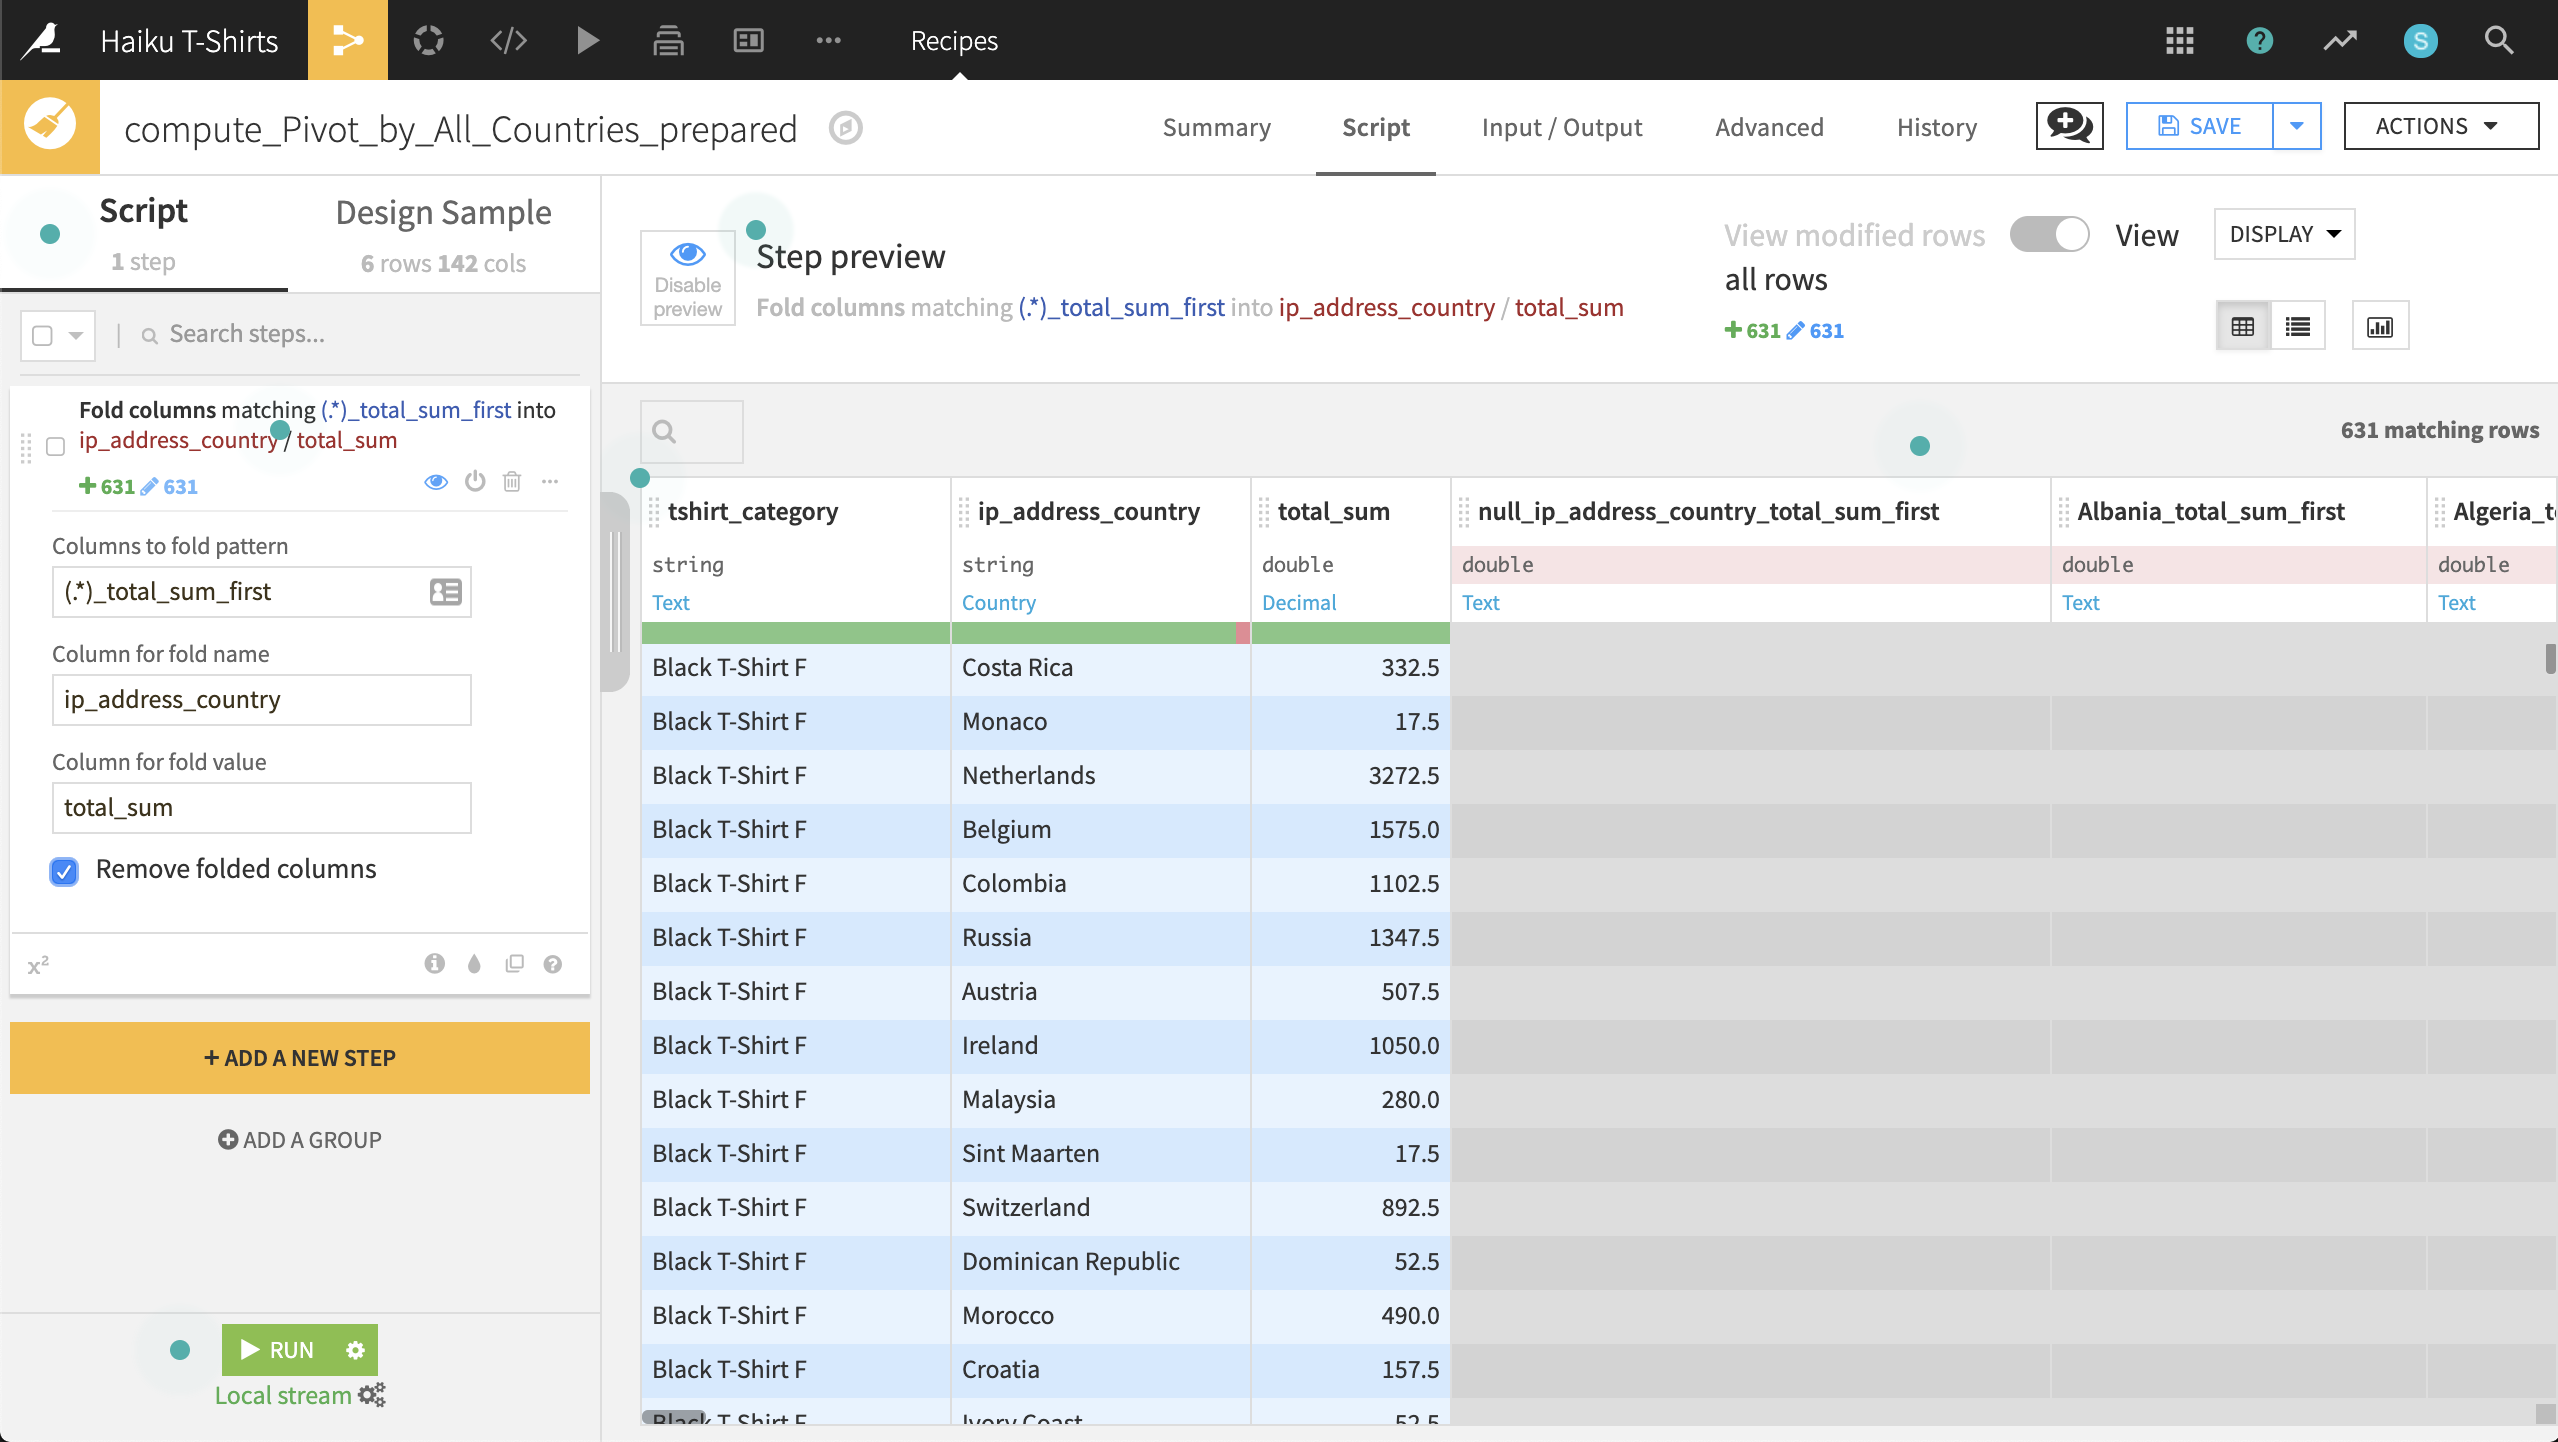
Running this recipe produces an output dataset in long format with the original number of rows. A Sort recipe could be used to recover the original order of rows, if necessary.
What’s Next
You can examine a completed version of this Pivot recipe on the Dataiku gallery.
The Pivot recipe can also be used to create pivot tables. Pivot tables are similar to pivoting values, but populates the pivoted columns with aggregated, rather than individual, values.