Hands-On: Analyze Effects of Dimensionality Reduction
Note
This lesson is a continuation of the Interactive Visual Statistics hands-on tutorial.
When working with a dataset having many variables, we may be interested in analyzing the effects of using a reduced number of variables (or dimensions) of the data. For example, we may choose to explore the structure of the winequality dataset in two dimensions.
Dataiku DSS enables you to analyze the effects of dimensionality reduction using a feature extraction method called Principal Component Analysis, or PCA.
Perform PCA
Let’s use the Principal Component Analysis card to represent the winequality dataset in two dimensions.
Click the New Card button from the “Worksheet” header, and then select Principal Component Analysis.
Select the 11 numerical variables to add to the “Variables” column.
Click Create Card to create the card.
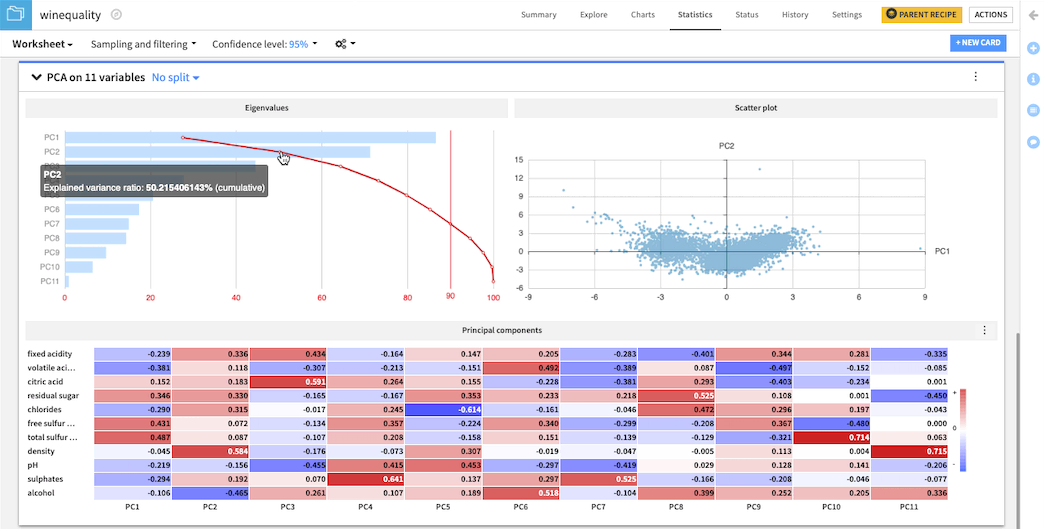
The scree plot in the PCA card shows that using only the first two principal components retains about 50.2% of the variance in the dataset. To retain a variance of at least 90% (the red vertical line), you must use a minimum of 7 principal components to represent the data.
The 2D scatter plot to the right shows the data projected onto the first two principal components.
Finally, the heatmap shows a matrix of the principal component loading vectors. As an example, the first column of the matrix corresponds to the loading vector of PC1, that is, a vector of the coefficients used in the linear transformation of the data set to the first principal component dimension.
For more information about the PCA card, see Principal Component Analysis (PCA) in the knowledge base.