RFM-Enriched Customer Lifetime Value
Overview
Business Case
Digital investments have been following a tremendous rise over the past decade. In the US, digital ad spending is now twice as much as traditional media ad spending. For brands, there is no doubt that digital is the go-to advertising space. However, it has become more and more difficult to optimize marketing spending, while maintaining trust with consumers.
Customer engagement teams are left with the question - which customers should a brand invest in? Knowing who your most valuable customers are, what their potential future spending amounts to, and how they engage with your brand is critical. Additionally, addressing customer segments based on their projected lifetime value is a huge opportunity to optimize marketing spending and build long-lasting relationships with valuable customers.
The lifetime value of a customer (CLV) is the potential “value” that an existing customer will be able to generate within a given time horizon. Predicting CLV can help a company better understand the buying profile of their customers, and help them value their business more accurately.
This template project solution’s main goal is to predict the CLV in a given future time horizon for existing customers who have a known transaction history via a full end-to-end pipeline.
Technical Requirements
To leverage this solution, you must meet the following requirements:
Have access to a DSS 9.0+ instance.
A Python 3.6 code environment named
solution_rfm-clvwith the following required packages:
scikit-learn==0.22
lifetimes==0.11.1
Note
Dataiku Online instances will auto-install these requirements when the Solution is created.
Installation
This solution is available to install on Dataiku and Dataiku Online instances.
Installing on your Dataiku Instance
If the technical requirements are met, this solution can be installed in one of two ways:
On your Dataiku instance click + New Project > Industry solutions > Retail > RFM-Enriched Customer Lifetime Value.
Download the .zip project file and upload it directly to your Dataiku instance as a new project.
Note
If running a DSS 9 instance, the solution is found by navigating to + New Project > Sample projects > Solutions > RFM-Enriched Customer Lifetime Value
Installing on a Dataiku Online Instance
Dataiku Online customers can add this Solution to their managed instance from the Launchpad: Features > Add A Feature > Extensions > RFM-Enriched CLV
Data Requirements
While the project should be used as a template to build your own analysis of customer lifetime value, you can change the input dataset to your own data, and run the Flow as-is. The data initially available in this project was provided by Kaggle, and it contains actual transactions from a UK retailer.
The project has a mandatory input dataset transactions_dataset to run in which there is one row per transaction. Additionally, the transactions_dataset should contain at least these 4 columns:
TransactionID: each transaction ID represented as string values
CustomerID: Customer ID associated with each transaction represented as string values
Date: Corresponding date for each transaction represented as string values and formatted as ‘%Y-%m-%d %H:%M:%S’
TotalPrice: Total price of the transaction as a double value
In addition to the input dataset, there are three project variables that should be updated to your specific interests in the project settings before building the Flow:
threshold_date: date formatted as ‘YYYY-MM-DD’ that serves as the point of reference date to look at purchases prior to or after.lookback_window: an integer representing the number of months prior to the threshold date that transactions in the input dataset should be filtered by.forward_window: an integer representing the number of months after the threshold date that transactions in the input dataset should be filtered by.
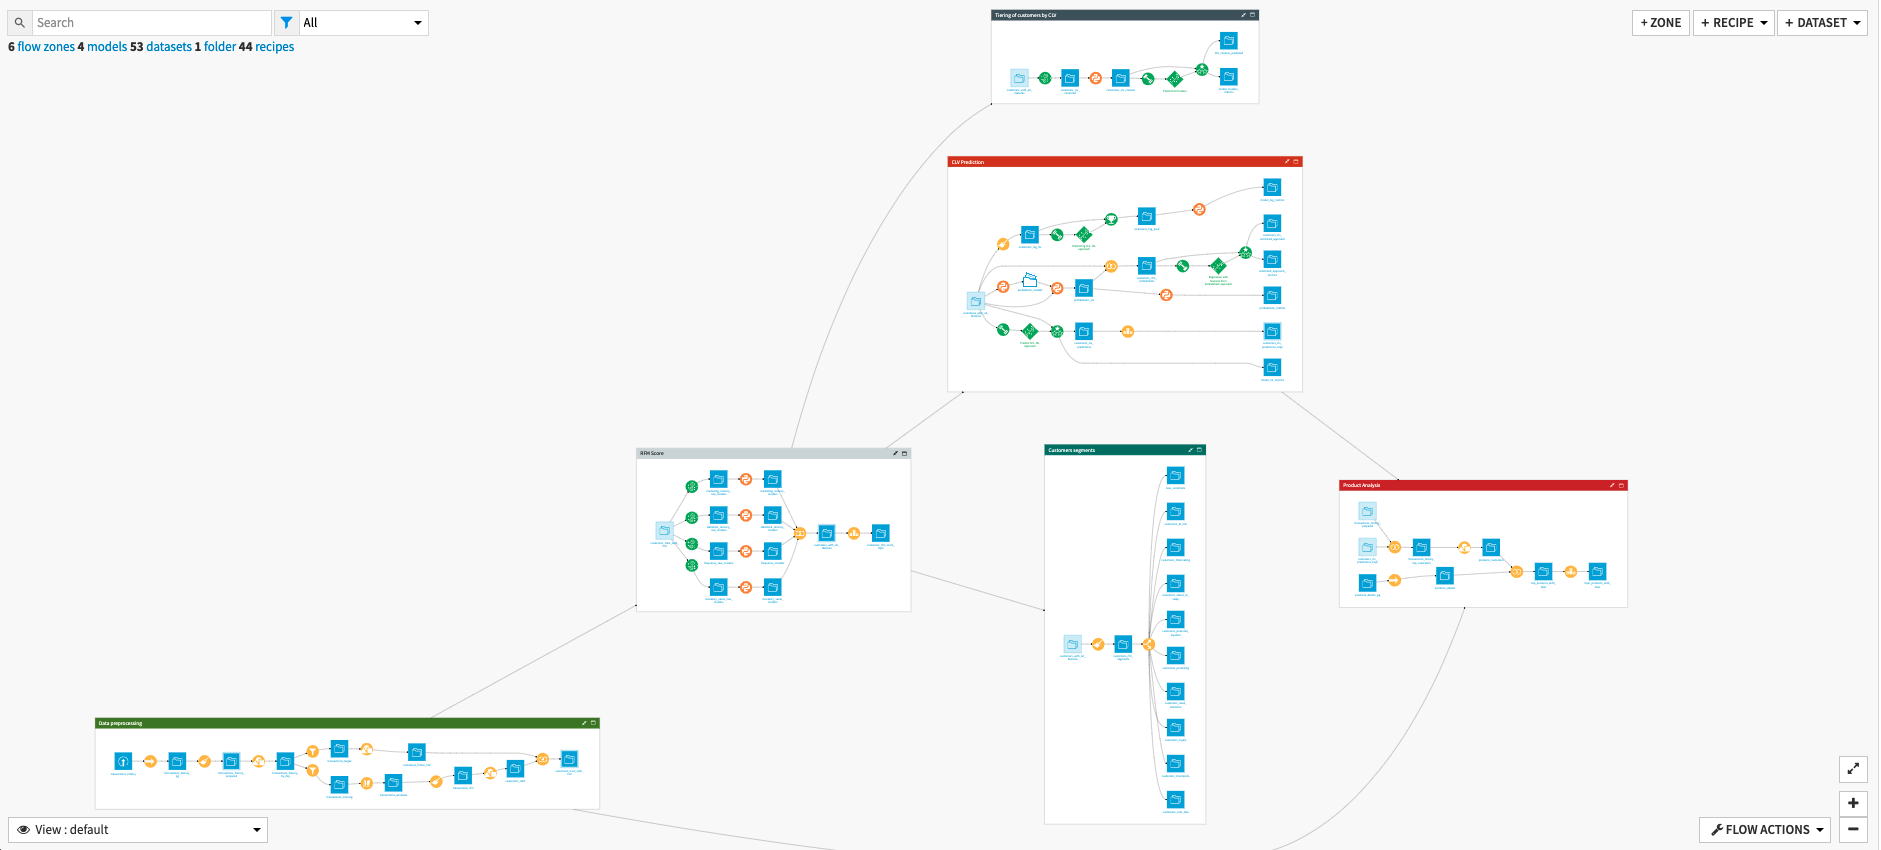
Workflow Overview
You can follow along with the solution in the Dataiku gallery.
Note
This project is meant to be used as a template to guide the development of your own analysis in DSS. The results of the models should not be used as actionable insights and the data provided with the project may not be representative of actual data in a real-life project.
The project has the following high-level steps:
Process the transactions data
Calculate an RFM score per customer
Predict Customer Lifetime Value
Segment and classify customers to identify actionable insights
Analyze products bought by high-value customers
Visualize and interpret our analyses
Walkthrough
Note
In-depth technical details can be found in the wiki of the project.
Identifying Customer Value in Past Transactions
Within this zone, our transactional data is taken as an input and initially cleaned and aggregated. Cleaning of the dataset removes rows without an associated Customer ID, dates are parsed, and we identify if a transaction is a new purchase or return of an item. Data is then aggregated by the customer and by date. In the event that there are multiple transactions by the same customer on the same date, only one row is recorded for that customer.
Now that our data is cleaned and properly aggregated, we can calculate the target value of this solution - CLV. This calculation is executed by filtering the data between the lookback_window and the threshold_date (past value), and the threshold_date and forward_window (future value). The CLV score is the sum of the money spent per customer for all past transactions (calculated in the Flow via the computer_customers_future_CLV group recipe).
Even though we have not yet predicted the CLV of our customers, there is still value in the CLV score generated from their past transactions. This score can enable retail analysts to perform early identification of high-value customers for targeted marketing campaigns, and, with the addition of geographical and/or socio-economic data, identify high-value regions in their distribution network. Additionally, it helps us set a baseline of our existing customer value against which we can compare the success of future interventions.
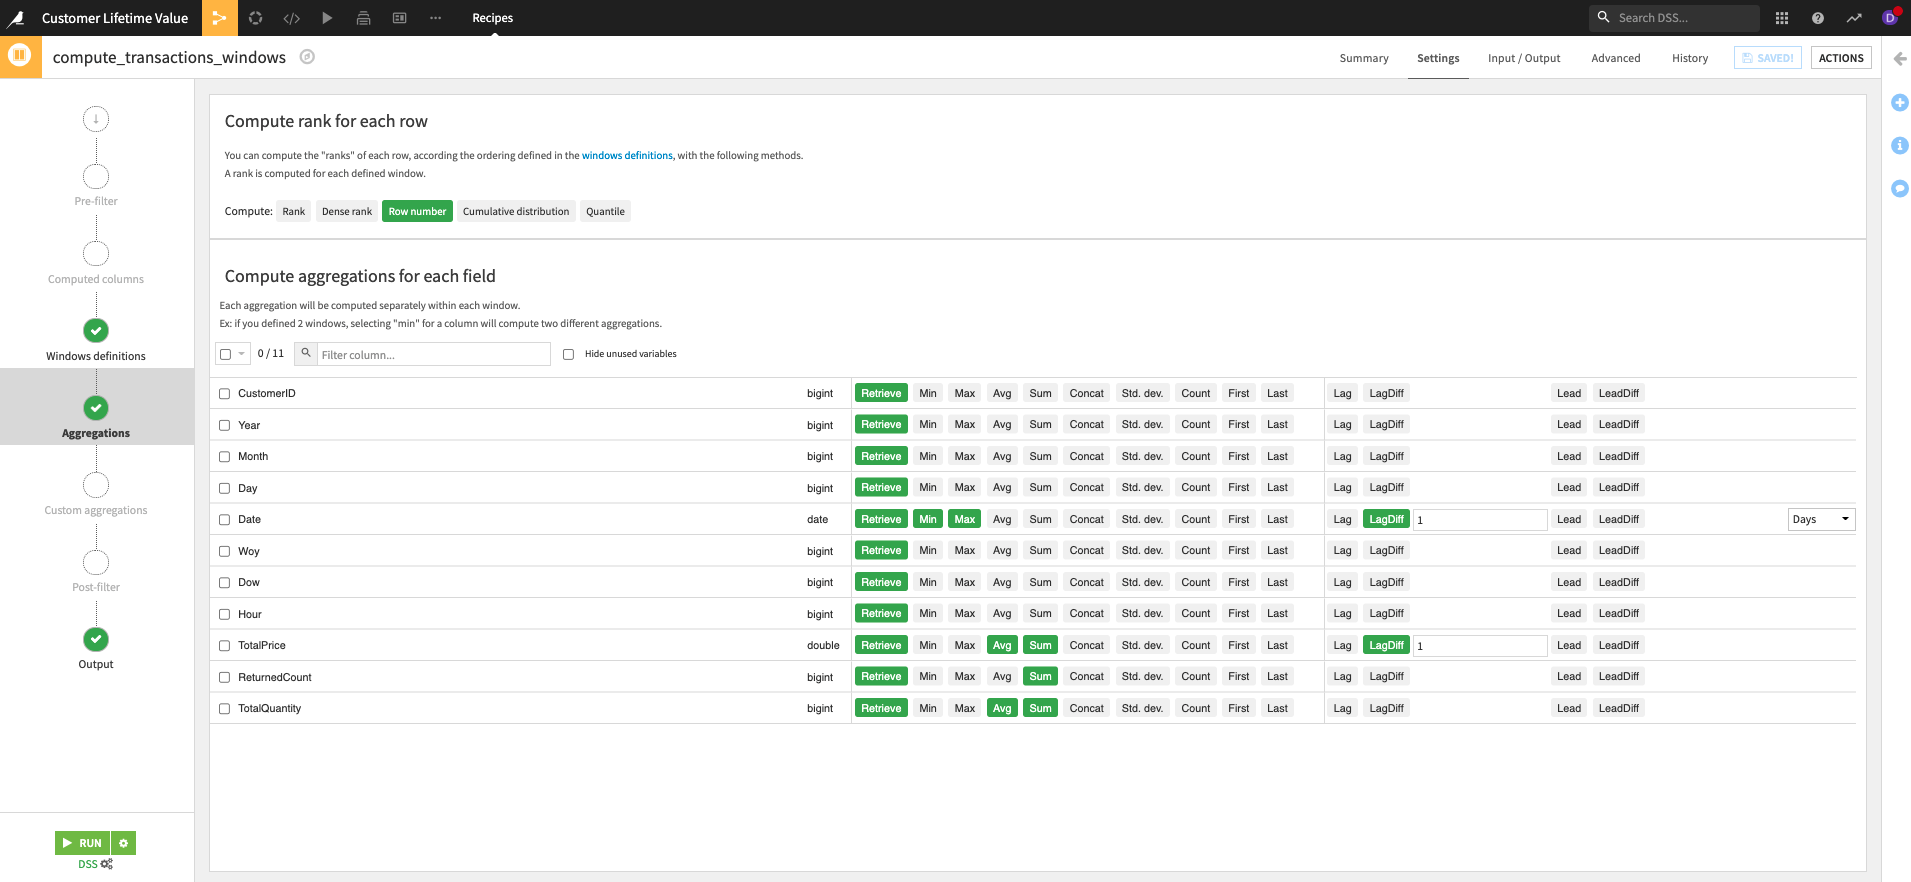
In order to predict CLV, we also need to calculate features from our past transactions in this part of the Flow. To do so, dates are once again filtered with the same window of dates as above and aggregation on price returns, total quantity, and date is executed. These aggregations can also be used to calculate RFM scores and are thus joined with the CLV scores to output a training dataset containing customers, various features to predict their value, and their CLV score calculated on past transactions.
Assessing Customer Behavior - RFM Scores
This solution includes the enrichment of CLV with RFM scores and is done so by taking the previously identified RFM features from our transaction data:
Recency - Computed by calculating the days between a customer’s first and last orders.
Frequency - Calculated by first determining the number of days on which a customer made purchases. We then subtract the count of those days by 1.
Monetary - Calculated as the average spend of a customer.
MarketingRecency - The duration between a customer’s latest purchase and the
threshold_date.
Within this Flow zone, we train 4 K-Means clustering algorithms on each isolated variable. The resulting clusters are ordered according to the initial variable to turn clusters into scores. The scores are summed together in order to compute two RFM scores:
The RFM score represents the sum of the frequency, monetary value, and recency for a customer.
The Marketing RFM score represents the sum of the frequency, monetary value, and Marketing recency for a customer.
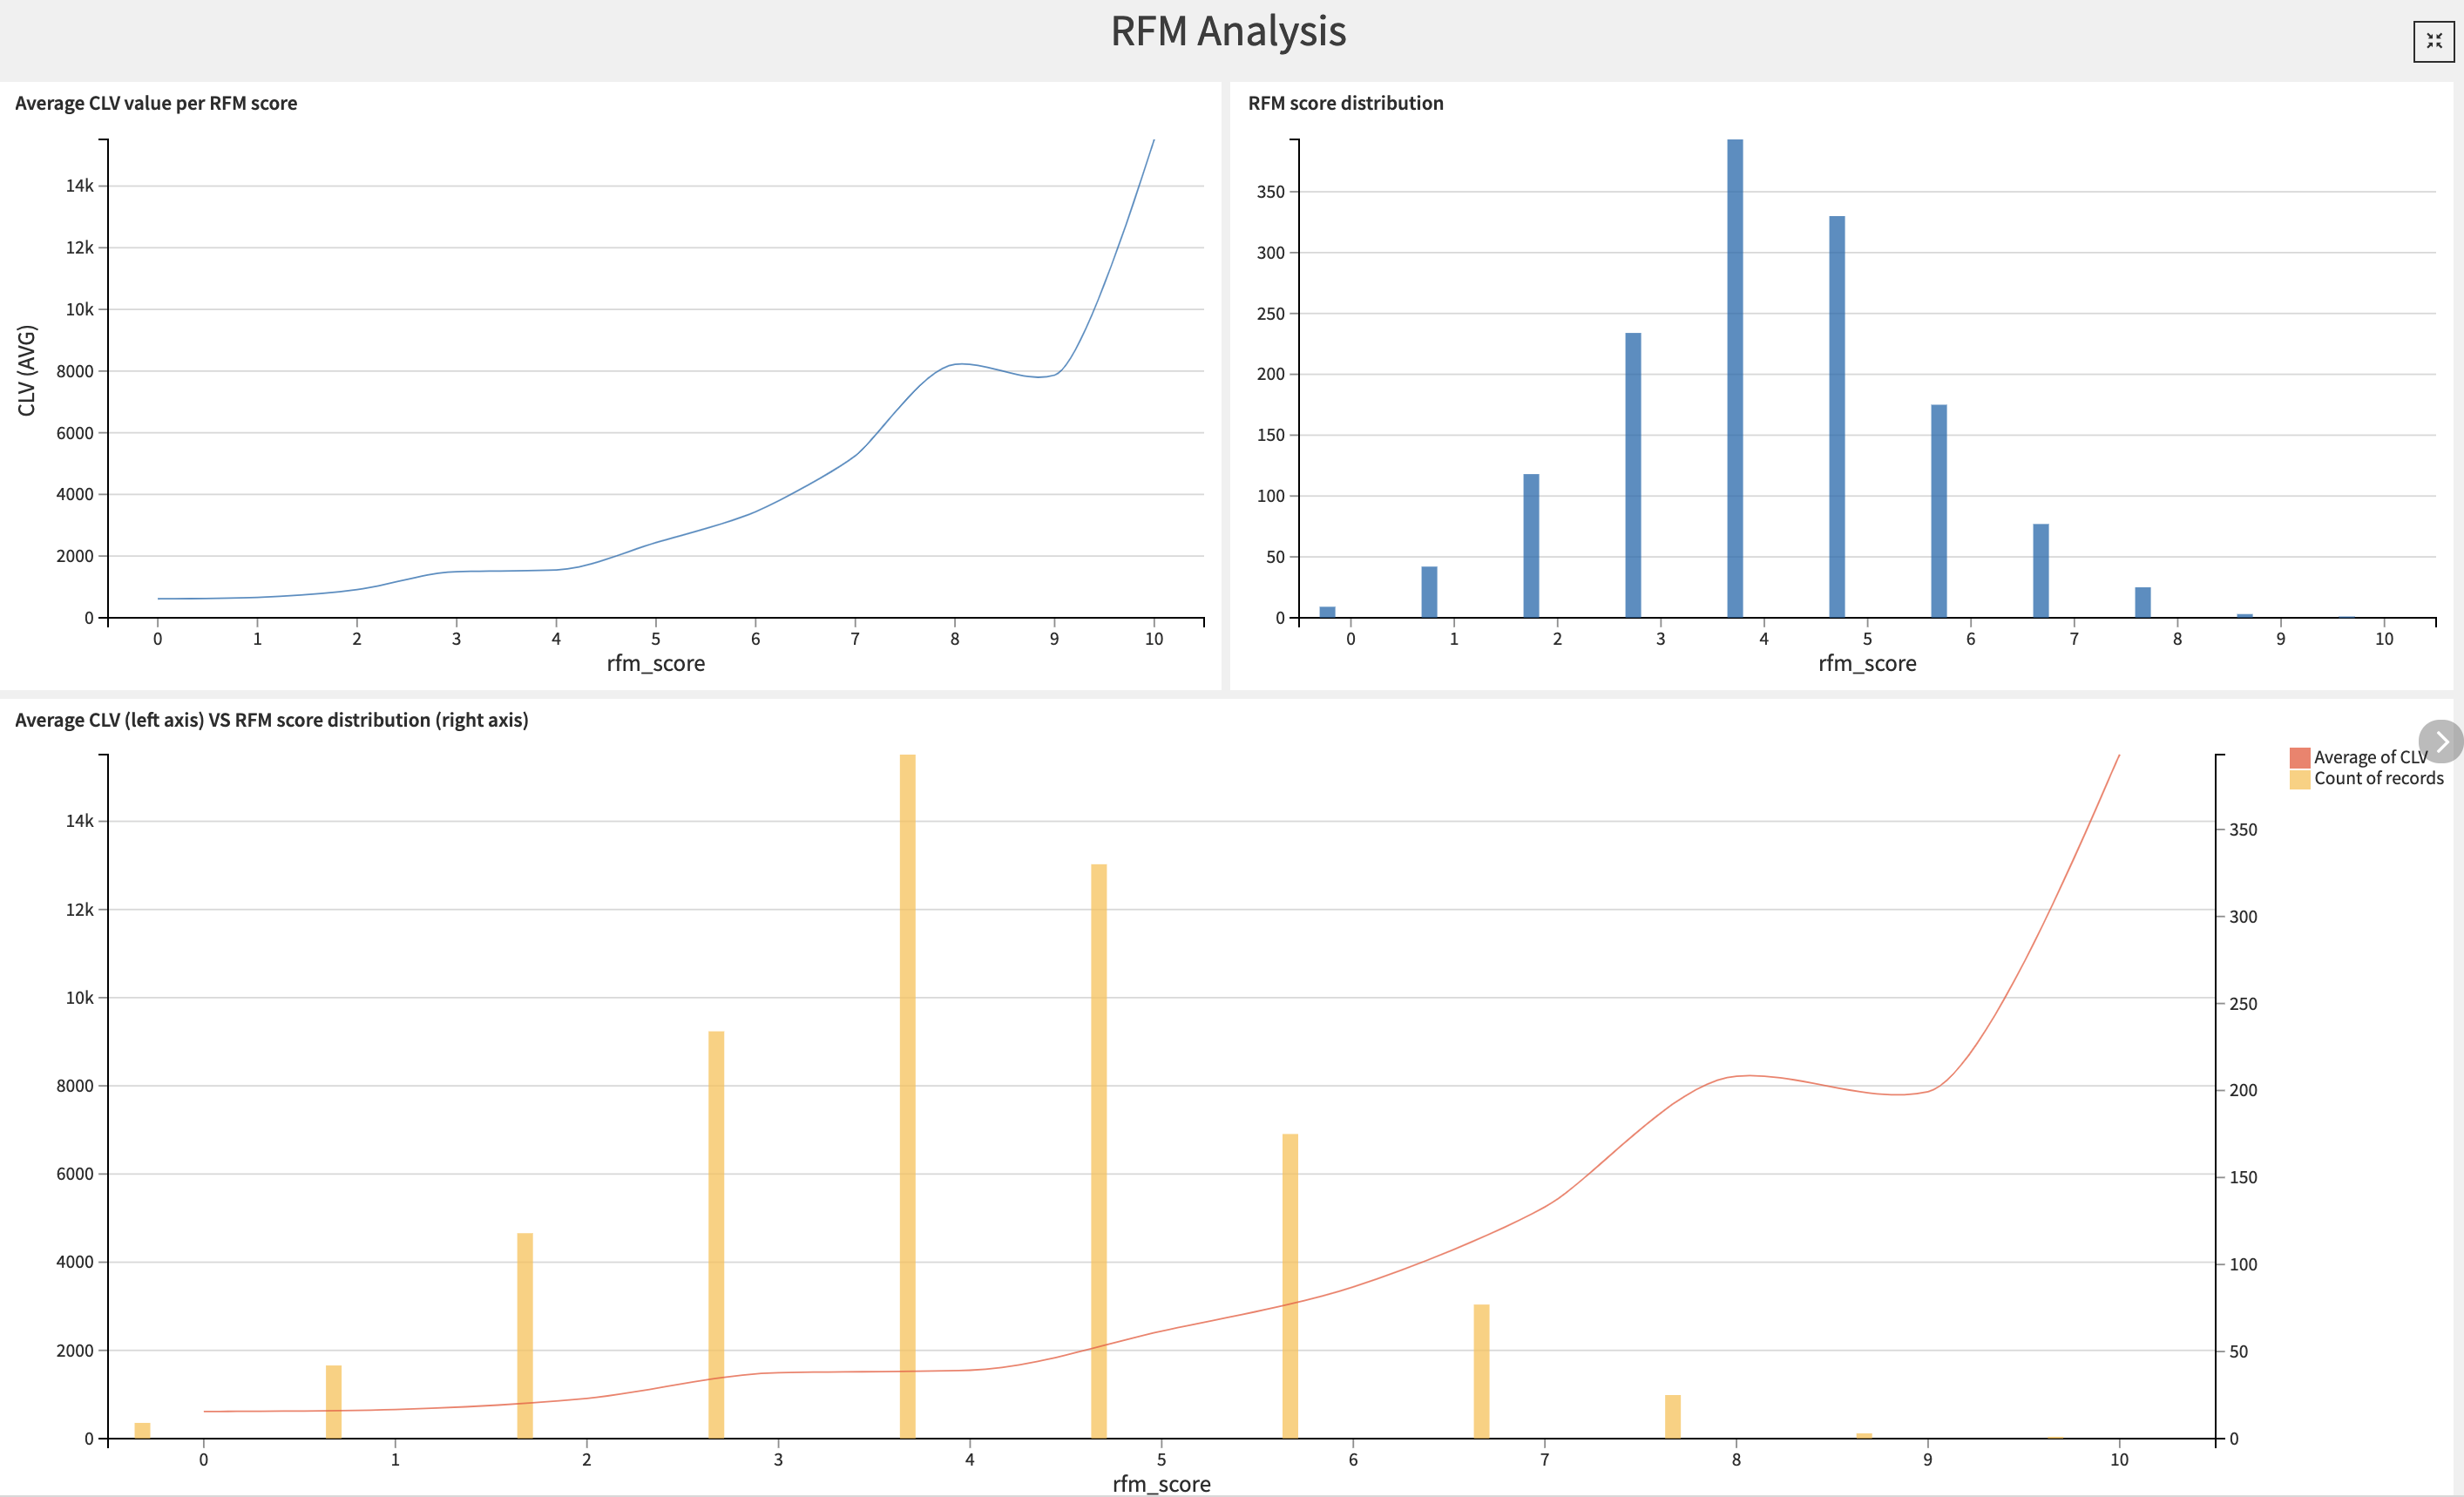
The final recipe in this Flow zone uses a Top N recipe in order to identify the customers with the highest RFM scores. This score will later be used to predict customer lifetime value and allow us to segment our customer base. RFM scores can also be used as-is by Acquisition Managers to acquire new high-value customers via look-a-like strategies.
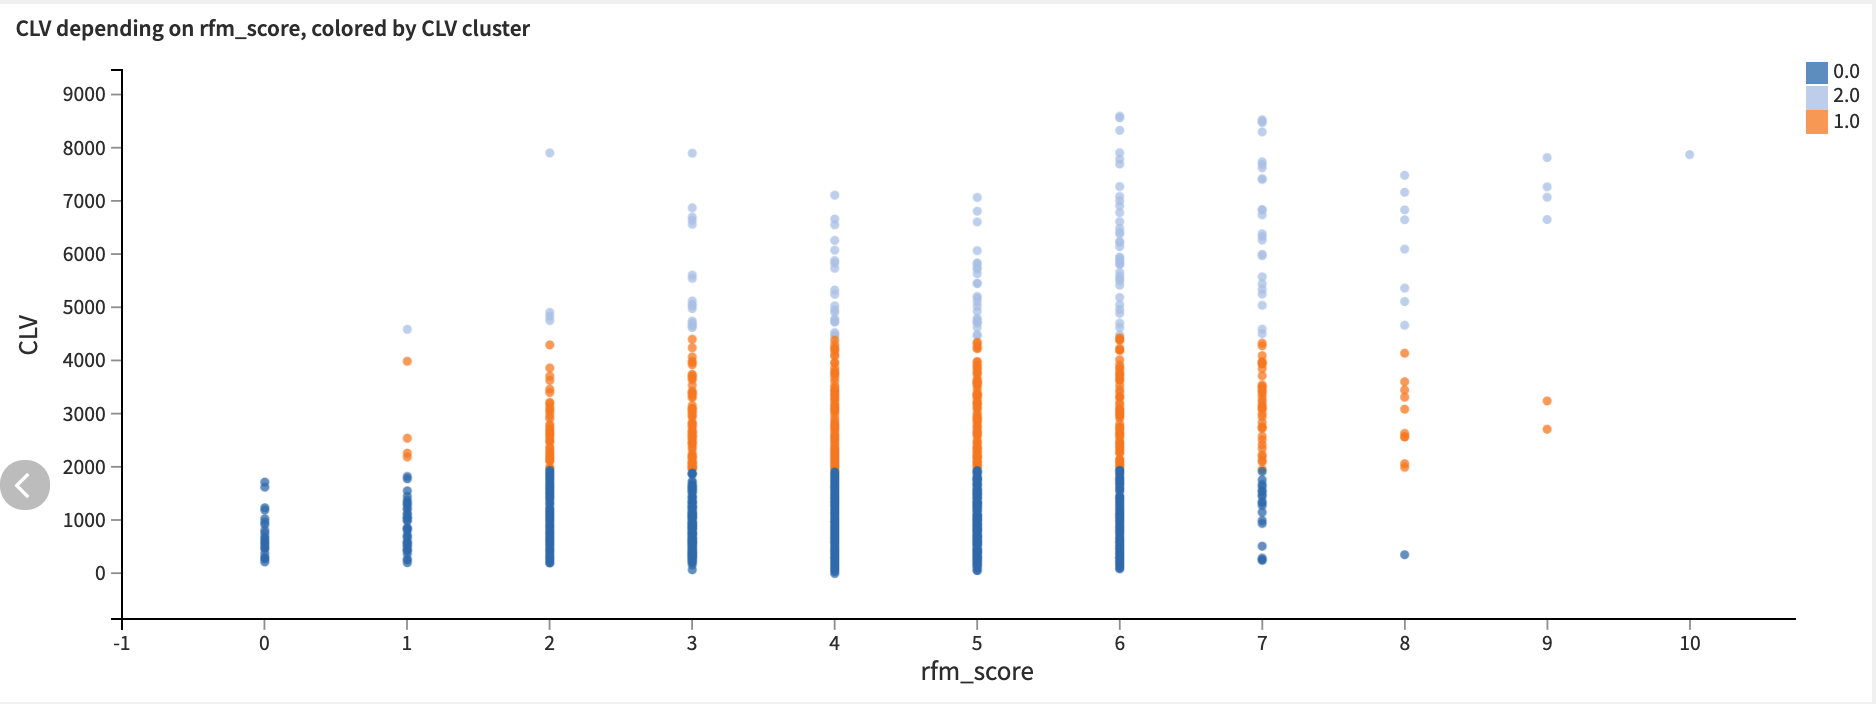
We can visualize the results of our RFM customer analysis in the first tab of the dashboard, RFM Analysis. Not only does this tab include insights on the RFM scores of our customers, but here we also compare RFM to CLV and visualize the individual elements of the RFM score (frequency, monetary value, recency).
Star Customers - Predicting Customer Lifetime Value
Now that we’ve sufficiently analyzed the data from our past transactions, we’re ready to use those analyses to predict the future value of our customers. Within this template project, we present three approaches to predicting Customer Lifetime Value, each with its own tradeoffs. We don’t recommend any single approach as being the most performant because, ultimately, that will depend on your own data.
The different approaches can be identified within the Prediction flow zone by activating the Tag View. In selecting the most performant model for your data, you unlock the ability to predict and assess the value growth of each of your customers based on your current strategies. This prediction of high-value customers allows retail companies to refocus their customer acquisition strategies on customers with similar profiles to their existing base of high-value customers.
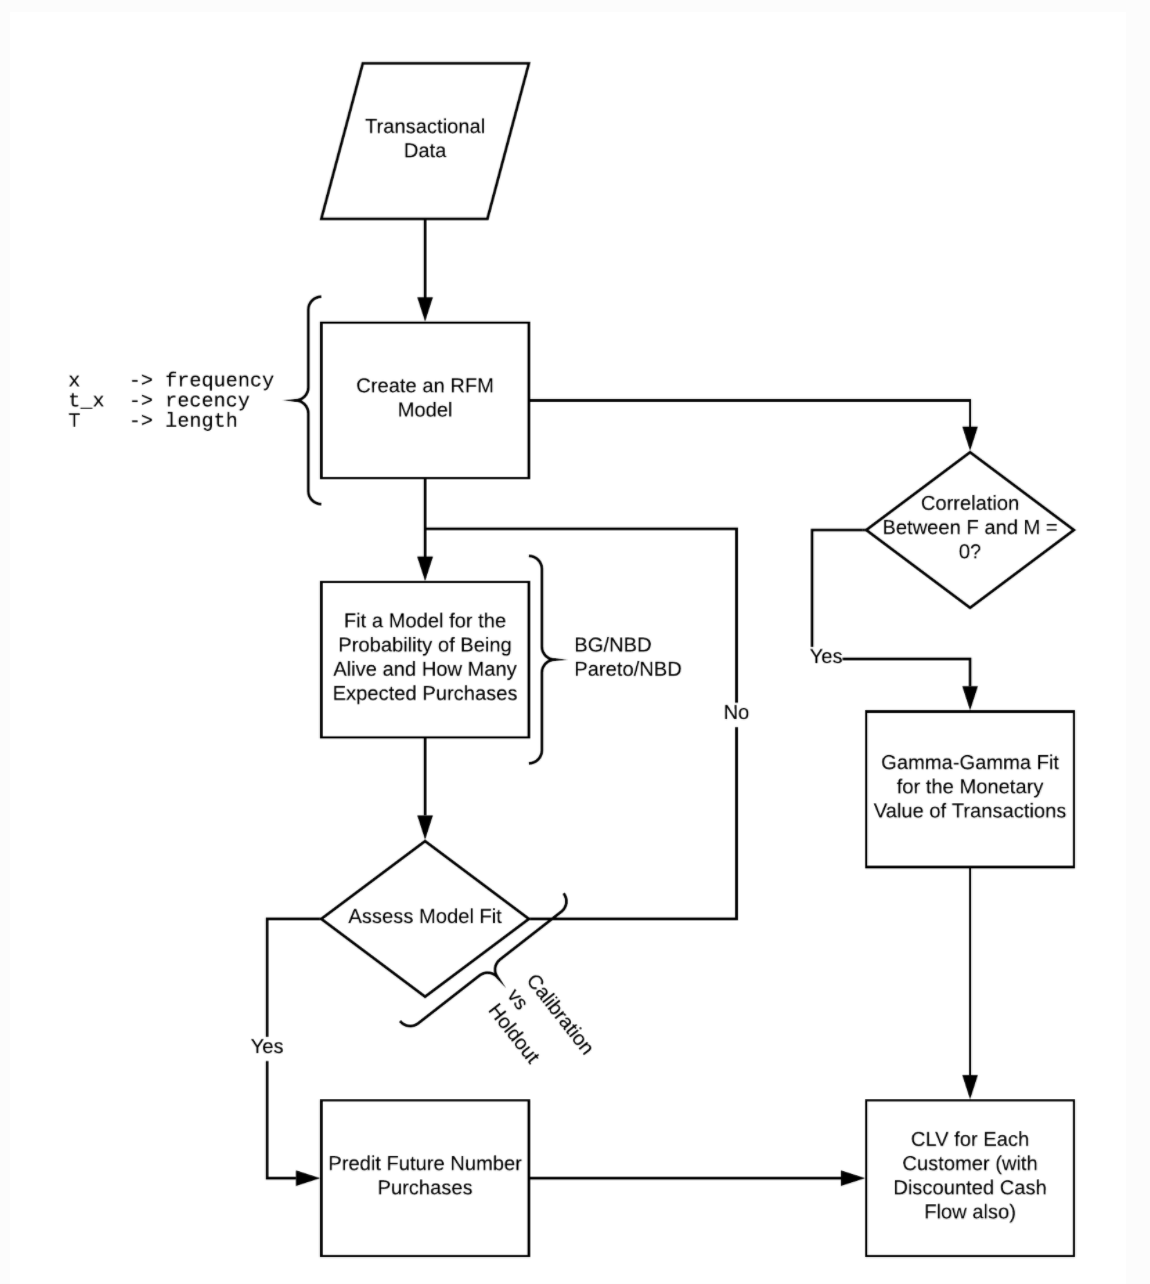
We begin with a Probabilistic Model approach which works by adjusting the probability distribution to the RFM values per customer and is therefore defined by each customer’s transaction history. This approach allows us to also calculate the probability for a customer to be active at the chosen threshold_date. This approach is extensively detailed in the Lifetimes library documentation .
The second approach uses Dataiku’s own VisualML analysis to predict the future CLV, as well as the log(CLV) using a Random Forest model. The benefit of training a Random Forest model on the log(CLV) is that it regularly gives better results, compared to the other two approaches, for skewed targets. The usage of Random Forest also requires more features than the Probabilistic Model approach.
Finally, we present a combined model approach that takes the generated outputs of the previously trained Probabilistic model and uses them as additional features for the training of a Random Forest algorithm. While this approach does require more work, it does add five new features which can depending on your data, vastly improve the performance of your predictive model.
The average, 25% percentile, and 75% percentile of predicted CLV for customers is computed and displayed in the Customers CLV Prediction tab of the Dashboard, along with a table containing the top 25 customers according to their predicted CLV.
Customer Tiering & Segmentation
In addition to using CLV to predict the future value of customers, we also use it in this solution to tier customers based on high, medium, and low CLV. This is done using a K Means clustering algorithm to categorize the CLV contained in customers_with_all_features as high, medium, or low. The defined clusters are then used to train a Random Forest classifier, which is used to predict the CLV categories of our customers.
Within the project dashboard, the Customer CLV classification tab provides reports on the performance metrics of the model used to predict CLV clusters and contextualizes the CLV and RFM scores by their associated CLV cluster. Marketing analysts can, for example, look at these tiers in order to know which customers they should invest in by pushing promotional offers.
With the same input dataset used for customer classification, we can also perform customer segmentation. Please note that this alone should not be viewed as a solution to customer segmentation, but can be considered a natural connection point between a CLV solution and a Customer Segmentation solution.
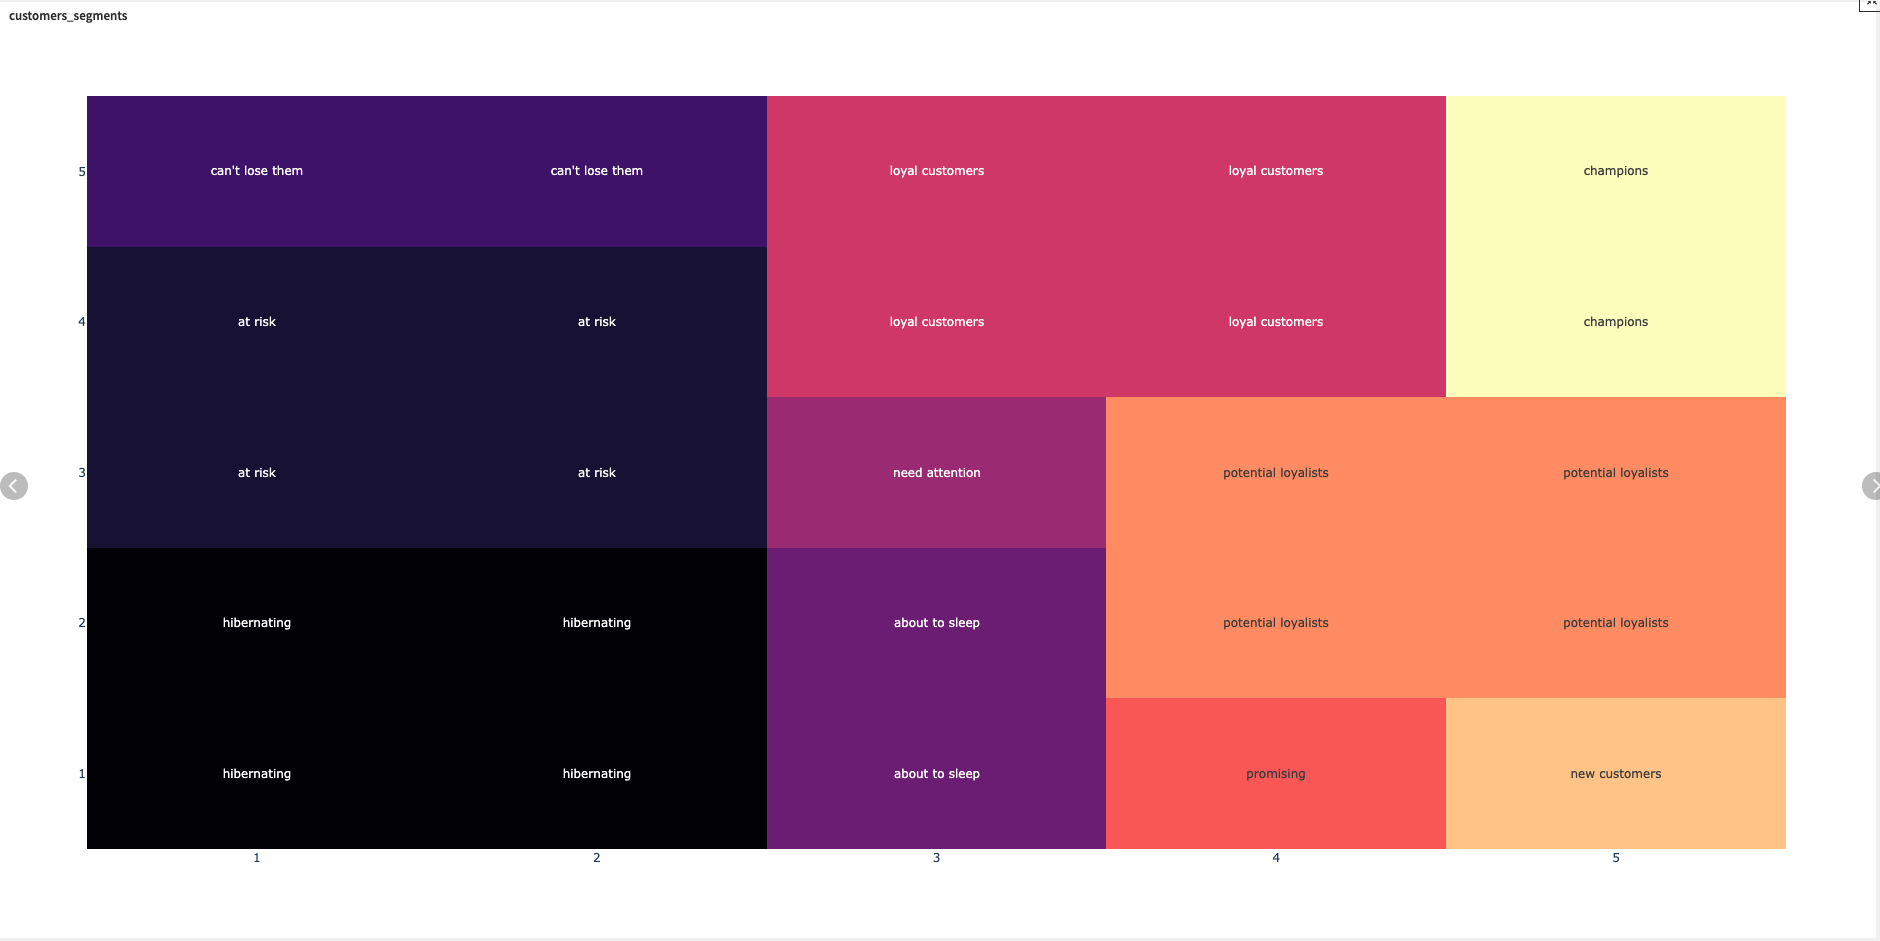
Within this solution, we segment customers according to their Market Recency and Frequency using a predefined matrix commonly used for RFM customer classification. The resulting classified dataset is then split such that there is one dataset per customer segment. The Customer segments tab of the Dashboard shares the visualization matrix of how we segmented customers along with a visual distribution of our customer segmentation. CRM analysts can use this visualization, and its underlying data, to optimize their CRM budgets and strategy by delivering personalized messages to the various customer segments.
High-Value Products for High-Value Customers
Product Analysis is an optional part of this solution and requires:
An additional dataset being uploaded to the project (product_details) contains two columns: ProductID and Product Description.
There also needs to be a ProductID for each product purchased in the original transactions_dataset.
By analyzing the products purchased by our customers, we can identify which products are being bought by customers with the highest predicted CLV. This can enable us to further tailor our customer outreach, marketing, and pricing strategy to attract and keep high-value customers.
If the required data is available, the transaction dataset is combined with the list of top customers based on their predicted CLV. Transactions made by customers who are not considered the most valuable are filtered out so as not to dilute the results. The remaining transactions are aggregated by product, and the total count of transactions containing that product is recorded.
The final dataset topn_products_with_desc shows the full list of products, and their description for ease of reading, purchased by the customers with the highest CLV. This list is easily accessible in the Product Analysis tab of the Dashboard and can be consumed by retail marketing analysts to push relevant products to customers in order to boost their purchases.
Reproducing these Processes With Minimal Effort For Your Own Data
The intent of this project is to enable customer success teams to understand how Dataiku DSS can be used to assess the value of their existing customer base and make smarter decisions on customer outreach, marketing campaigns, and much more.
By creating a singular solution that can benefit and influence the decisions of a variety of teams in a single retail organization, smarter and more holistic strategies can be designed in order to maximize sales, while keeping customer outreach and acquisition costs down.
We’ve provided several suggestions on how CLV can be calculated, predicted, classified, and used, but ultimately the “best” approach will depend on your specific needs and your data.
If you’re interested in adapting this project to the specific goals and needs of your organization, roll-out and customization services can be offered on demand.