Real Estate Pricing
Overview
Business Case
Assets invested in Real Estate have x3 in the past ten years to exceed 3,3 trn$ AUM. The pandemic has triggered significant volatility on real estate pricing: on average, commercial real estate indexes have seen their prices drop by -25% in a year.
In this non-regulated market, the importance of strong valuation strategies is critical to support opportunity identification, fuel impactful negotiation strategies, and optimize P&L management. Teams focused on developing effective valuation models need to manage complex data integrations, detailed modelling challenges, while ensuring the output results are easily consumable by other teams and clients.
This work can often involve distinct skill sets and underlying technologies, making collaboration challenging and creating project inefficiencies. By removing the need for upfront investment in Webapp and API design, allowing data scientists, data analysts and asset managers to interact collaboratively, and providing a flexible and complete project framework with real-world data, this solution accelerates time to insight and minimizes unnecessary development and effort.
The goal of this adapt and apply solution is to show asset management organizations how Dataiku can be used to predict the price of residential real estate using publicly available data in order to identify key factors in real estate pricing at individual and portfolio levels.
Technical Requirements
To leverage this solution, you must meet the following requirements:
Have access to a DSS 9.0+ instance.
A Python 3.6 code environment named
solution_real-estate-pricingand the following required packages:
scikit-learn>=0.20,<0.21
geojson==2.5.0
Shapely==1.7.1
geopy==2.2.0
Flask==2.0.2
dms2dec==0.1
pyproj==3.0.1
Note
When creating a new code environment, please be sure to use the name solution_real-estate-pricing or remapping will be required.
Installation
If the technical requirements are met, this solution can be installed in one of two ways:
On your Dataiku instance click + New Project > Industry solutions > Financial Services > Real Estate Pricing.
Download the .zip project file and upload it directly to your Dataiku instance as a new project.
Note
If running a DSS 9 instance, the solution is found by navigating to + New Project > Sample Projects > Solutions > Real Estate Pricing.
Data Requirements
While the project should be used as a template to build your own analysis of real estate prices, you can change the input dataset to your own data, and run the Flow as-is. The data initially available in this project comes from public sources:
The input dataset real_estate_sales was provided by Demandes de valeurs foncières (Requests for real estate values), published and produced by the general directorate of public finances. It originally contained data for the entire French metropolitan territory and its overseas departments and territories, with the exception of Alsace, Moselle and Mayotte. For this project, we sampled on transactions in the city of Paris.
Secondly, census_data contains information about the french IRIS (“Ilots Regroupés pour l’Information Statistique” <-> “spatial areas grouped for the statistical information”) provided by the the french National Institute of Statistics and Economic Studies (INSEE) and the french National Institute of Geography (IGN). The data is limited to years prior to 2017 so for this project the census data of years 2018, 2019, and 2020 are copies of the 2017 data.
properties_portfolio contains a .csv file with a portfolio of properties and their characteristics. It is later used in the flow as the dataset on which we apply our predictive model for scoring.
Lastly, subway_stations and city_districts contains data that was retrieved using a web scraping tool applied to wikipedia.
Note
Due to project constraints and data quality requirements, some of the data had to be filtered
Workflow Overview
You can follow along with the solution in the Dataiku gallery.
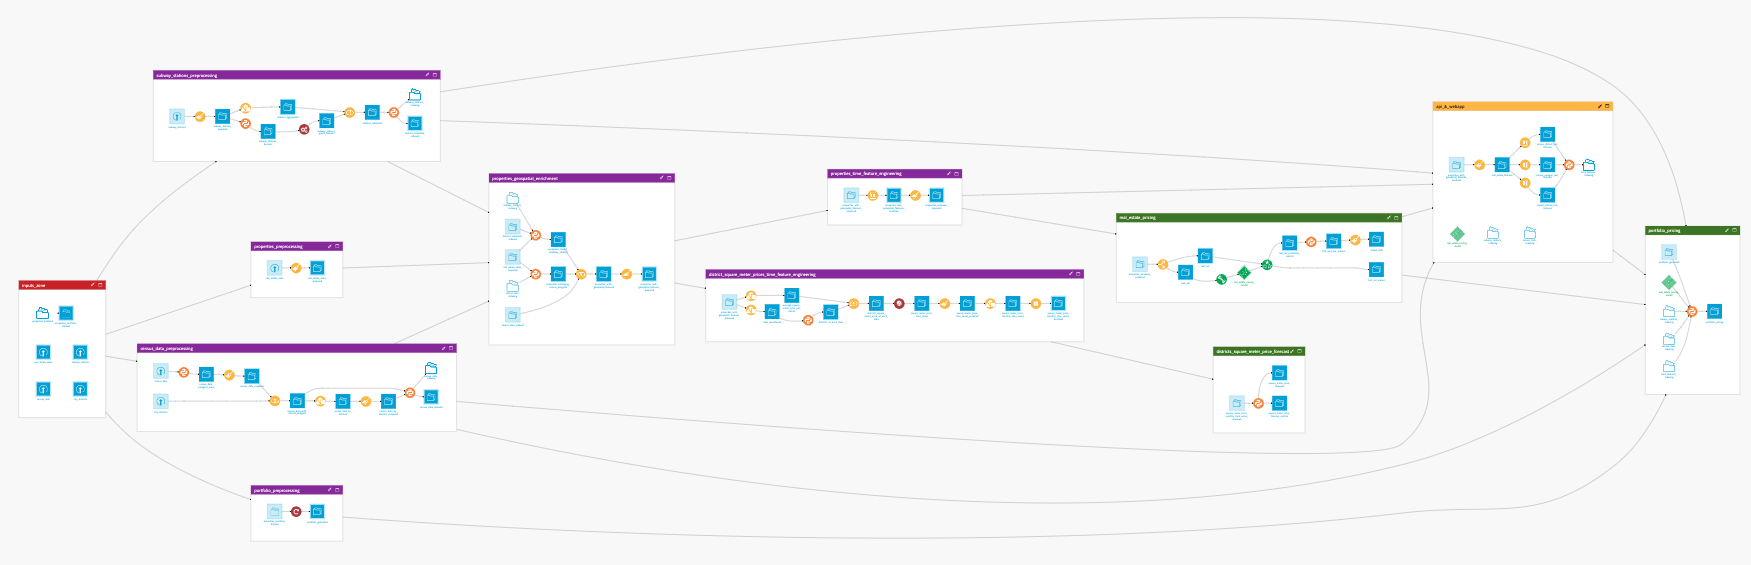
The project has the following high level steps:
Process the property data, census data, and subway station data
Join all the spatial data (census, stations, city center) to the property sales data
Apply time feature engineering techniques
Train and score a model for predicting the price of real estate
Forecast price per square meter
Explore detailed visual and technical insights into underlying models and integrated data sets.
Interactively generate prices and leverage API and bulk-export functionality
Walkthrough
Note
In-depth technical details can be found in the wiki of the project.
Predict Real Estate Prices with Public Data
The first branch of the project focuses on preparing data to train a model for predicting the price of real estate. To begin we must preprocess and feature engineer all of our input datasets detailed above. Preprocessing of our data involves:
Parsing transaction dates
Cleansing the data and renaming columns for consistency across all input datasets
Creating new features based on existing columns(e.g. geo points, property per square meter price, computing district polygons, using the graph analytics plugin to turn the subway data into a network graph, etc.)
Geographical Data enrichment to compute, for all properties, their distance from the center of Paris.
Once all elements of our input datasets have been cleaned and unified into a single dataset properties_with_geospatial_features_prepared we apply time-based feature engineering to the properties sales history. With the knowledge that three main factors influence a property price (characteristics, location, and real estate market) we want to compute the final factor before training a predictive model. More simply put, we need to compute the influence of the real estate market at the time a property was purchased.
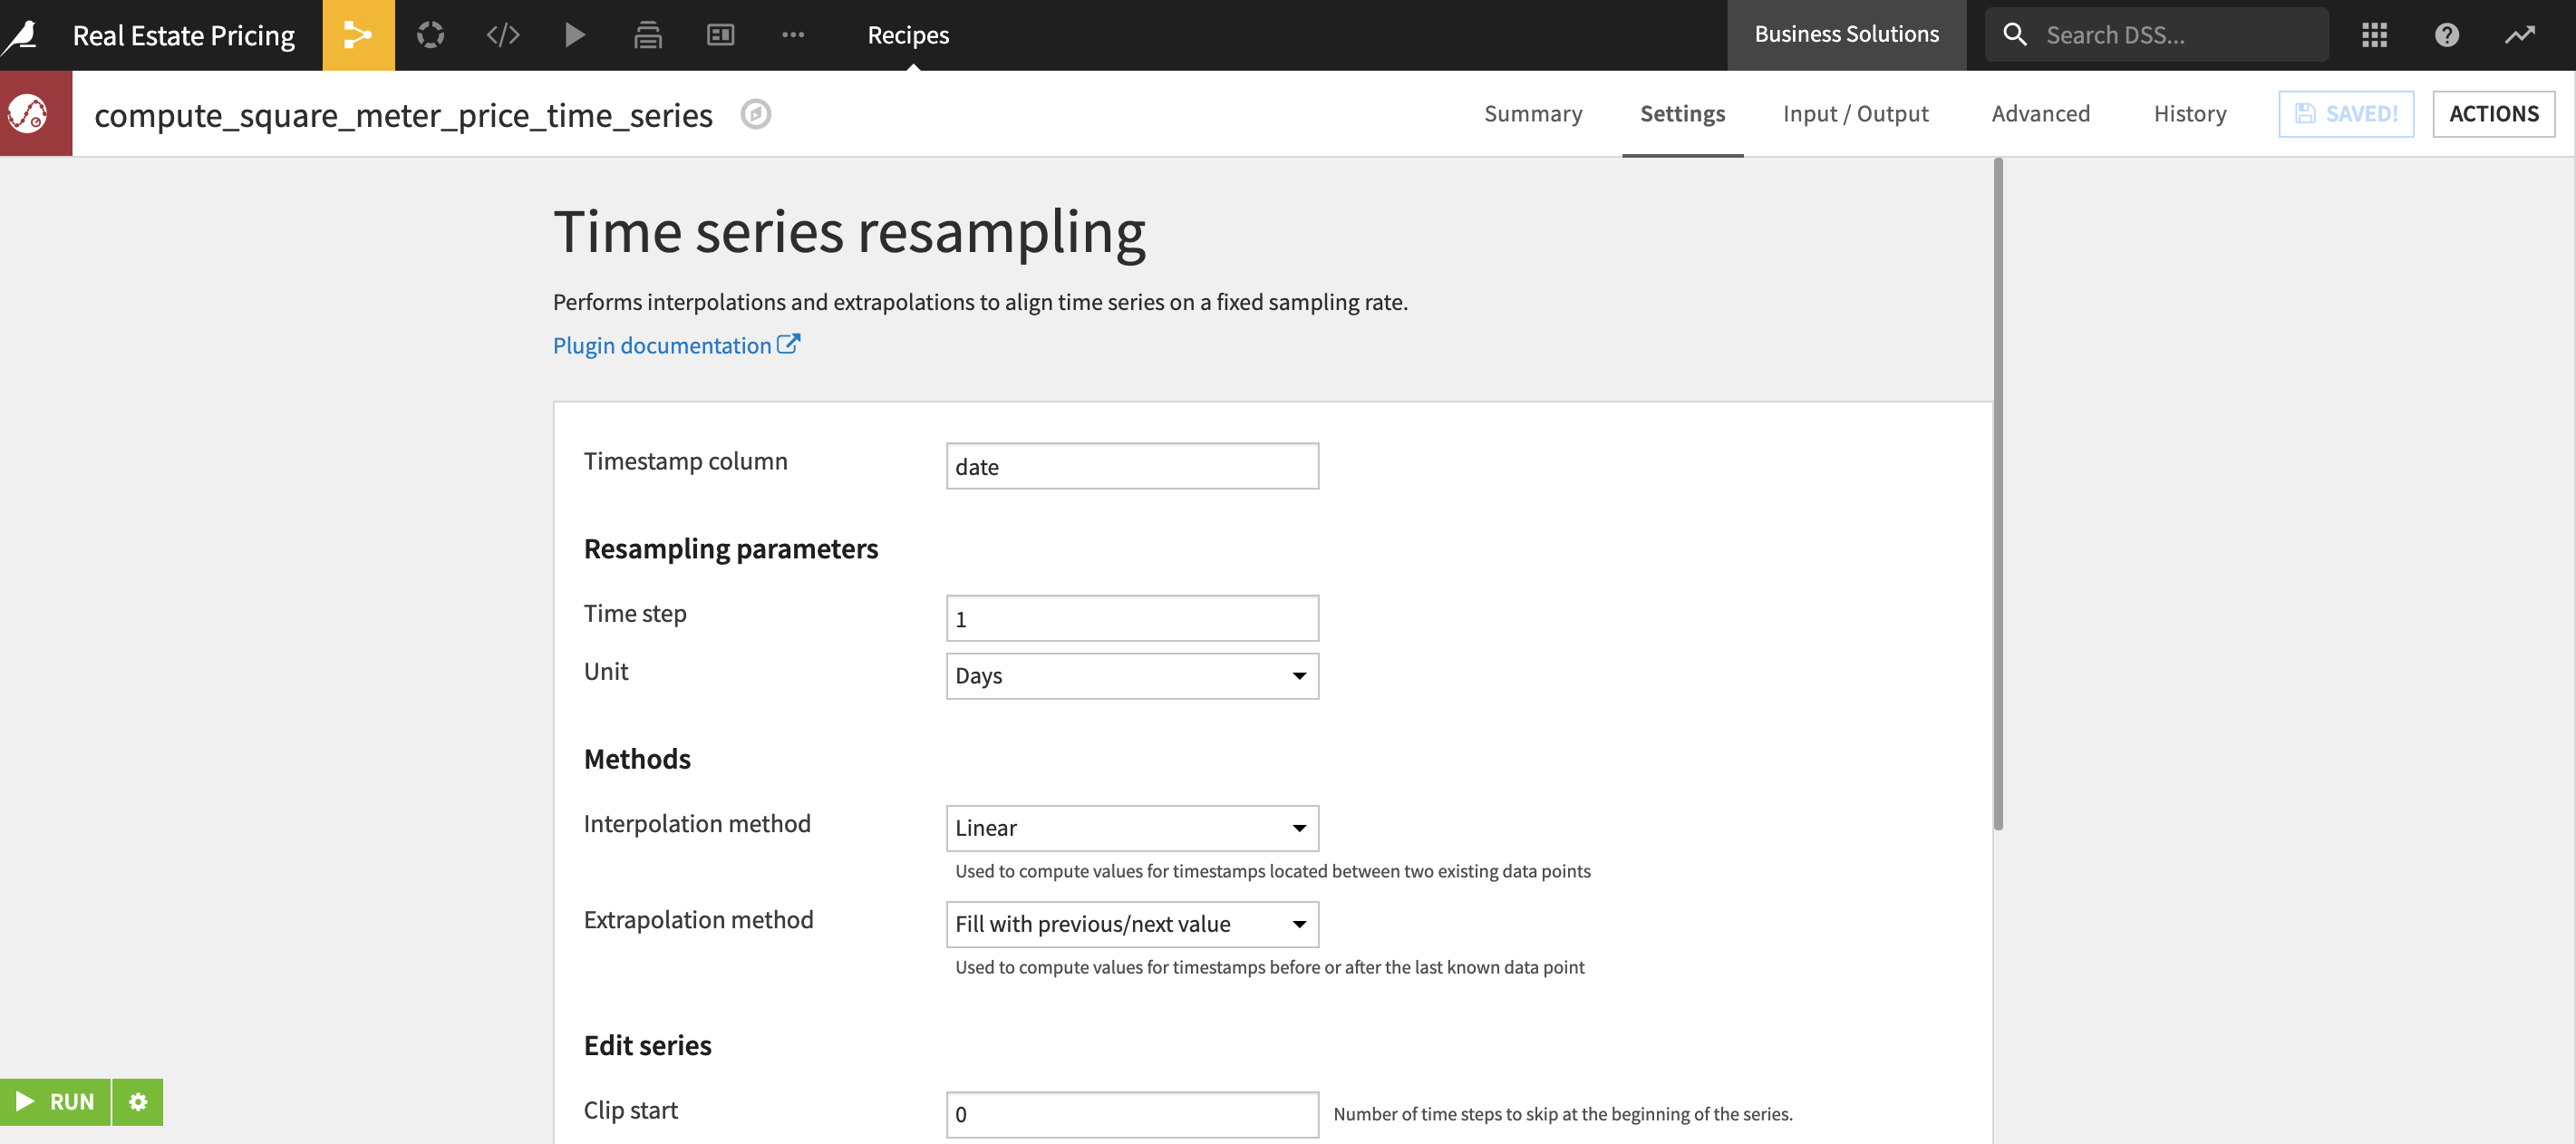
We do this by applying windows of 30, 60, 90, and 180 days in the past, across several different locations, looking for the average square meter price. When information is missing, the missing value is replaced by the closest available in time (i.e. if the 30 day square meter price is missing, we replace it with the 60 days square meter price). After all values are found we create price estimates for each time frame T and location L by computing:
T days average square meter price in L x property_living_surface
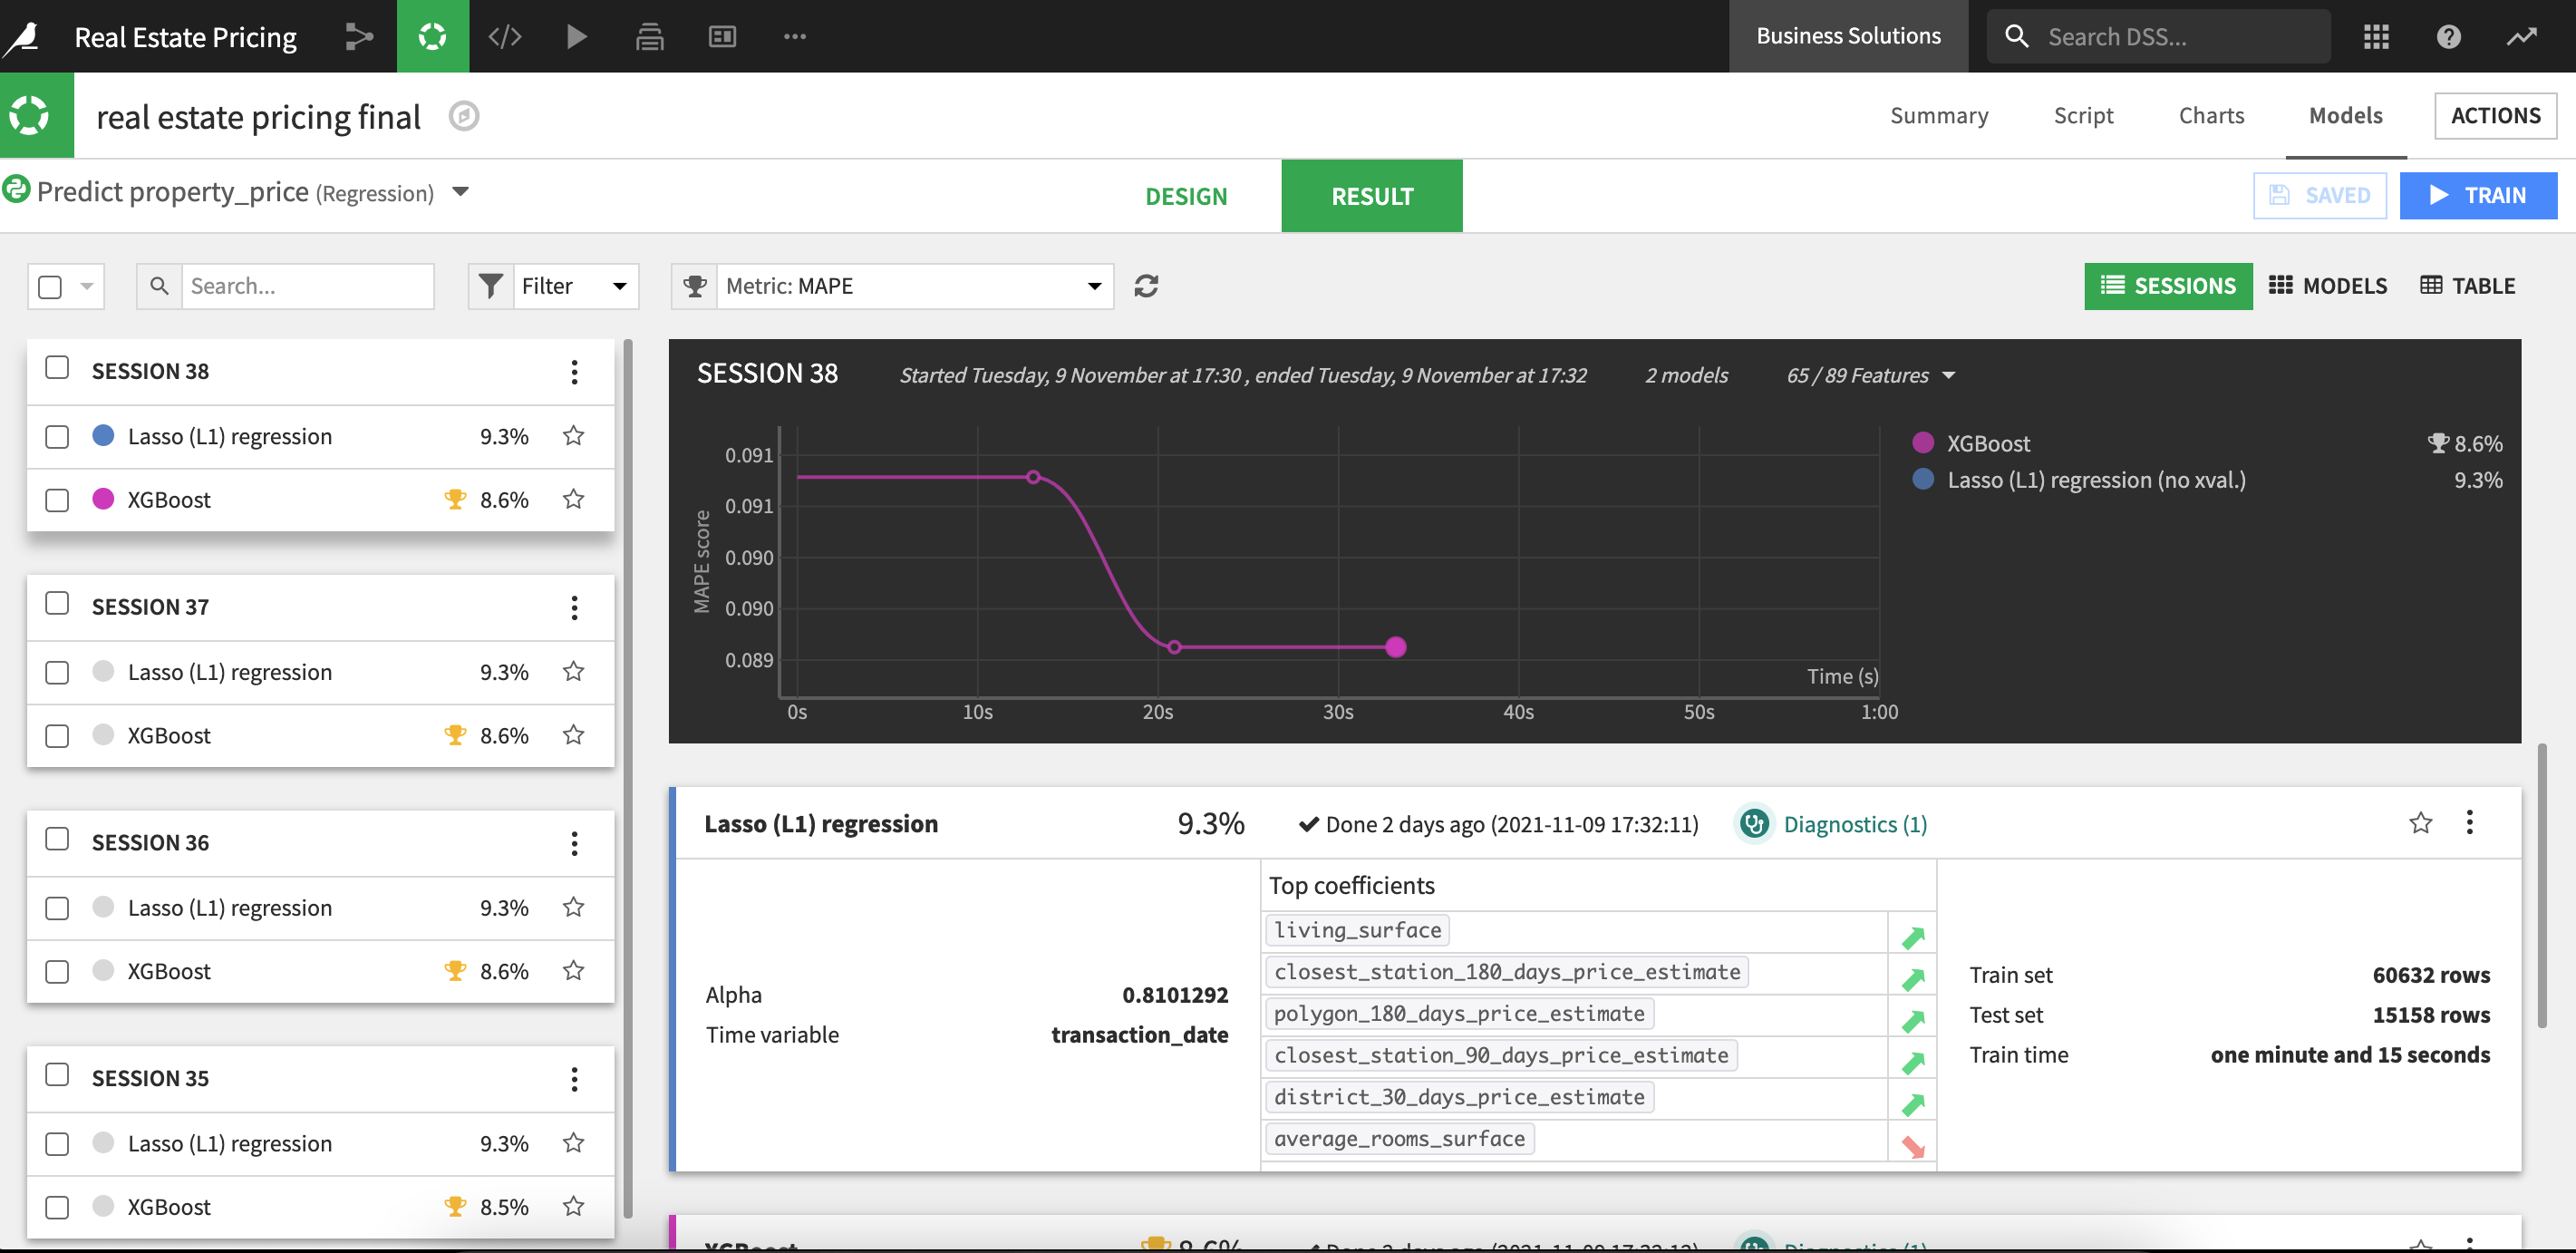
With our data now appropriately prepared and contextualized, we can train the machine learning model responsible for predicting residential real estate prices. The model splits the data coming from properties_windows_prepared with 80% making up the train set and the other 20% being used for the test set. We train the model to be optimized on the mean absolute percentage error (mape) before deploying it on the flow for evaluation. The evaluation results in an observed drift of -1.3% between the first and last deployment.
Within this same branch we also preprocess a portfolio of properties and then score all the properties using the trained machine learning model. This serves as an example of how, when adapting this project to our own needs, we can perform batch scoring on a large portfolio of properties.
Additional data cleansing and data isolation is done in the api_&_webapp flow zone in order to make data available for Dashboard visualizations which will be discussed later in this article.
Forecast the Square Meter Price for Paris Districts
A parallel branch exists in this solution that is dedicated to forecast the square meter price in each distinct Paris district. The overall trend of prices in Paris is increasing but the evolution of those prices differ based on the district (i.e. neighborhood) we’re observing. We will attempt to capture those trends by training a linear model to forecast property prices.
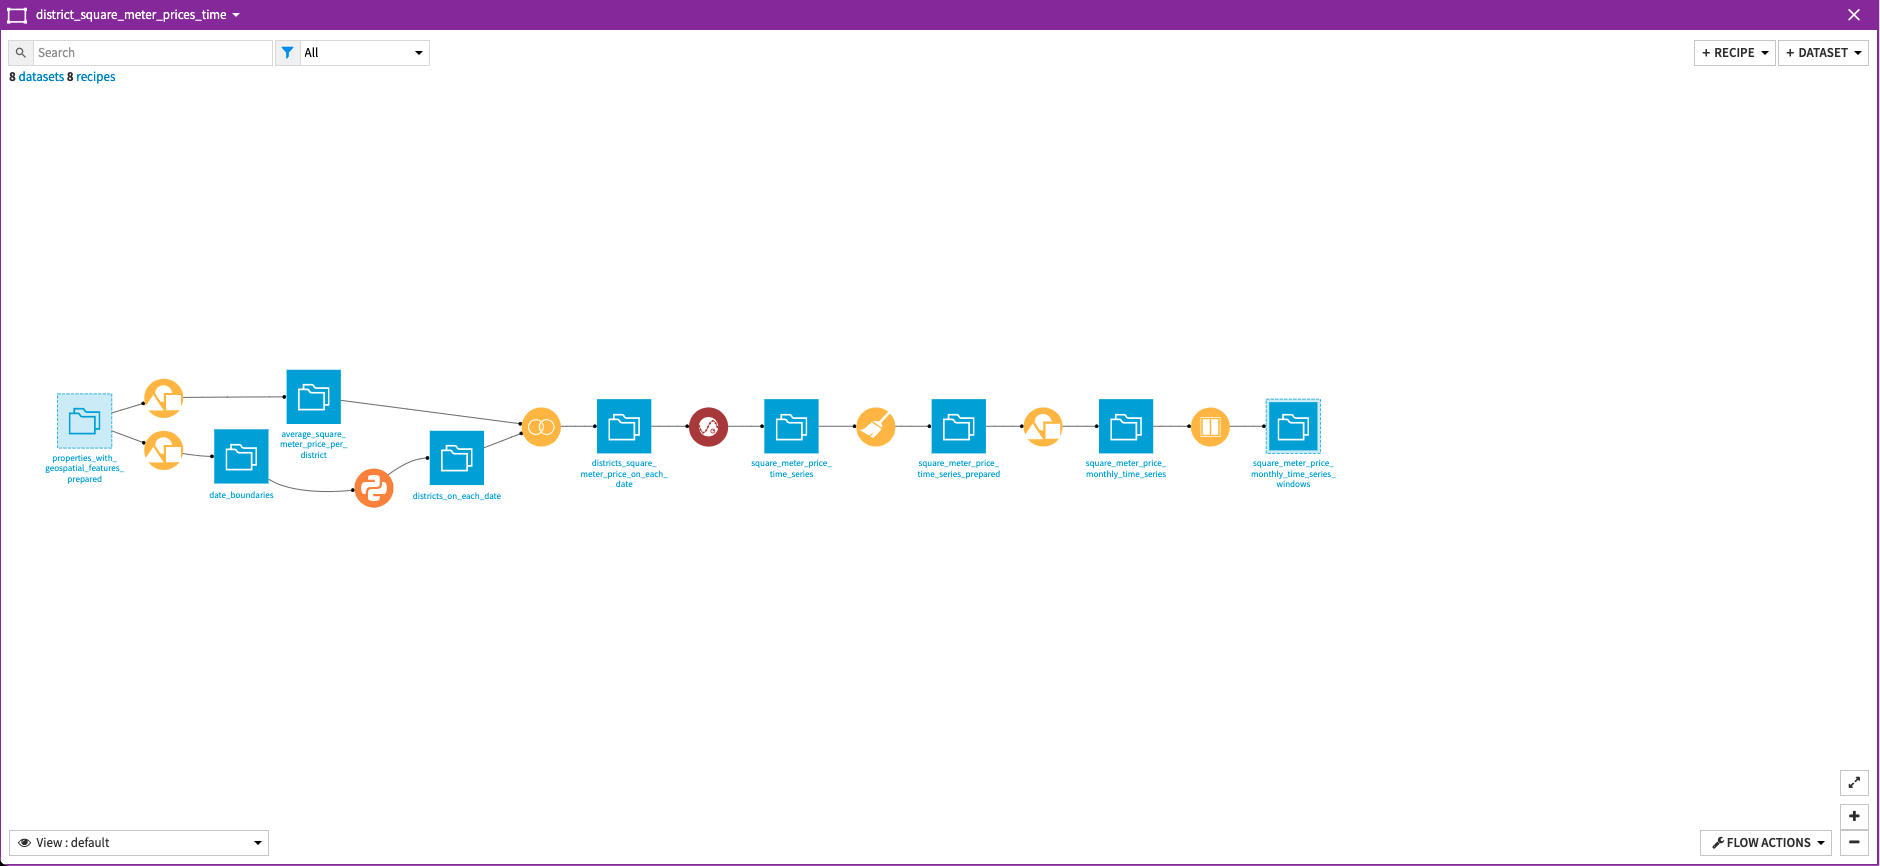
We preprocess our data to turn it into an exploitable time series dataset with properties separated by district and the square meter price computed. The trained model uses only the time information (i.e. the month) as a predictor to forecast the square meter price. The train set is monthly data between 2016 and 2019, and the model is tested on 2020 data.
Leverage Rich Visualizations to Explore You Data
The Real Estate Pricing dashboard consists of 6 slides containing DSS charts for analysis of the project’s core information and a single slide containing an interactive Webapp.
The first 5 slides are dedicated to visualizations resulting from the real estate pricing prediction branch of the solution:
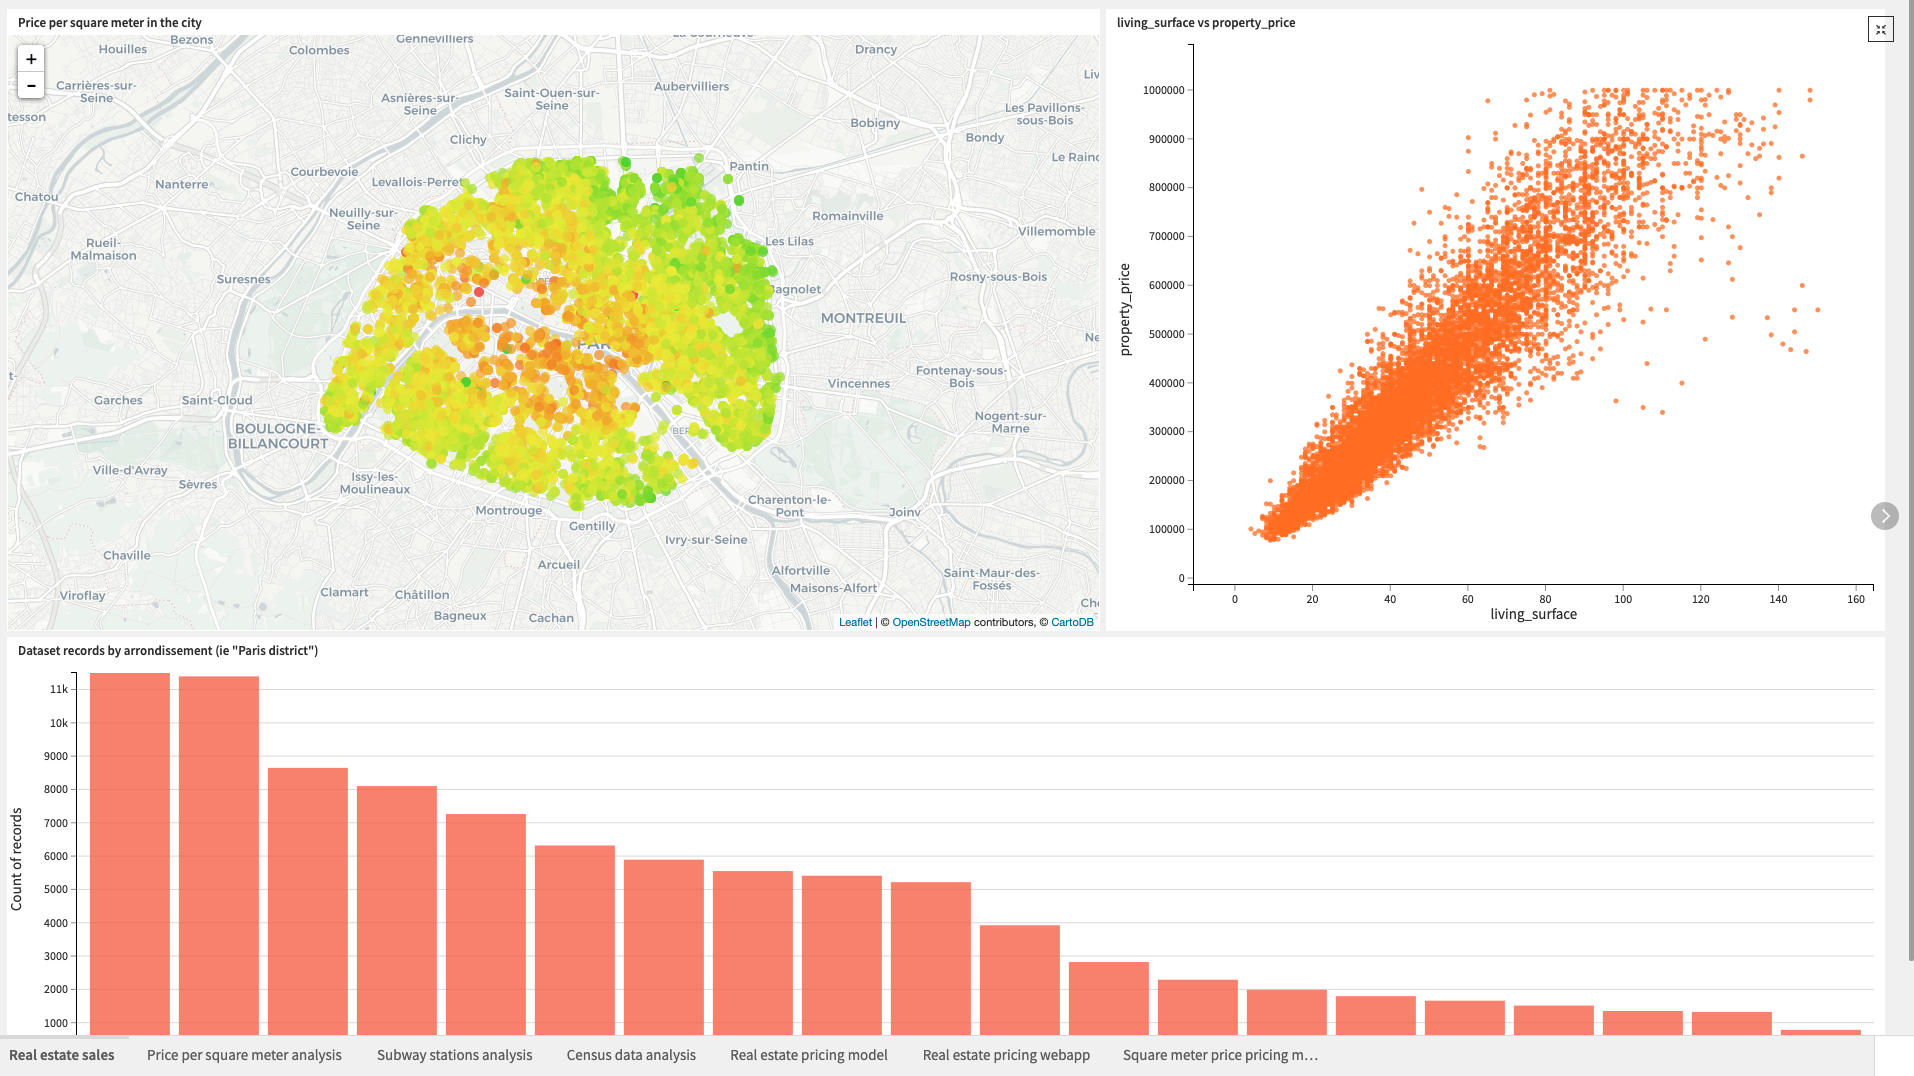
Real Estate Sales gives an overview of the initial real estate dataset
Price per square meter analysis focuses on analyzing the sold properties’ square meter prices over time and by district
Subway Stations Analysis helps in analyzing the Paris subway network, specifically the importance of subway stations, by visualizing the graph database we created
Census Data Analysis analyzes the project’s census data with a focus on population density and population density as they relates to Paris districts
Real estate pricing model presents several ways to analyze the performance of our model for real estate price prediction including, most importantly, an analysis of the model variables importance (i.e. the characteristics of a property that most influence their price)
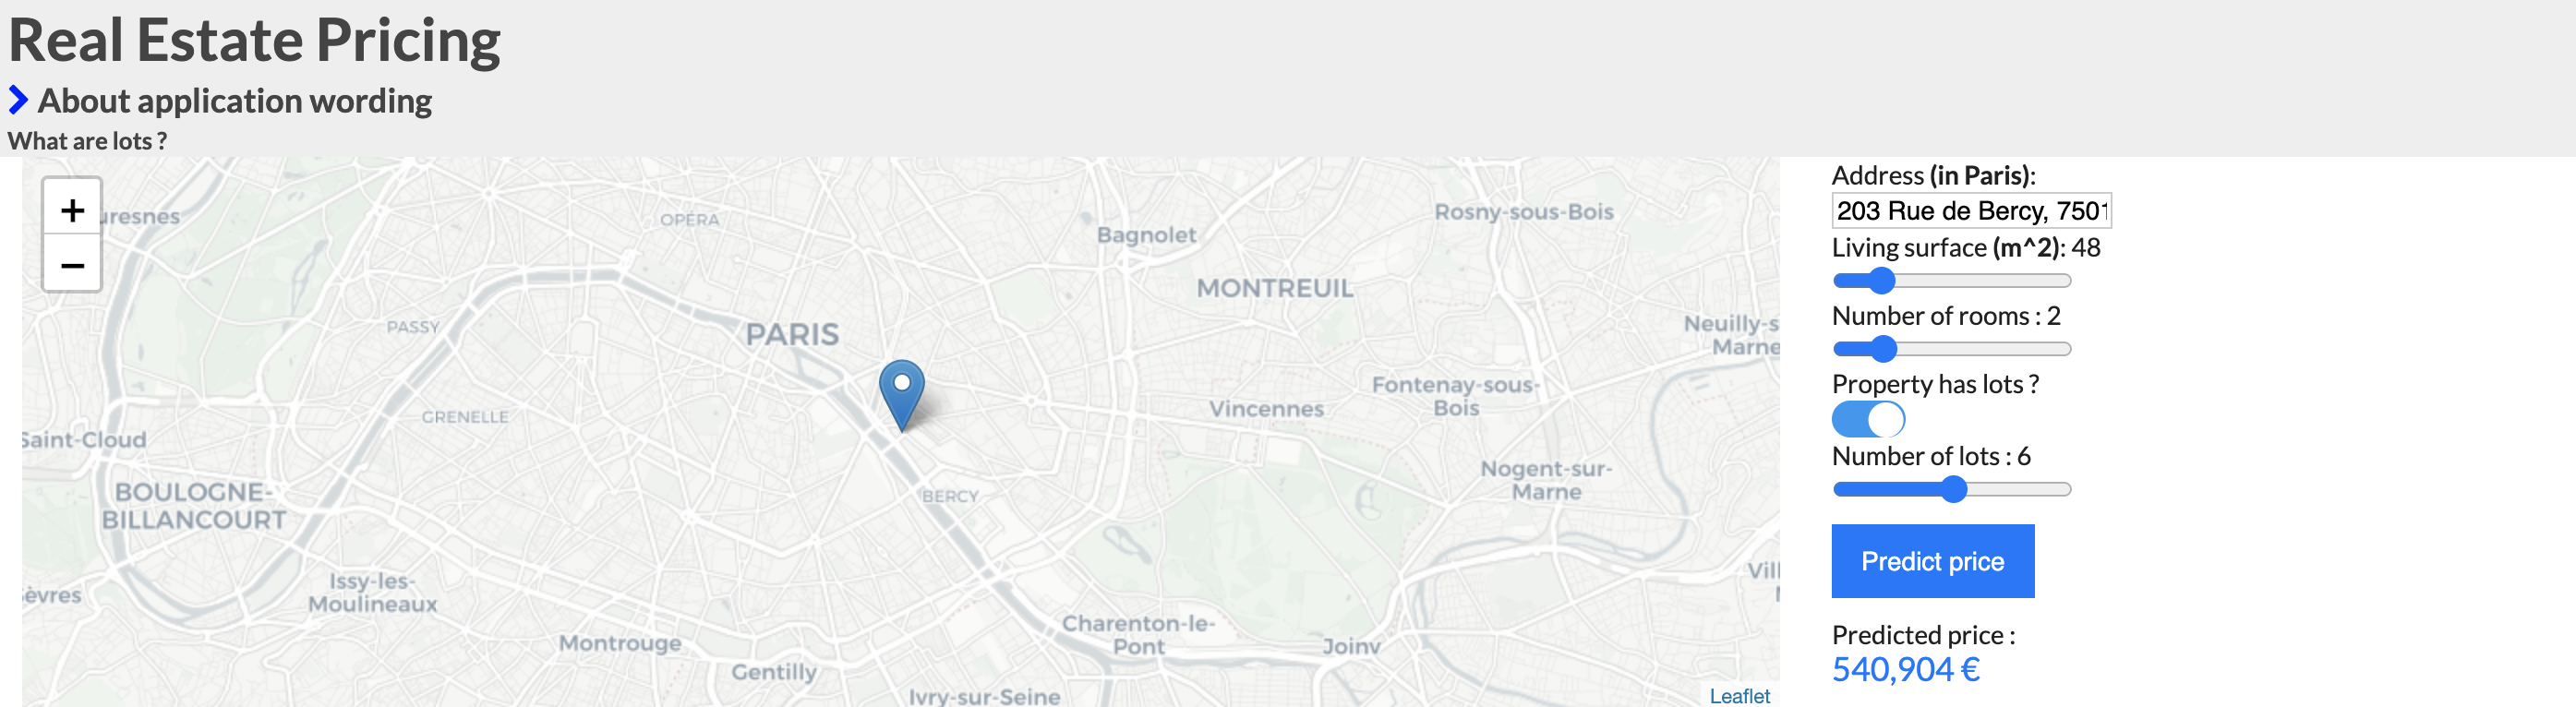
On the 6th slide of the dashboard we are presented with an interactive Webapp in which we can enter a property address in Paris, as well as characteristics like its living surface, rooms, etc. to get real time price predictions.
Note
As this project is meant to be used as a template to guide development of your own analysis in DSS, the real life predictions from the Webapp should not be used as actionable insights or an accurate prediction.
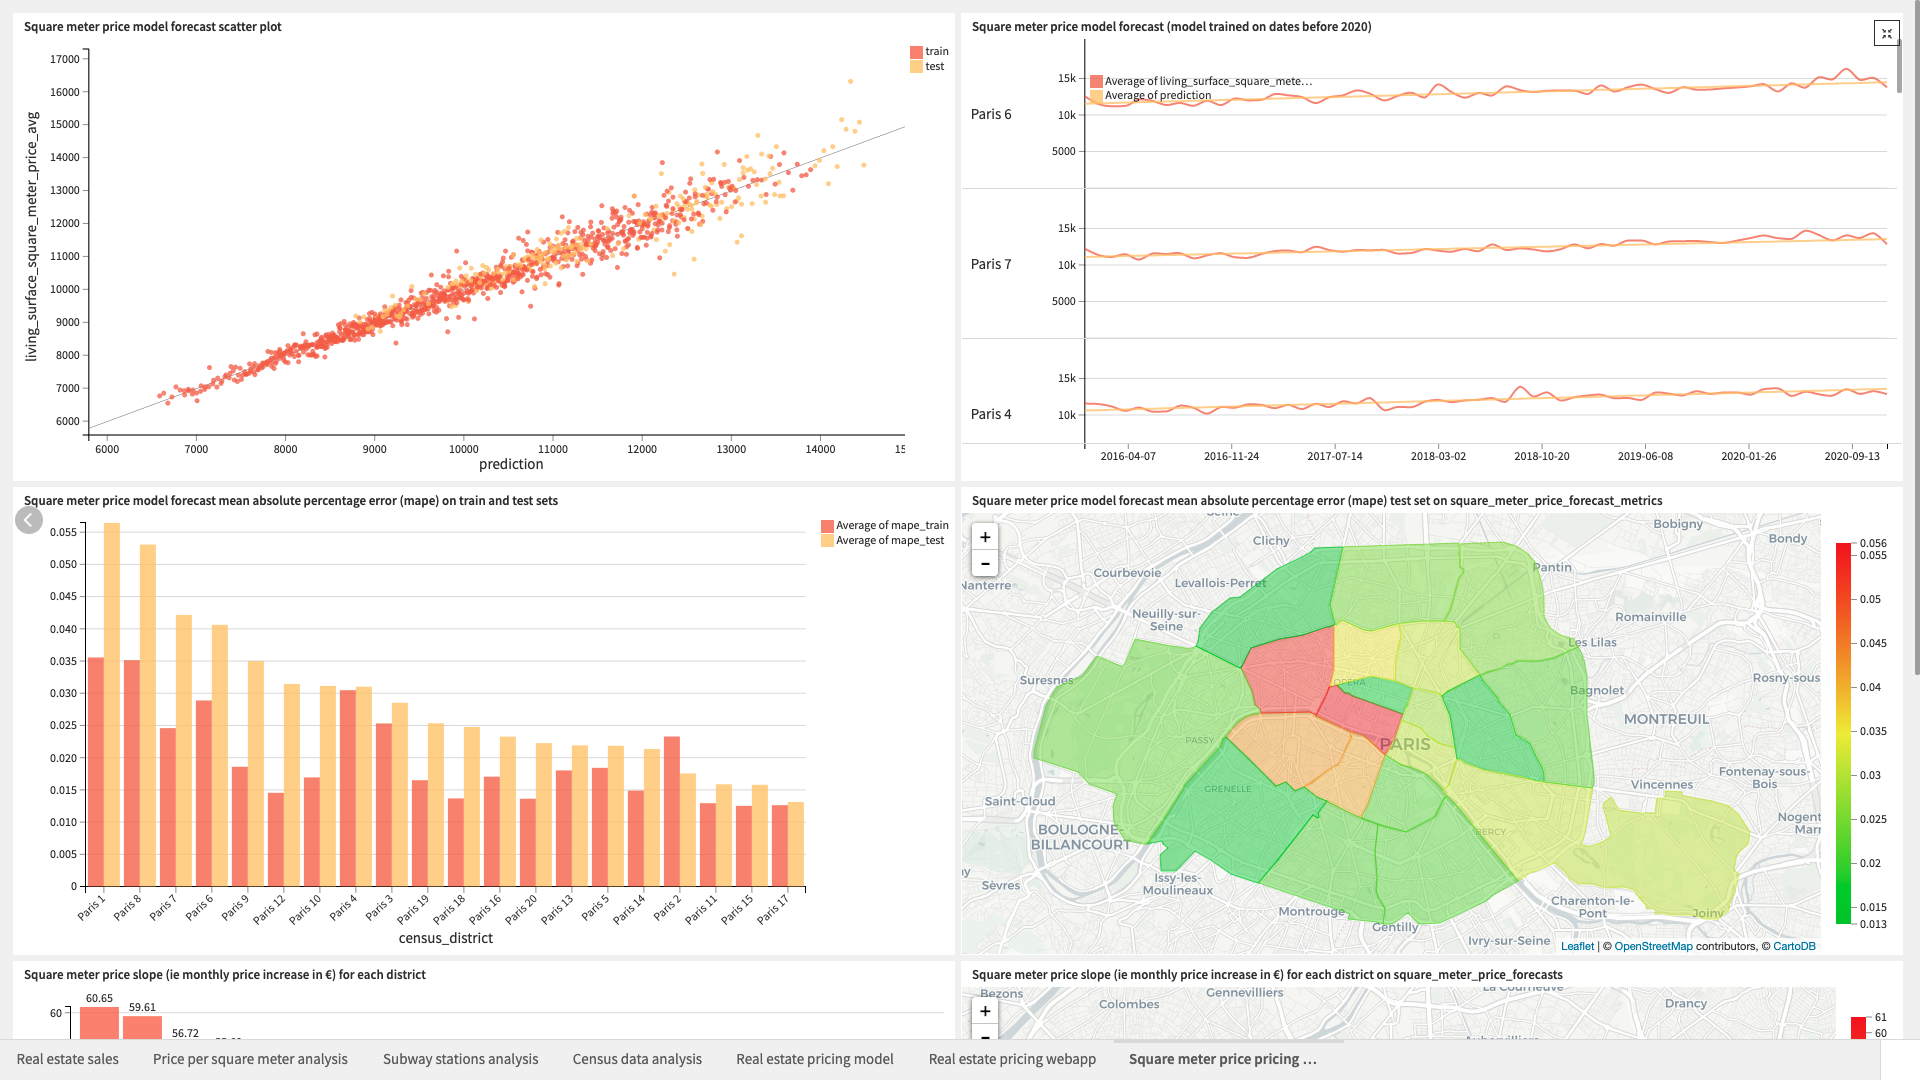
Finally, the last slide of the dashboard uses data from the square meter price forecast model to show the overall model performance and price per square meter forecasts for each Paris district.
Access Price Predictions via an API
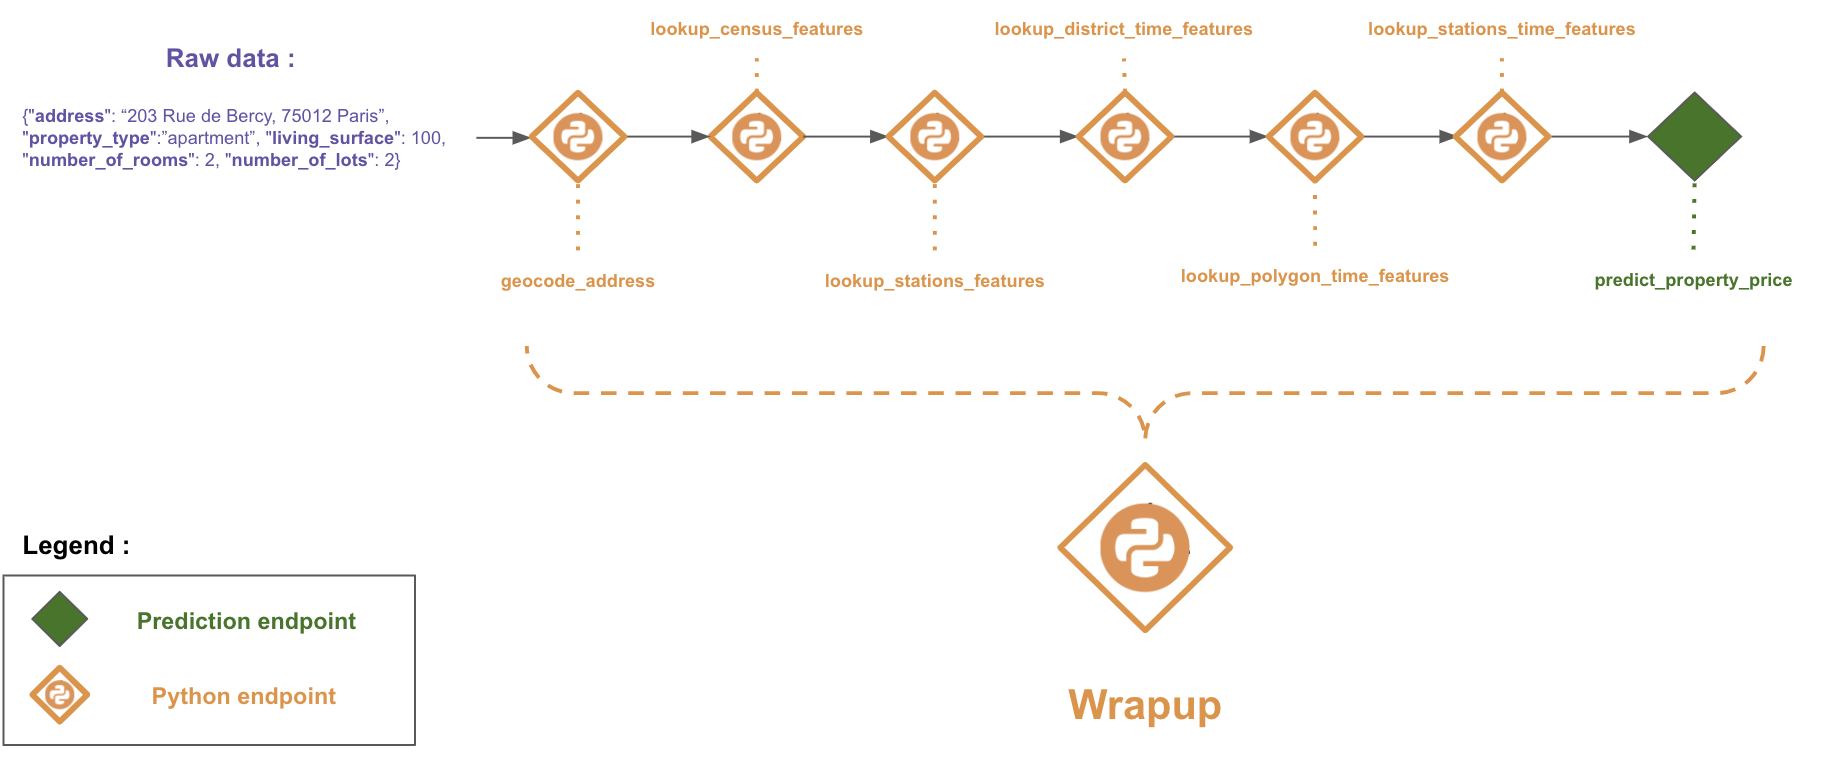
This solution has also been designed to show how a real estate pricing prediction project in DSS can be put into production via an API service. The API service is composed of 7 python endpoints and 1 prediction model endpoint. Each endpoint can be called separately by passing the required information as parameters. A final endpoint wrapup can be called with the property characteristics (address, propertytype, number of rooms, living surface, and number of lots). It enriches the data using all the endpoints before calling the prediction model endpoint to output a price prediction. It is not currently possible to use the API node as the backend prediction process within the Webapp.
Reproducing these Processes With Minimal Effort For Your Own Data
The intent of this project is to enable asset management teams to understand how Dataiku DSS can be used to predict the price of their existing property portfolios with publicly available data.
By creating a singular solution that can benefit and influence the decisions of a variety of teams in a single organization, smarter and more holistic strategies can be designed in order to reduce staff costs, achieve faster time-to-action, and more deeply integrate know-how.
We’ve provided several suggestions on how to use public data to predict the price of residential real estate but ultimately the “best” approach will depend on your specific needs and your data.
If you’re interested in adapting this project to the specific goals and needs of your organization, roll-out and customization services can be offered on demand.