How-To: Model Comparisons and Model Evaluation Stores
In search of the best performance, it is very common to iteratively build a range of models with different parameters. Then, in order to select the best model for one’s particular use case, one must be able to directly compare candidate models across key metrics side-by-side.
As data changes though, one must also continuously monitor and evaluate model performance to ensure the model is behaving as expected.
To serve these objectives, this tutorial provides a brief walkthrough of two key features in Dataiku: model comparisons and model evaluation stores.
The use case shown in the screenshots below is a simple credit card fraud use case. The Flow contains a binary classification model to predict which transactions will be authorized (labeled as “1”) and which will fail authorization (labeled as “0”).
Model Comparisons
Let’s walk through the process for creating a model comparison, interpreting its information, and using it to select a champion model.
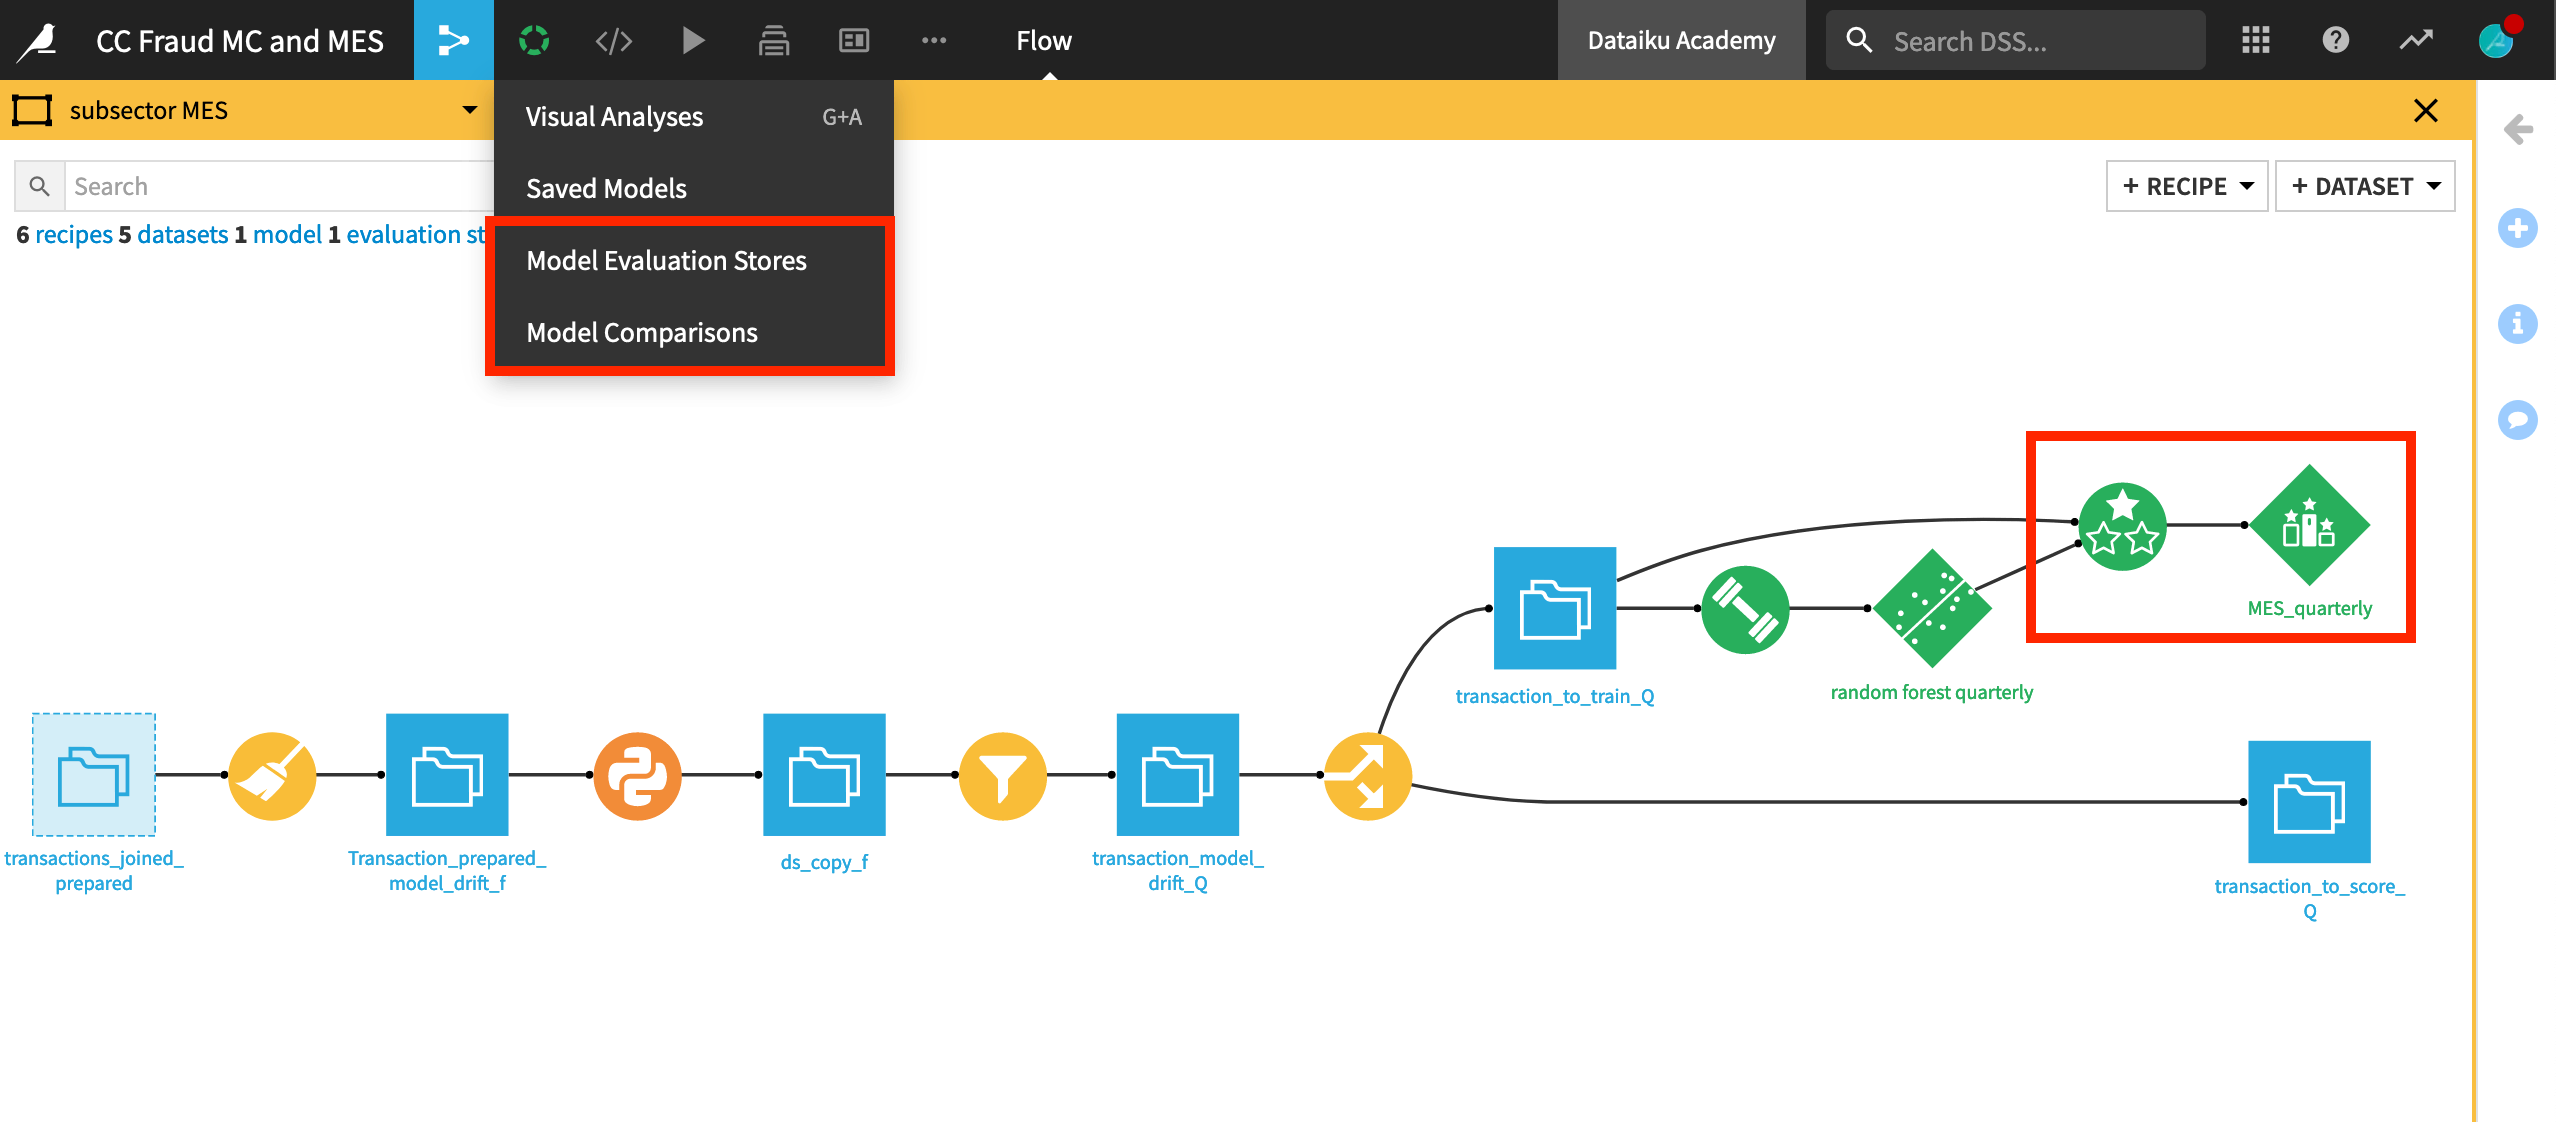
Creating a Model Comparison
You can create a model comparison by selecting models from:
Saved model versions from the Flow,
Lab models,
Evaluations from model evaluation stores.
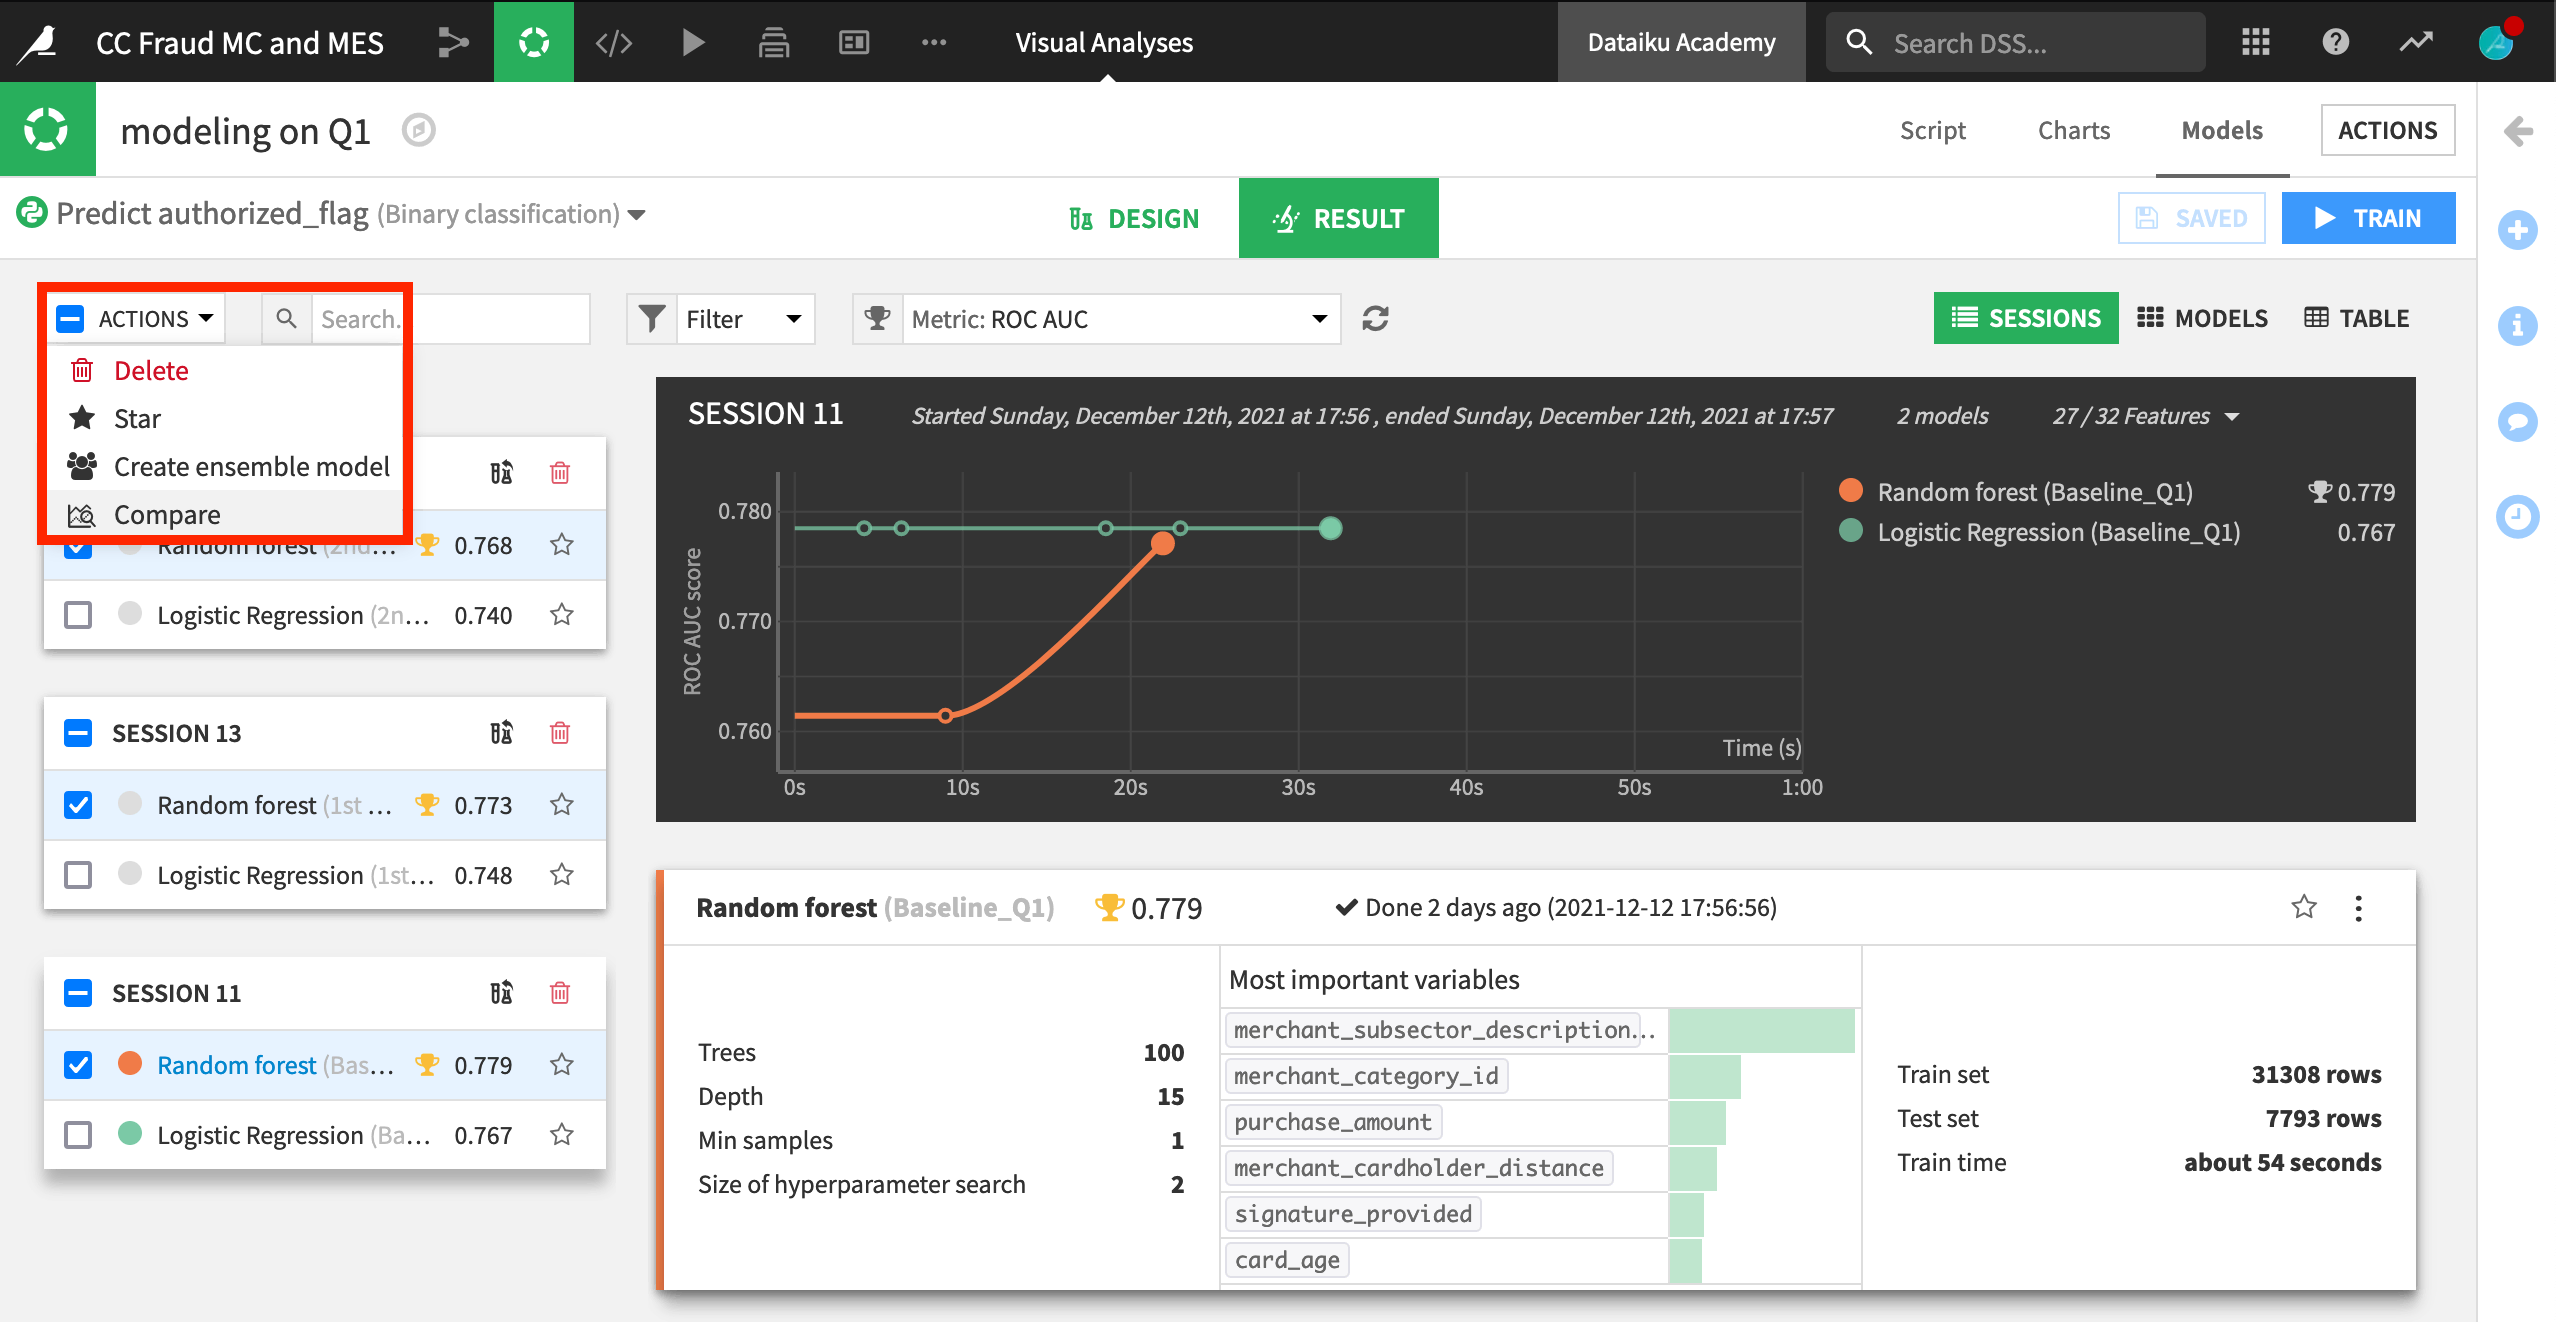
Dataiku users will be familiar with the Models page of a visual analysis. In the screenshot below, we have trained many models, but want to compare random forest models from three different sessions side-by-side.
From the Results tab of the Models page within a visual analysis, check the box of the models you want to compare, and then select Compare from the Actions menu.
You have the option of comparing the models in a new or an existing comparison. We’ll choose new and click Compare.
Using a Model Comparison
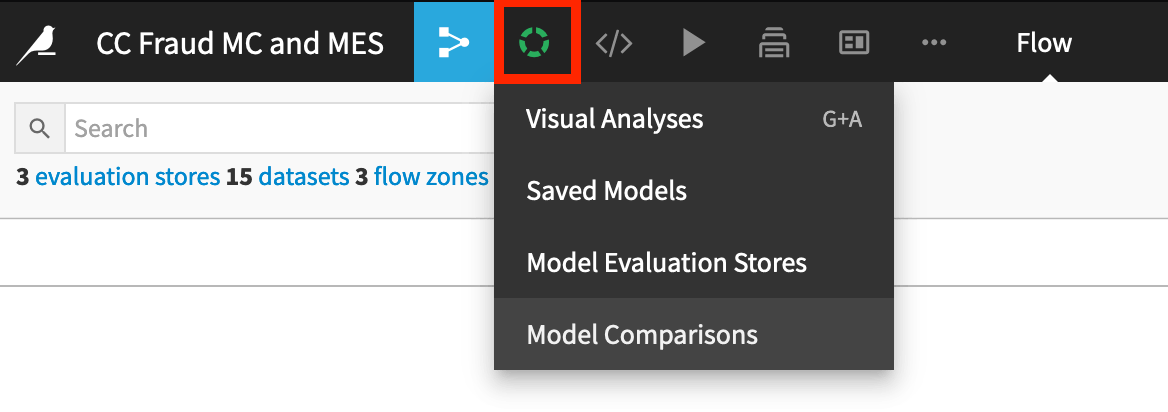
Once a Model Comparison has been created, it can be accessed at any time from the top navigation bar in the Visual analysis > Model Comparisons page.
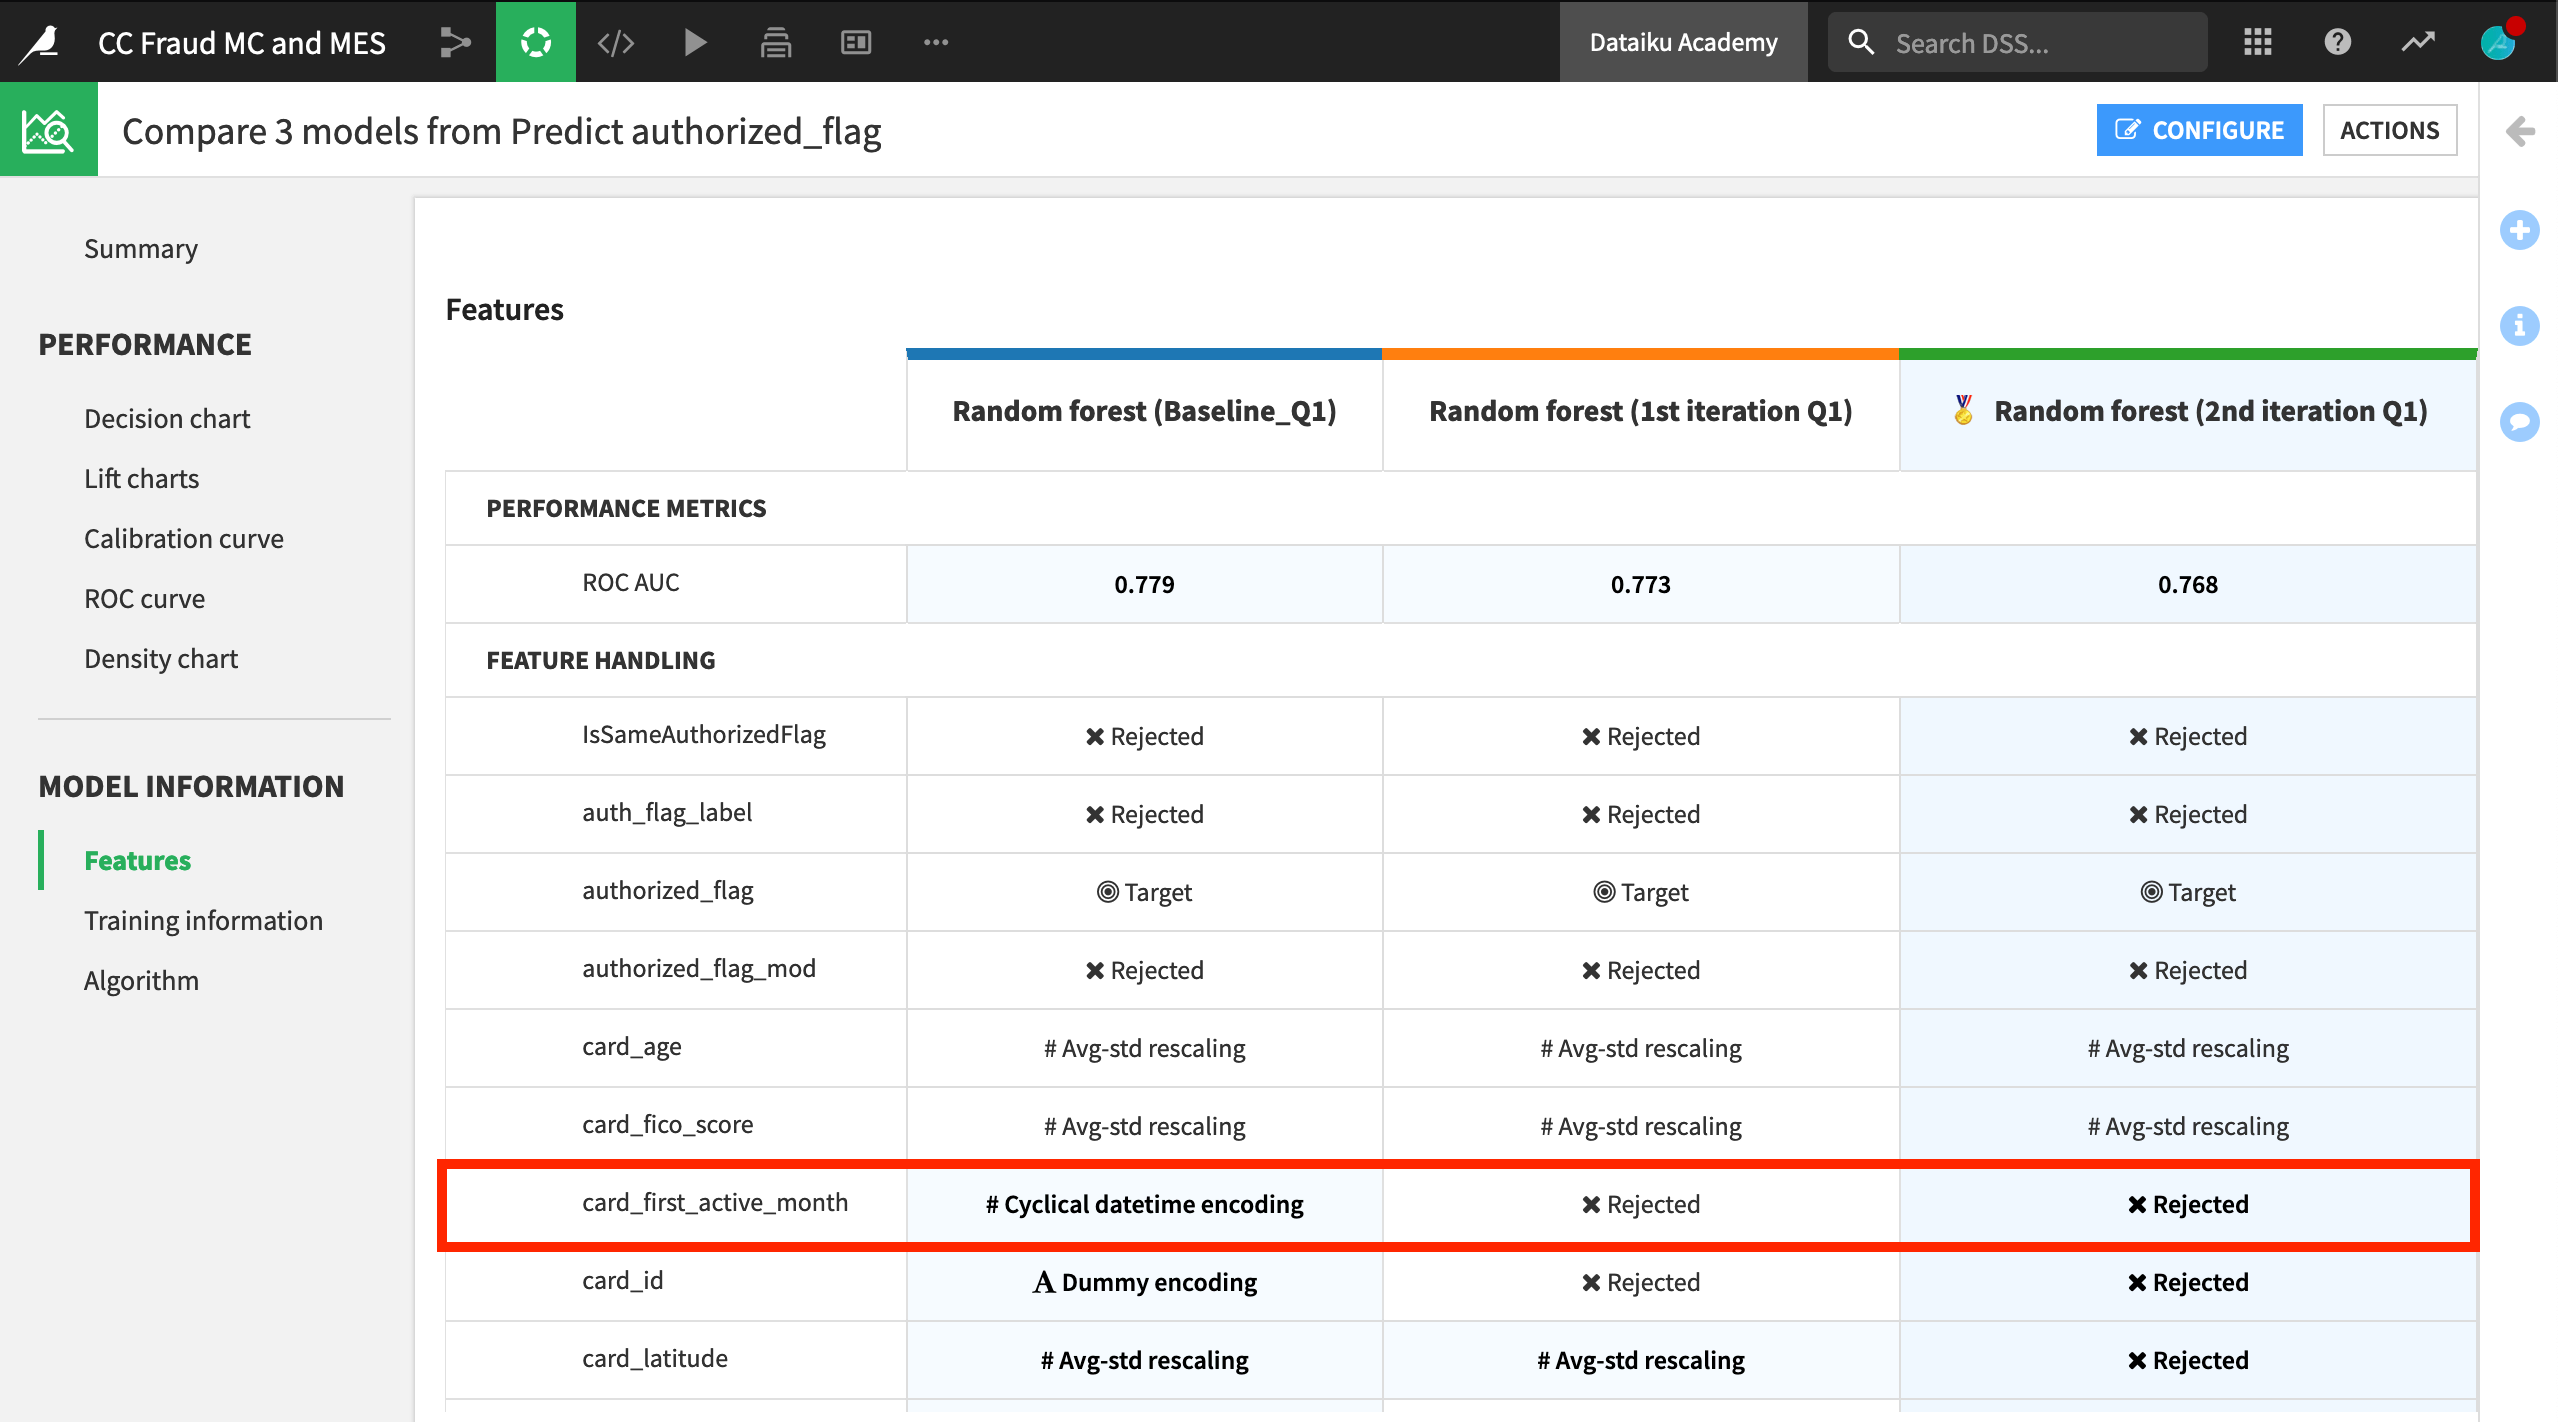
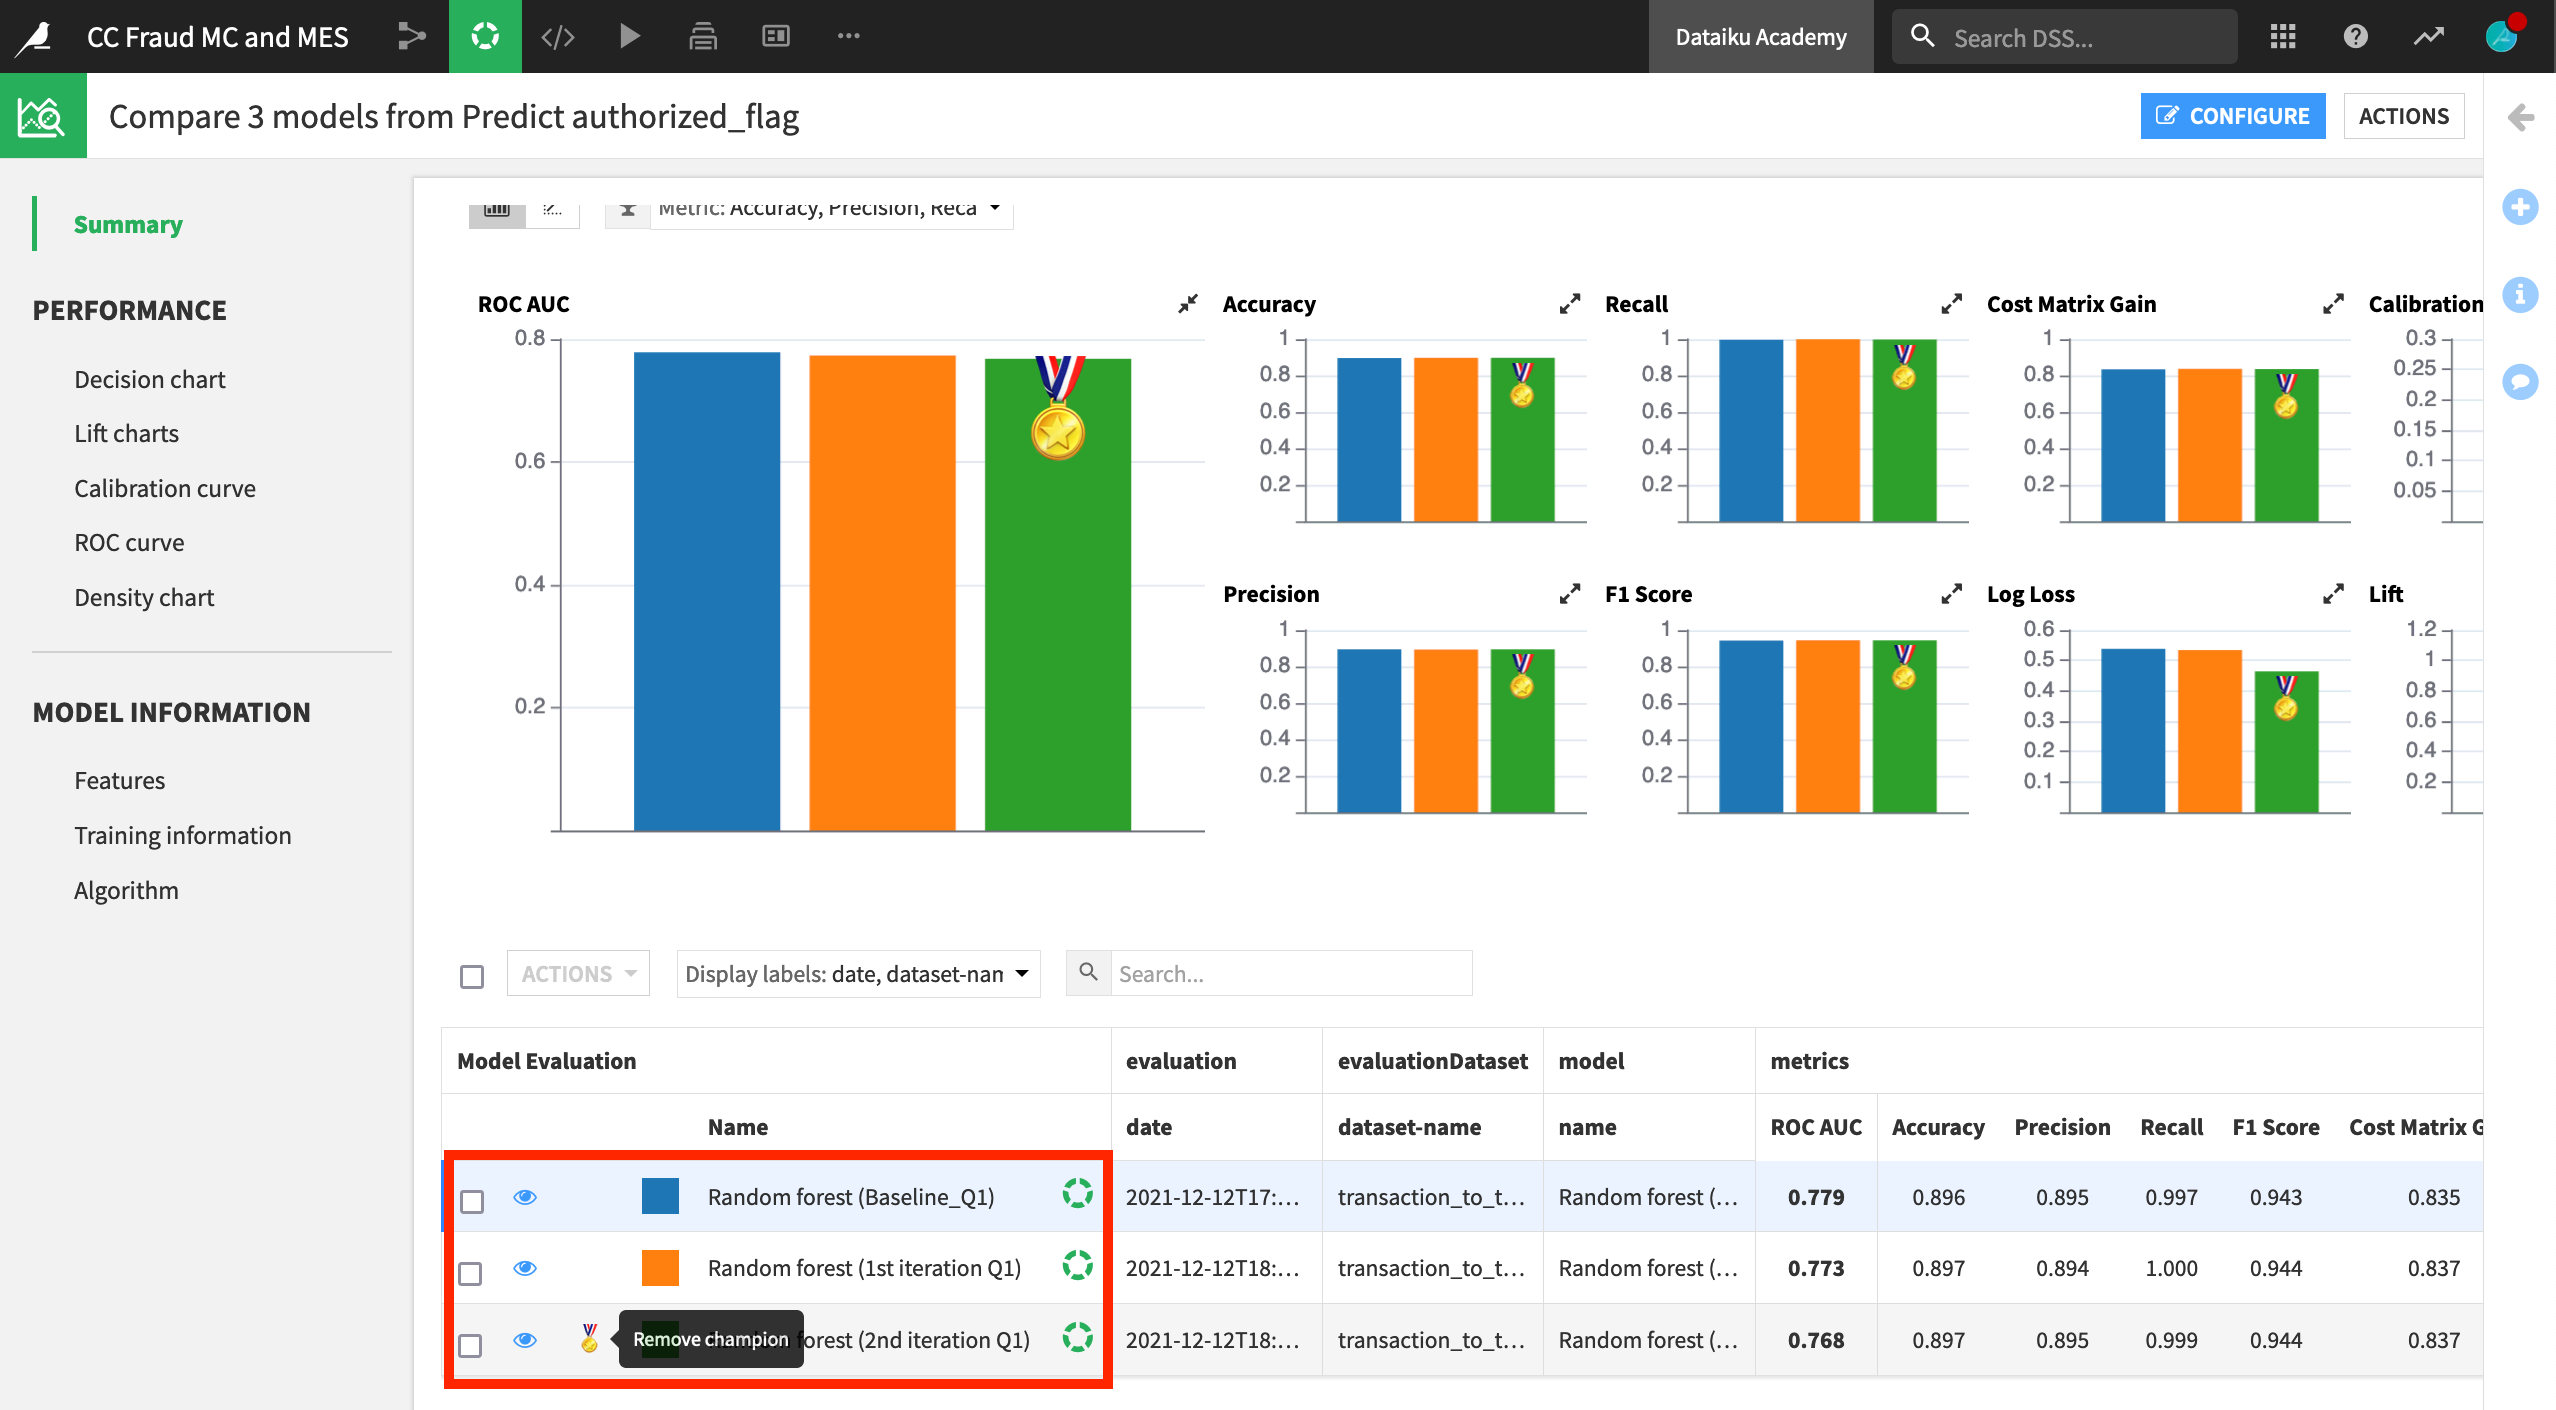
A model comparison includes key information not only about the performance of the chosen models, but also training information and feature handling.
For example, you can see that the baseline model included certain features, such as card_active_first_month, which were rejected in the other two candidate models.
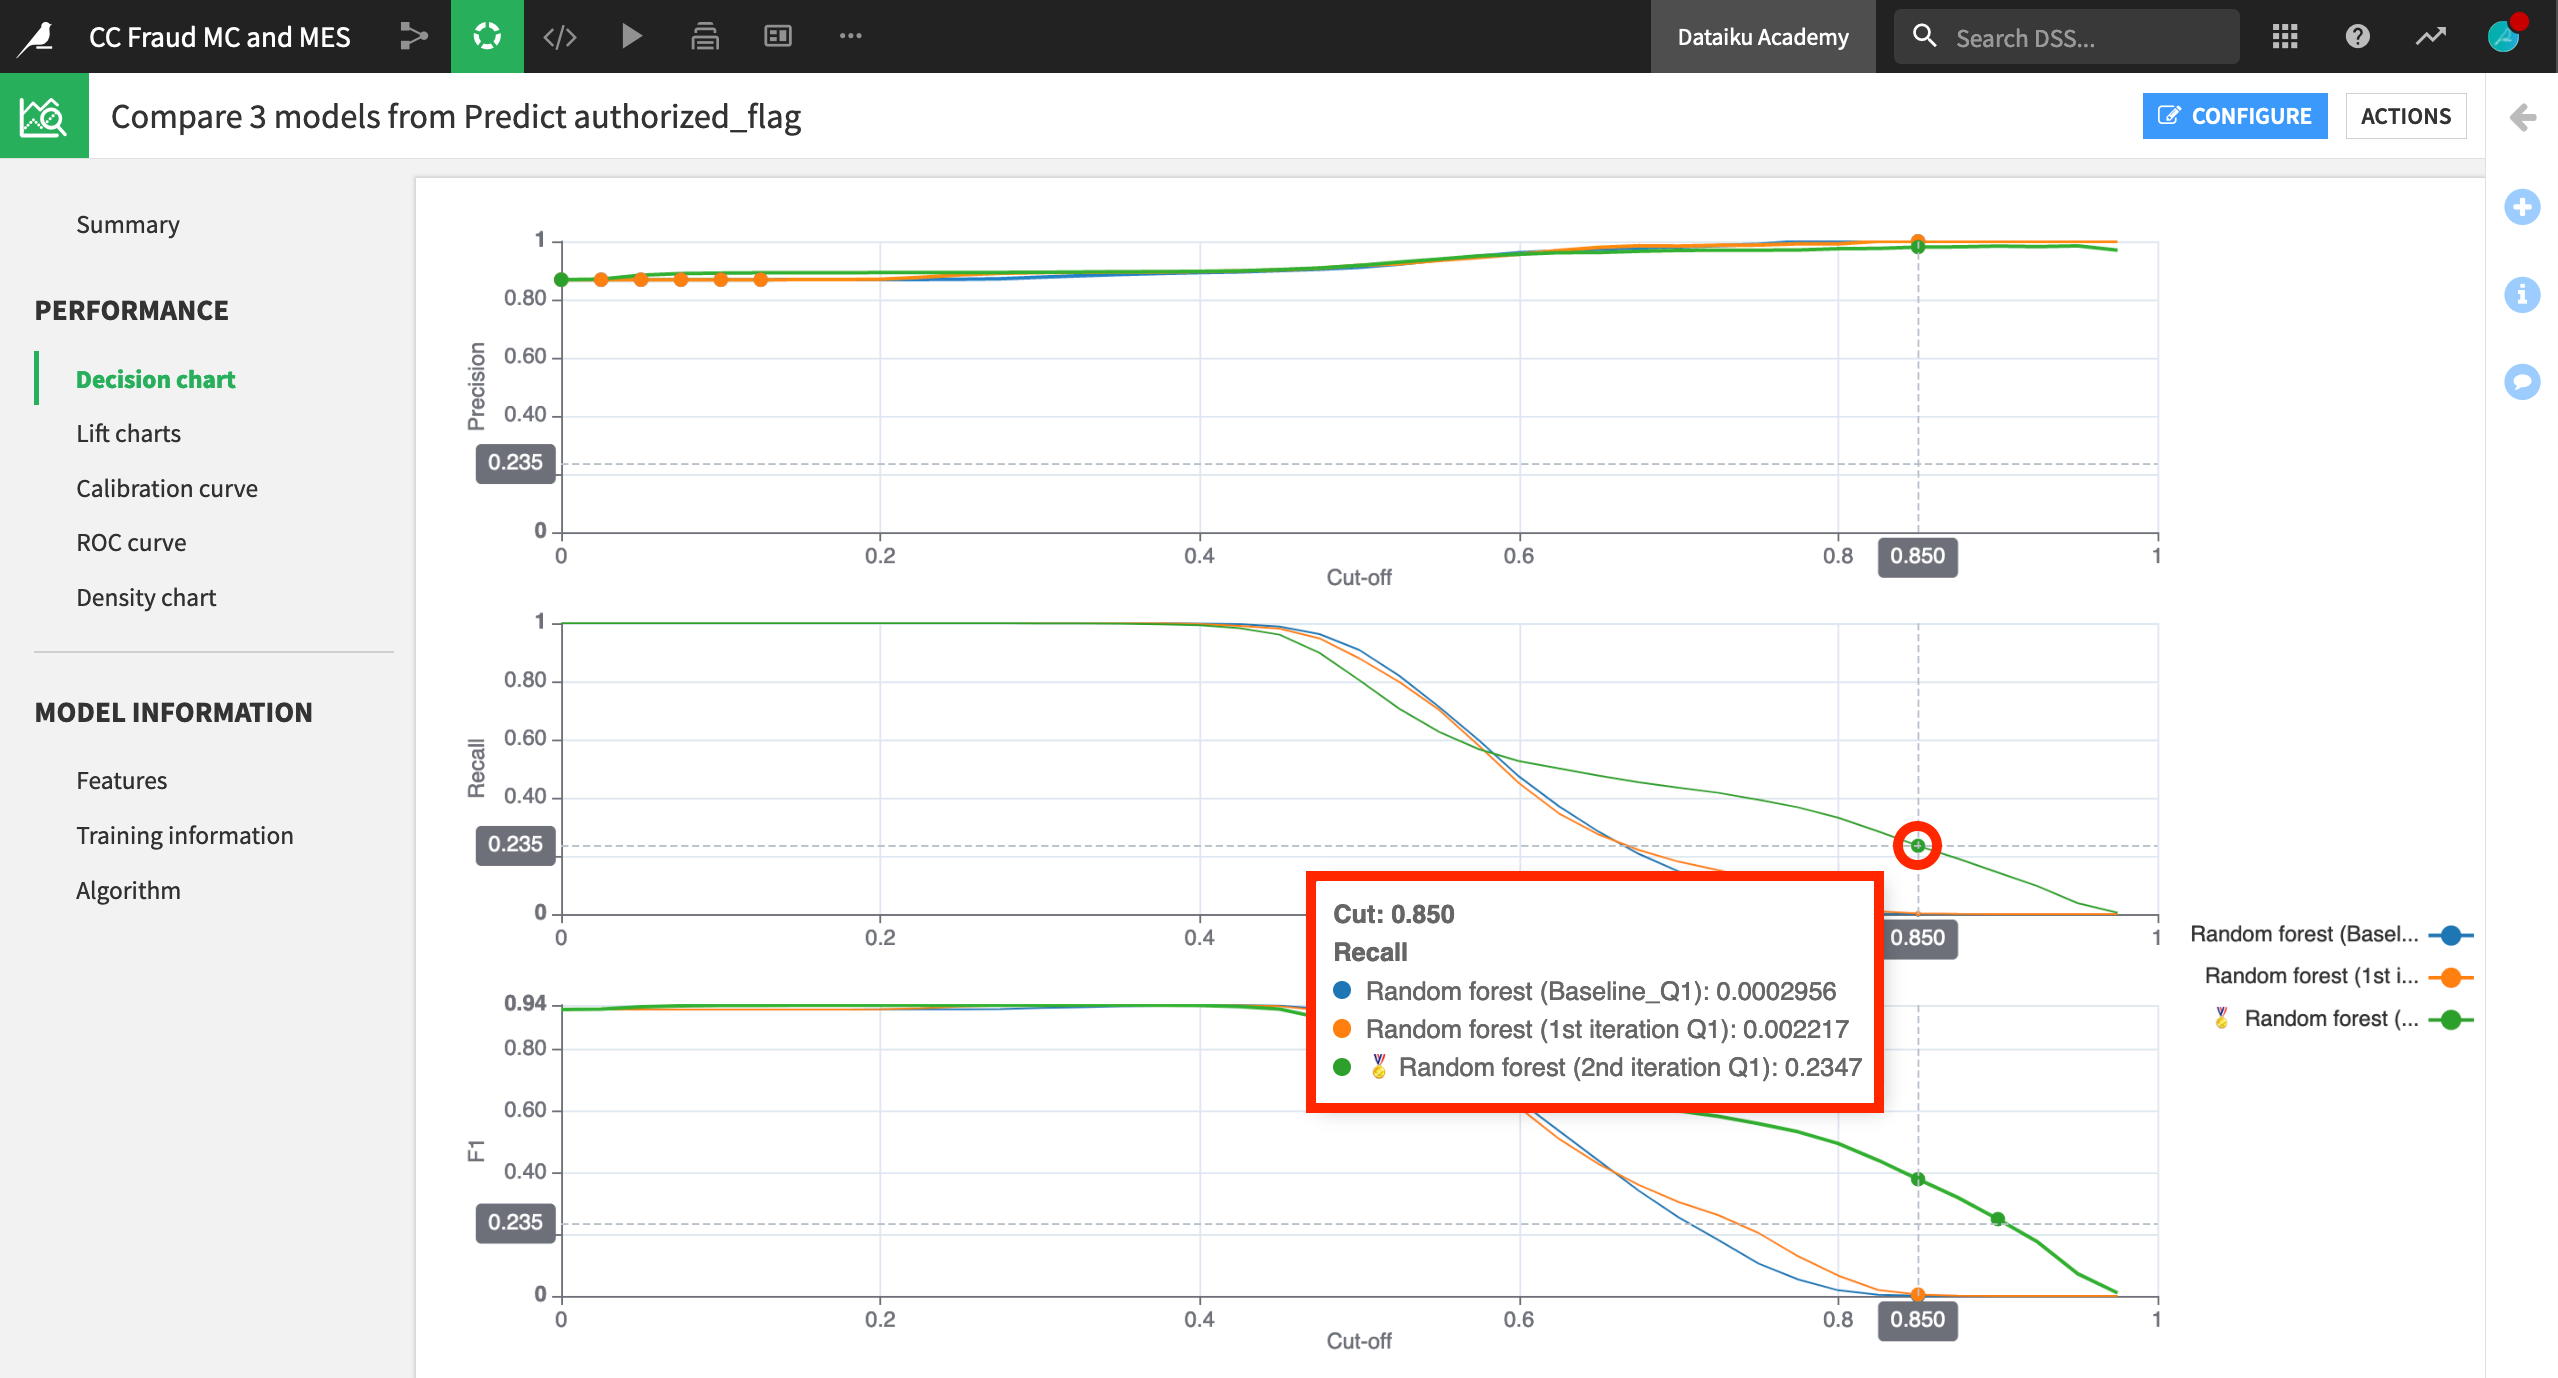
Many of the same kind of performance visualizations found for any individual model in the Lab can now be compared side-by-side. For example, below is a decision chart showing precision, recall, and F1 scores for the three candidate models.
Choosing a Champion
Comparing performance metrics side-by-side makes it easier to choose a champion model.
For detecting credit card fraud (where a fraudulent transaction is labeled as “0” and an authorized transaction is labeled as “1” ), having a high precision, which would minimize the number of false positives, may be the most valuable metric. Among these three candidates, the precision metric is quite similar. Therefore, let’s choose the “2nd iteration” model in green, which has the highest recall when precision is also high.
In the Summary pane of the Model Comparison, click to assign or remove the champion status from any model.
Note
In other situations, the saved model deployed to the Flow may already be the current champion. In that case, you can also use the model comparison feature to evaluate the champion against possible challenger models being developed in the Lab.
Model Evaluation Stores
Of course comparing models at one point in time can only get us so far. As we receive new data, we need to continuously evaluate whether our model is still performing well.
In the above screenshots, we trained a model on Q1 data. However, for the purposes of this example, we now have transaction data from quarters 2, 3, and 4. We can use a model evaluation store to monitor the performance of a model as the input data changes.
For more context, see this video introducing model evaluation stores.
Create an Evaluate Recipe
The first step to evaluating a model in Dataiku is to create an Evaluate recipe, which requires two inputs: a saved model deployed to the Flow and an evaluation dataset.
This recipe can have up to three outputs:
An output dataset containing the input features, predictions, and correctness of predictions;
A metrics dataset containing one row of performance metrics for each run of the Evaluate recipe;
And/or a model evaluation store, which contains the same performance metrics, but also visualizes them and offers the familiar status checks for monitoring purposes.
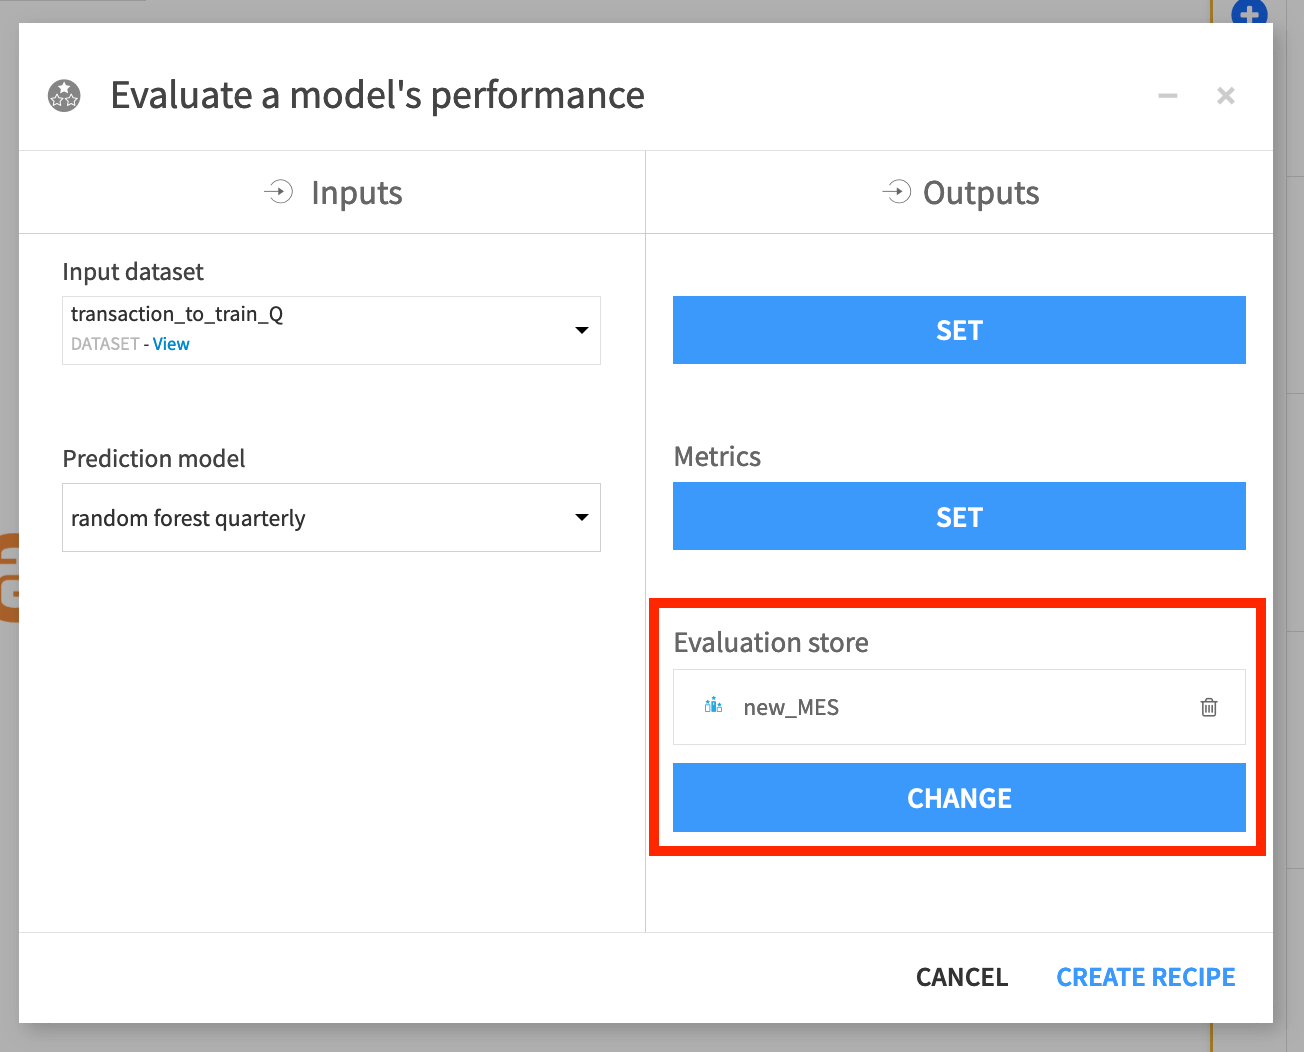
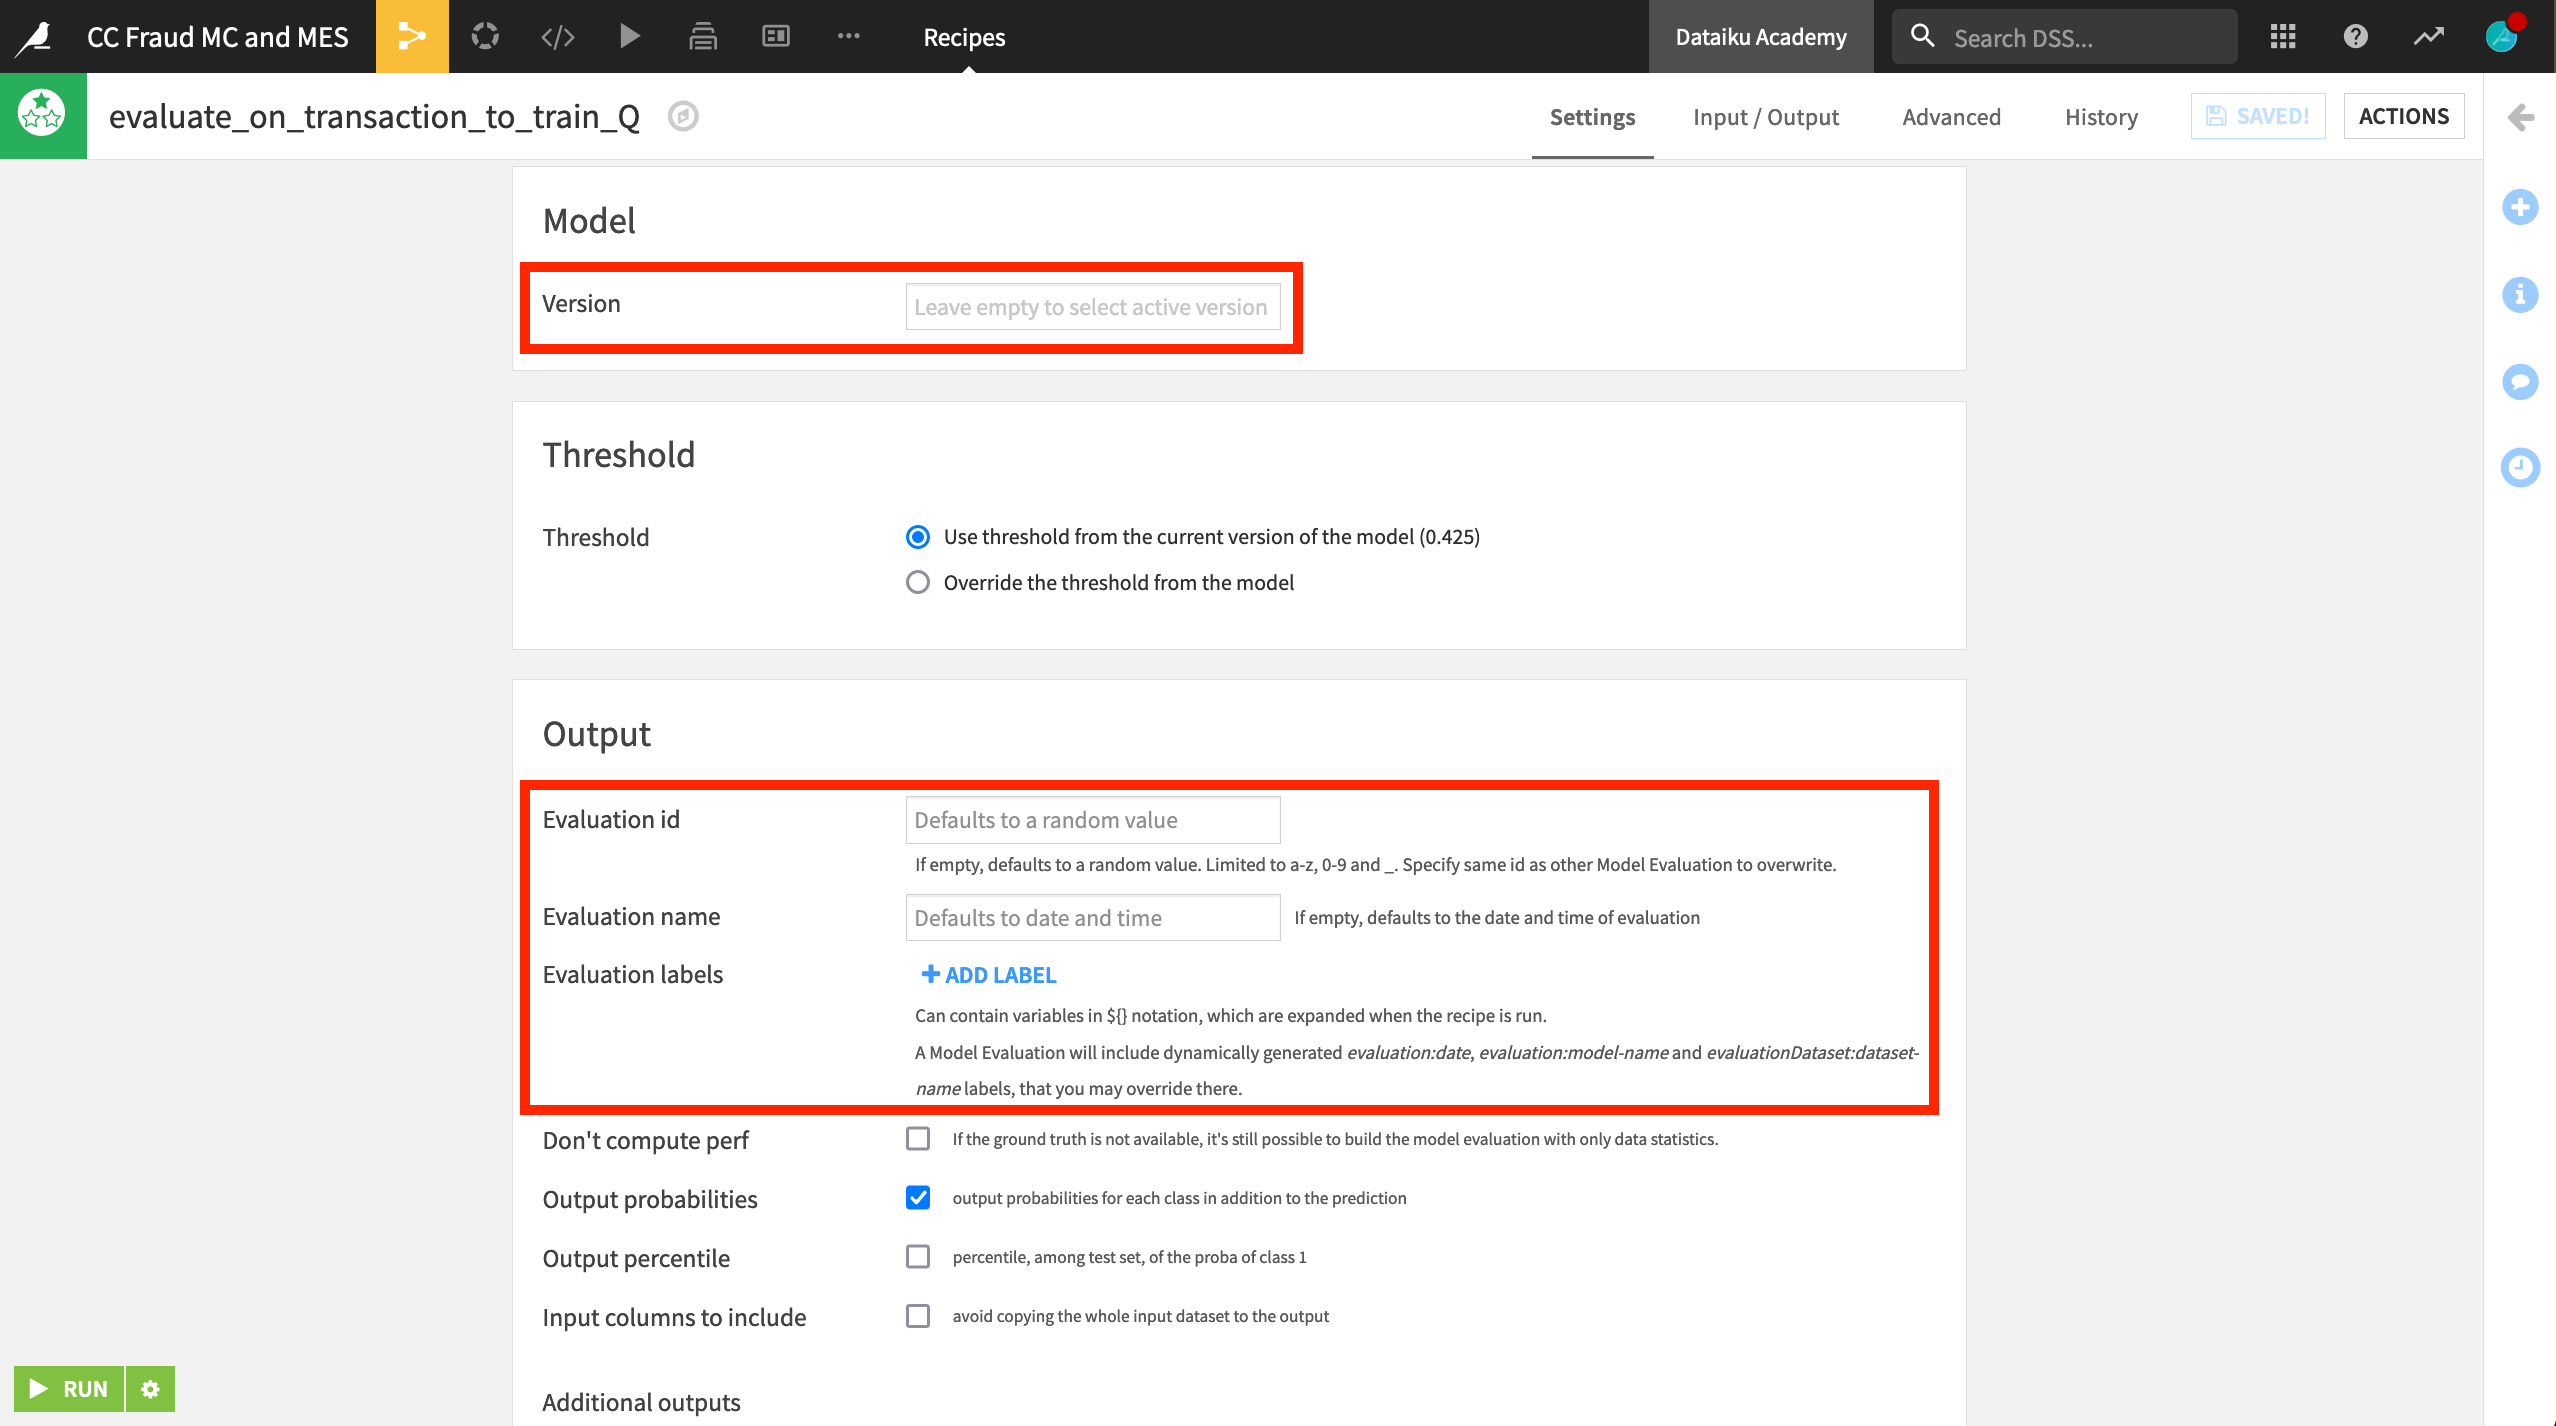
We’ll also keep the default settings for the Evaluate recipe.
We want to evaluate the active version of the saved model, and so we leave the model version field empty.
We could also give the evaluation a more human readable name, but the default date and time is sufficient here.
Explore the Model Evaluation Store
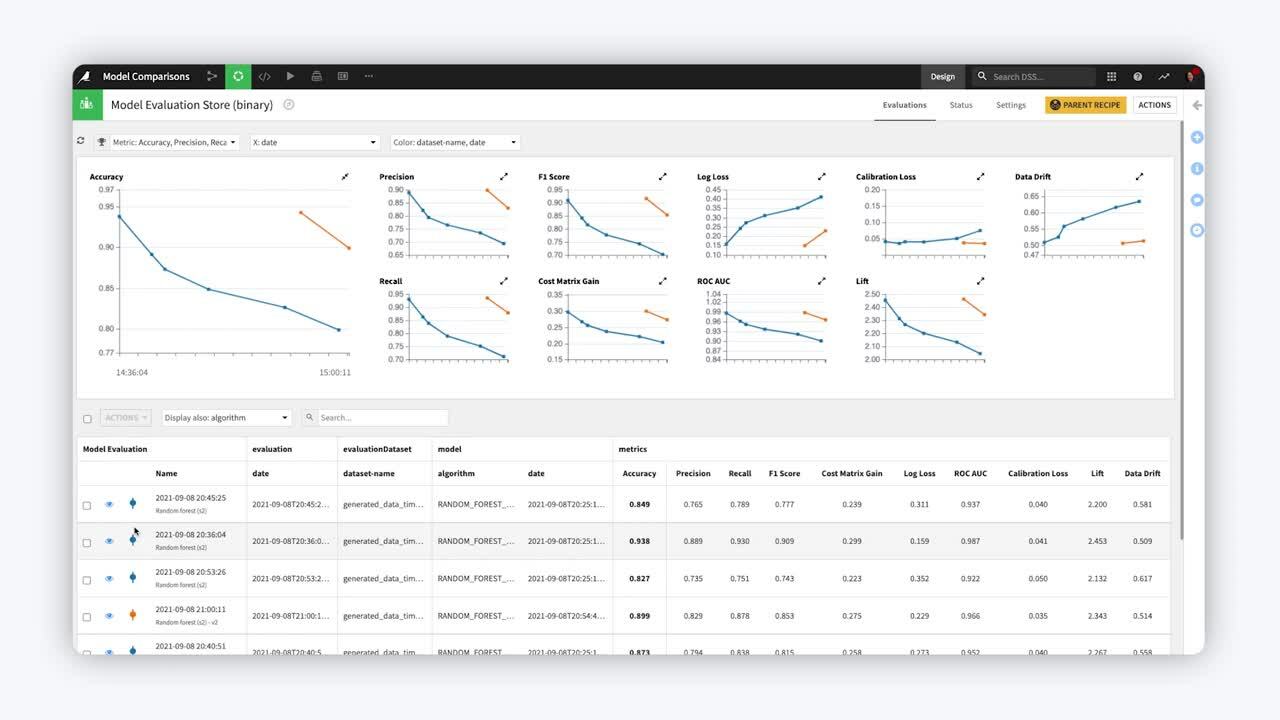
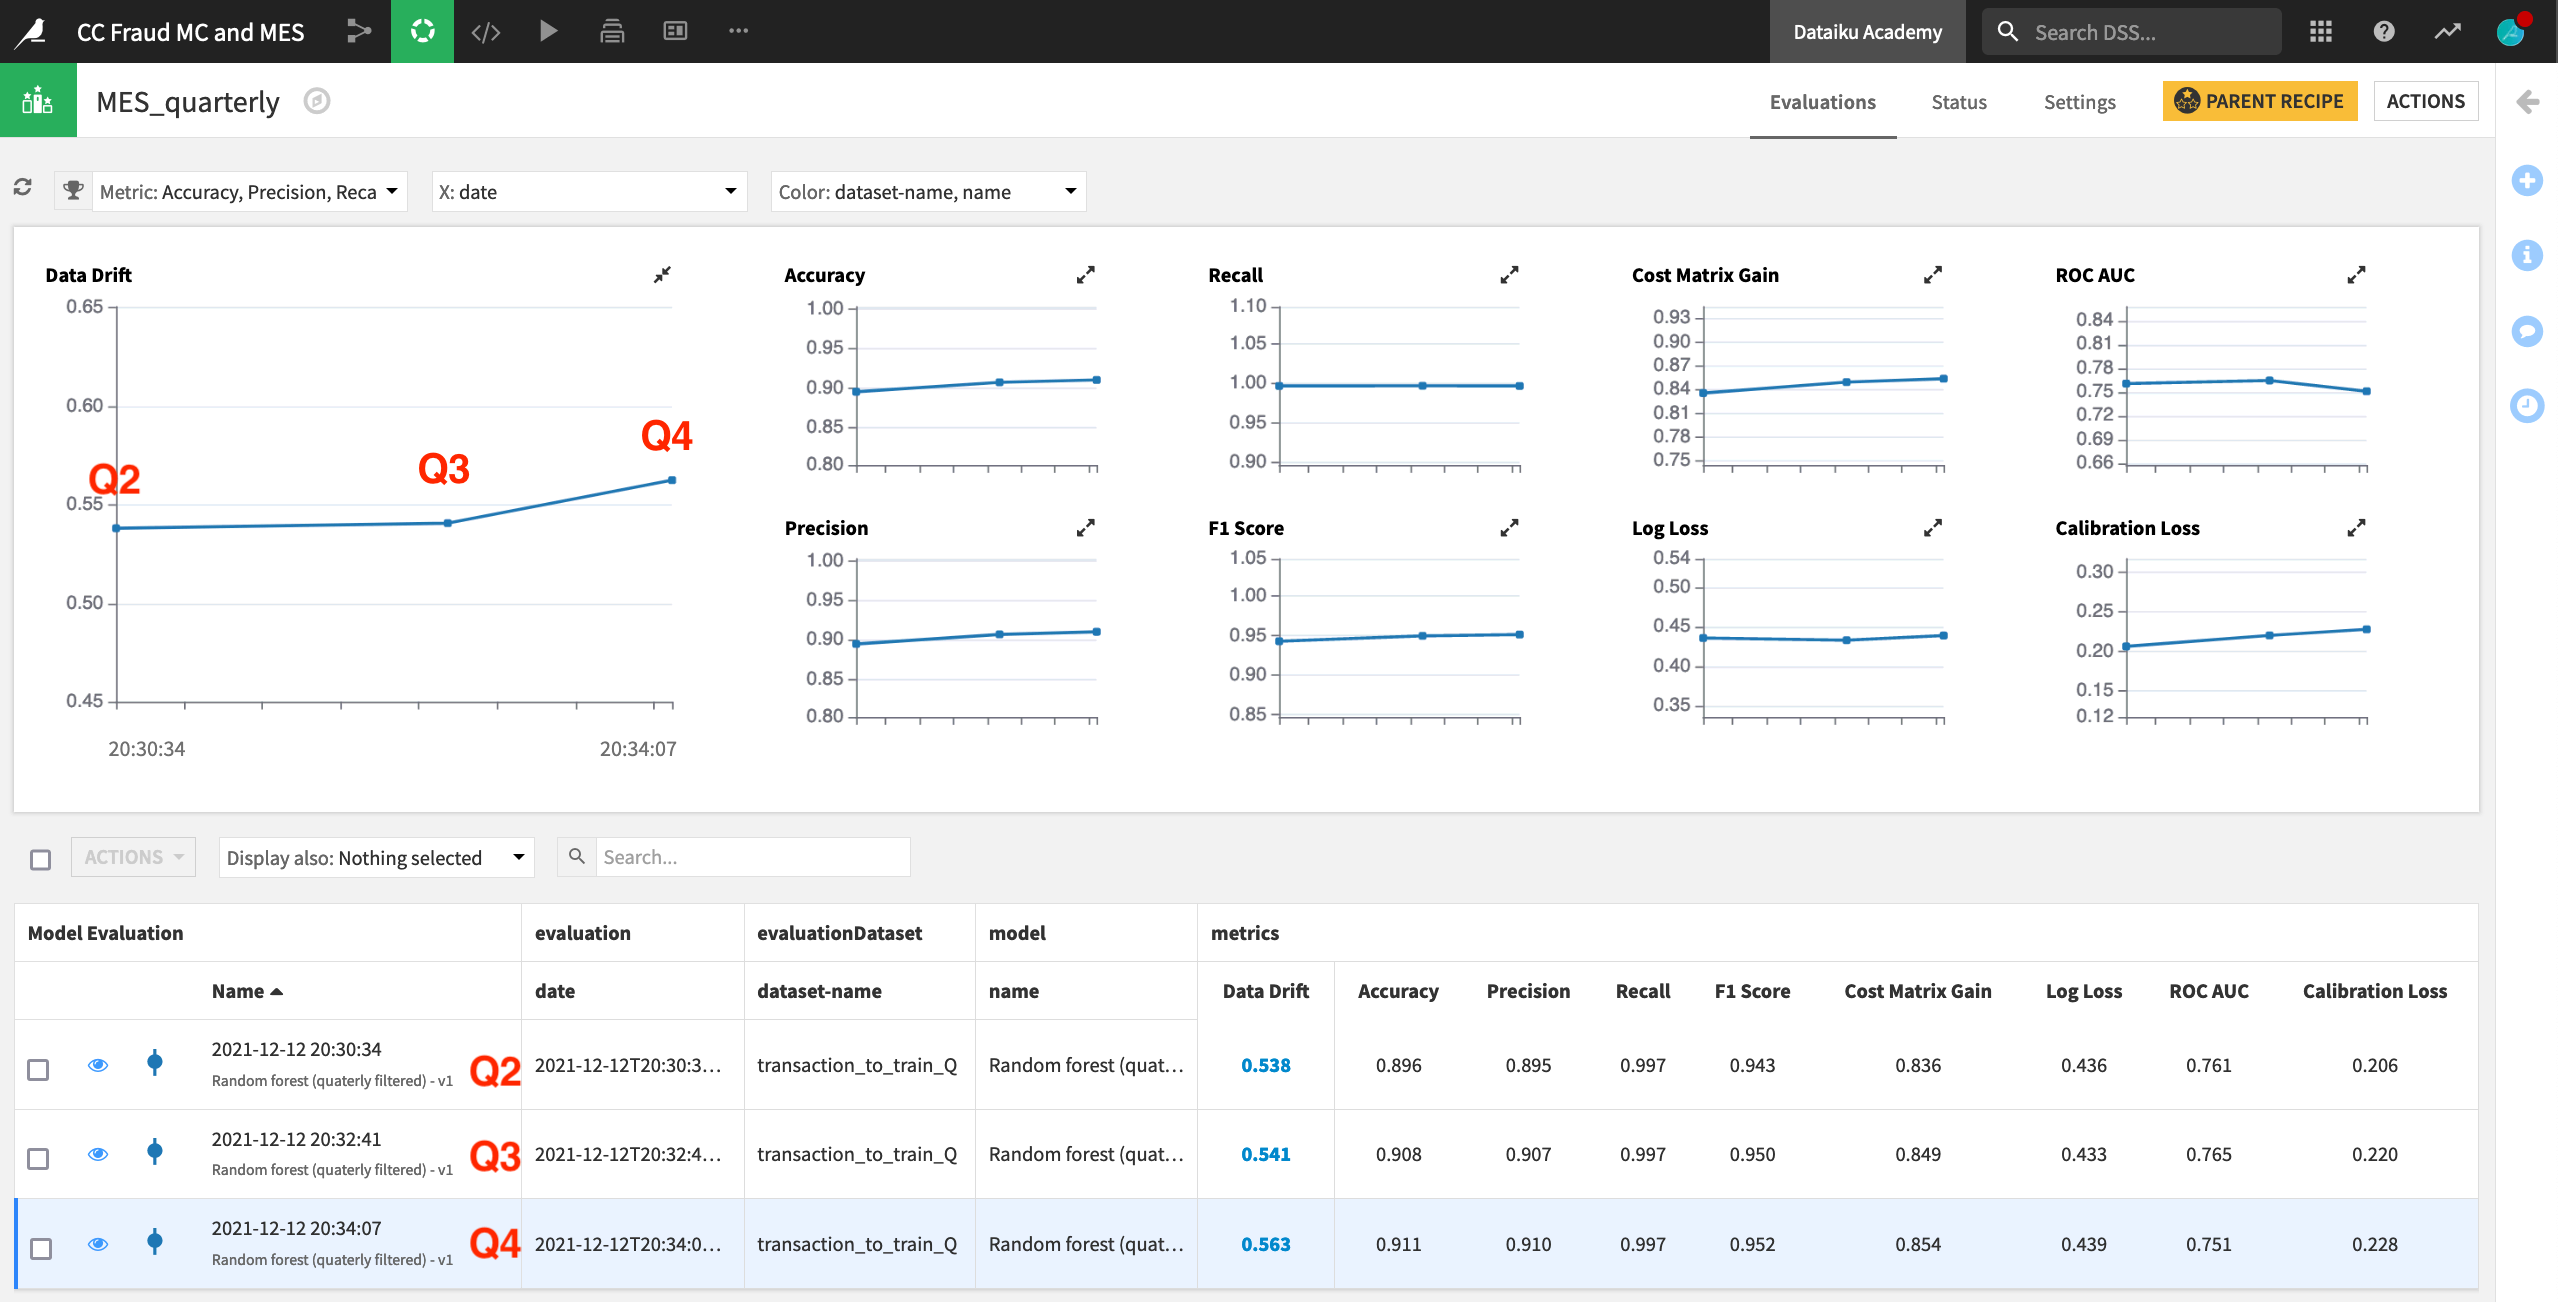
In this example, we have run the Evaluate recipe three times. For each run, the prediction model trained on Q1 data remained the same. However, the contents of the input dataset transaction_to_train_Q were changed to Q2, Q3, and finally Q4 data.
After running the recipe on three subsequent quarters of data, we can begin to see the model degrade in the model evaluation store. Data drift, particularly for Q4, is increasing, and ROC AUC is decreasing.
View Drift Analysis
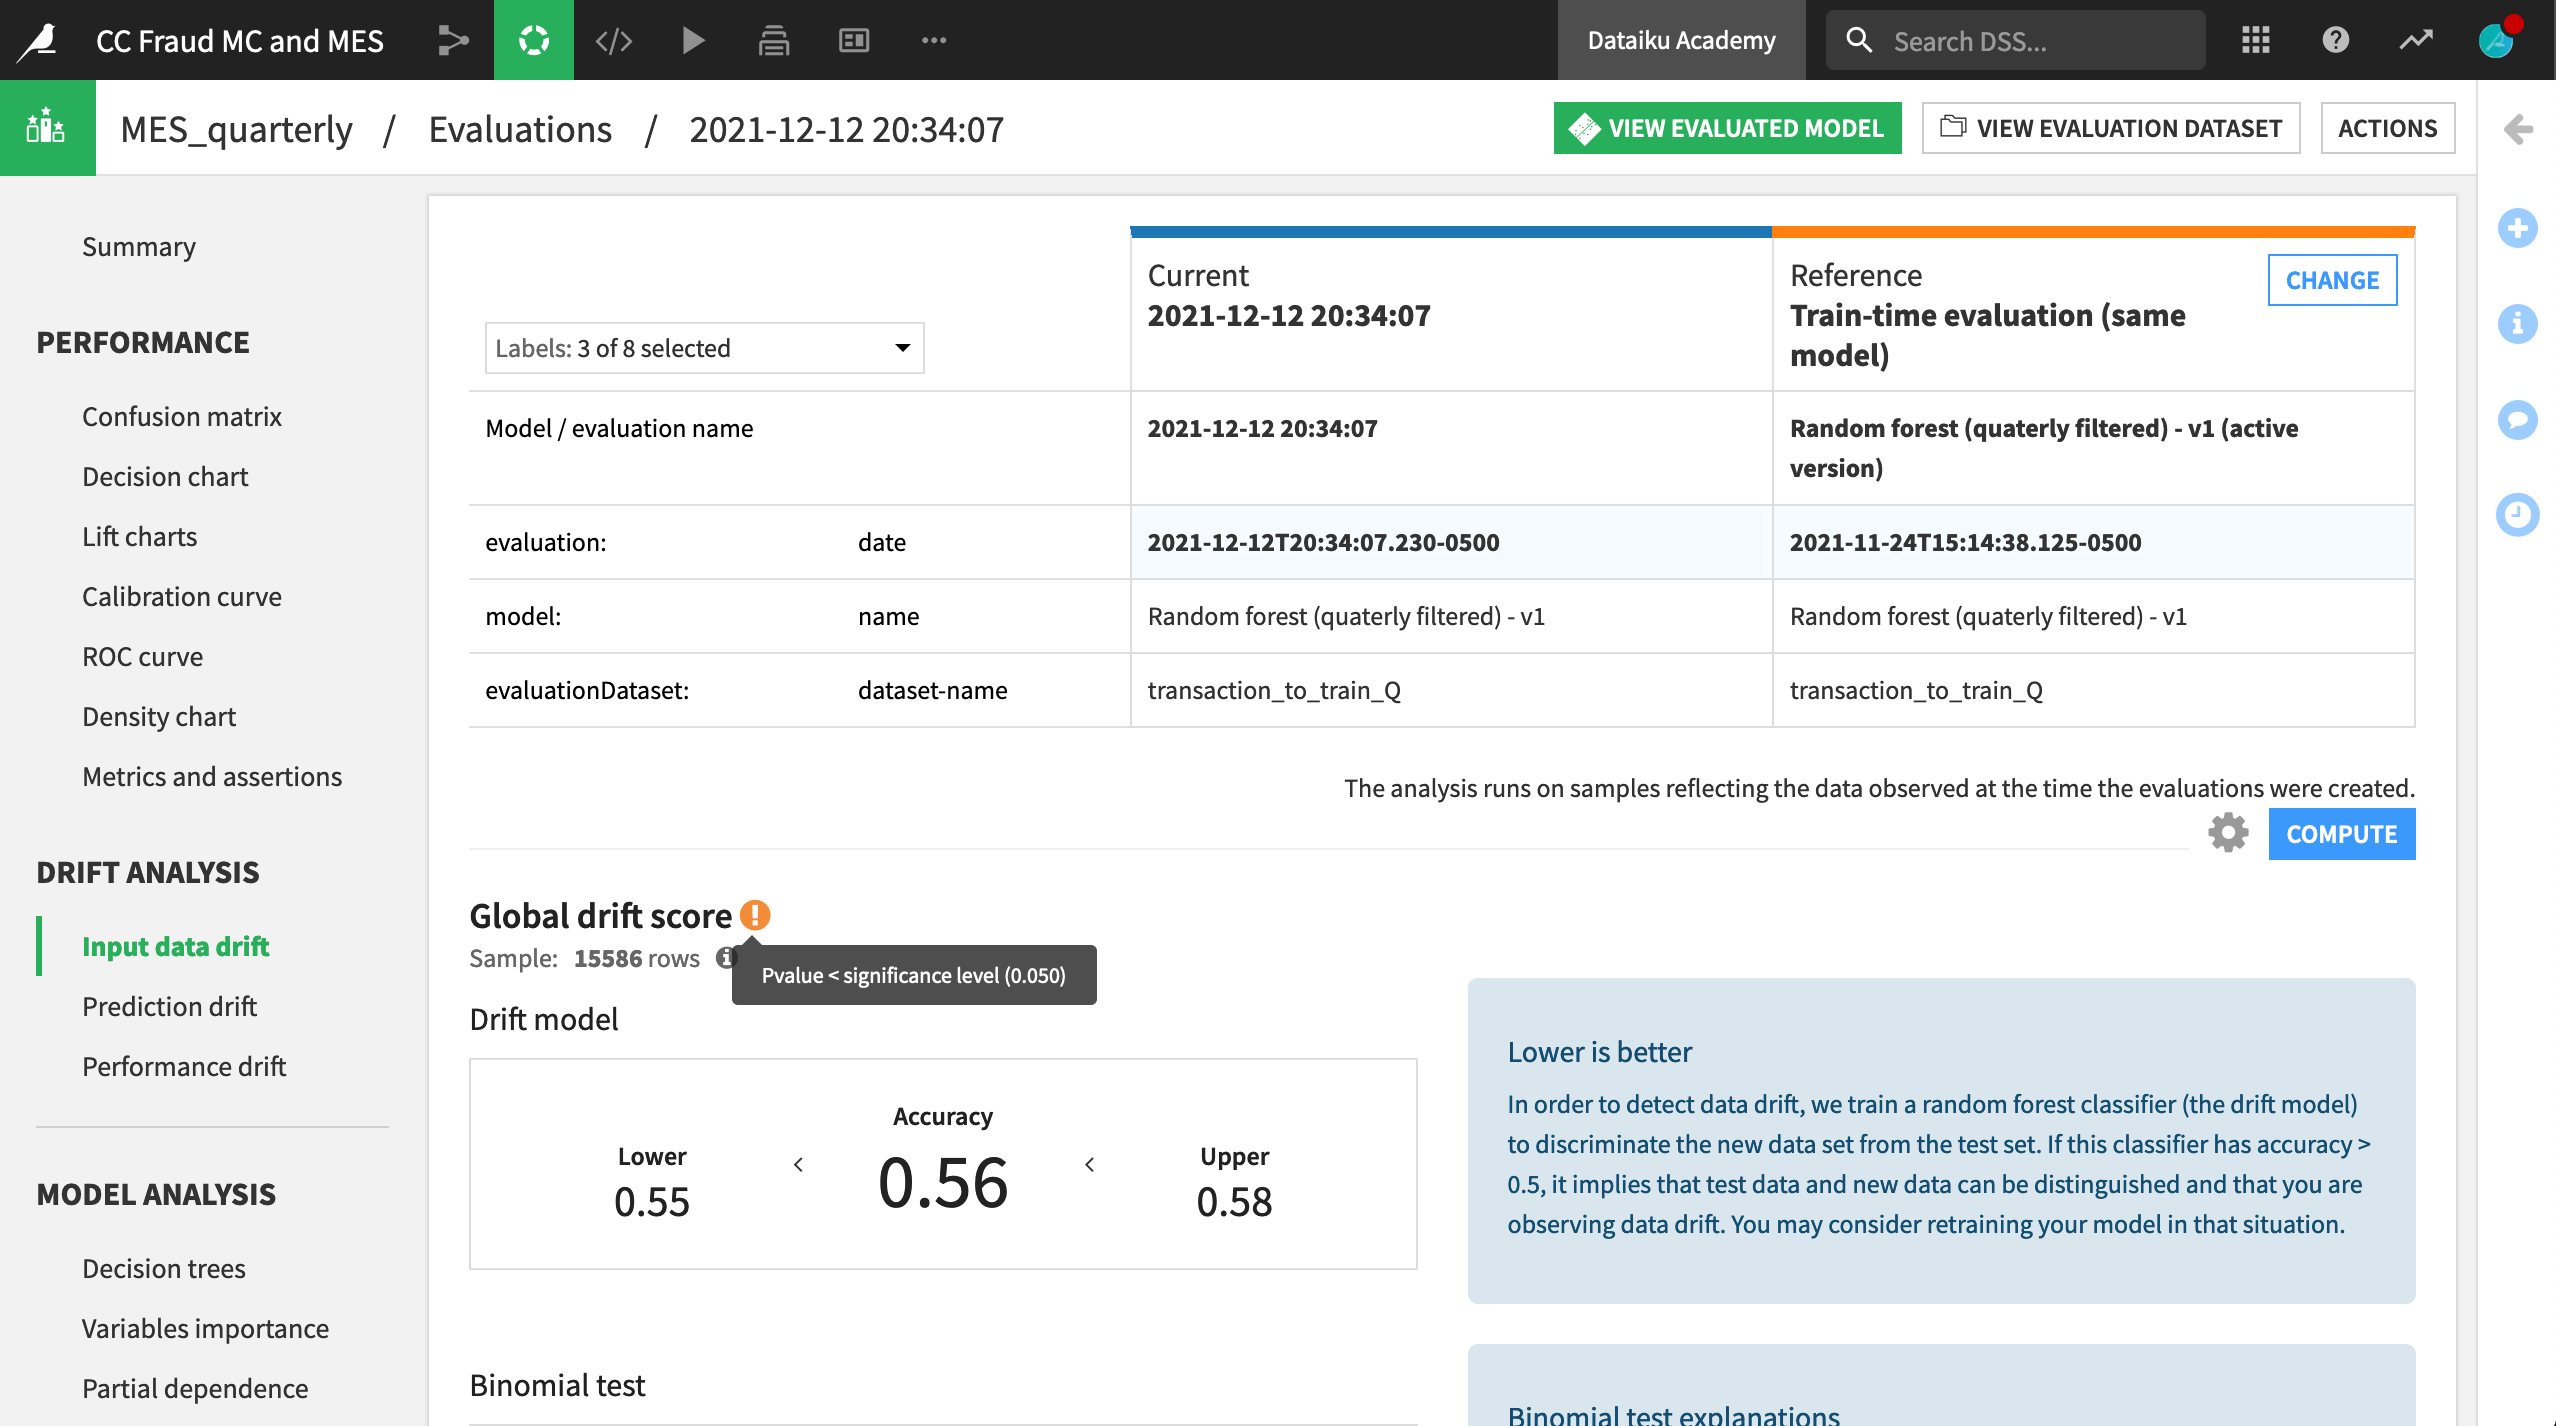
In addition to the summary view above, we can take a closer look at any individual run by clicking on its row. When we open the third row containing the Q4 input data, we find all of the necessary model information and performance metrics found in the Lab, but there is also a Drift Analysis section.
The input data drift section reports the extent to which a random forest classifier is able to distinguish between the test set from the original reference data (Q1) and the new data (Q4). In this case, we clearly have input data drift, and may need to retrain the model.
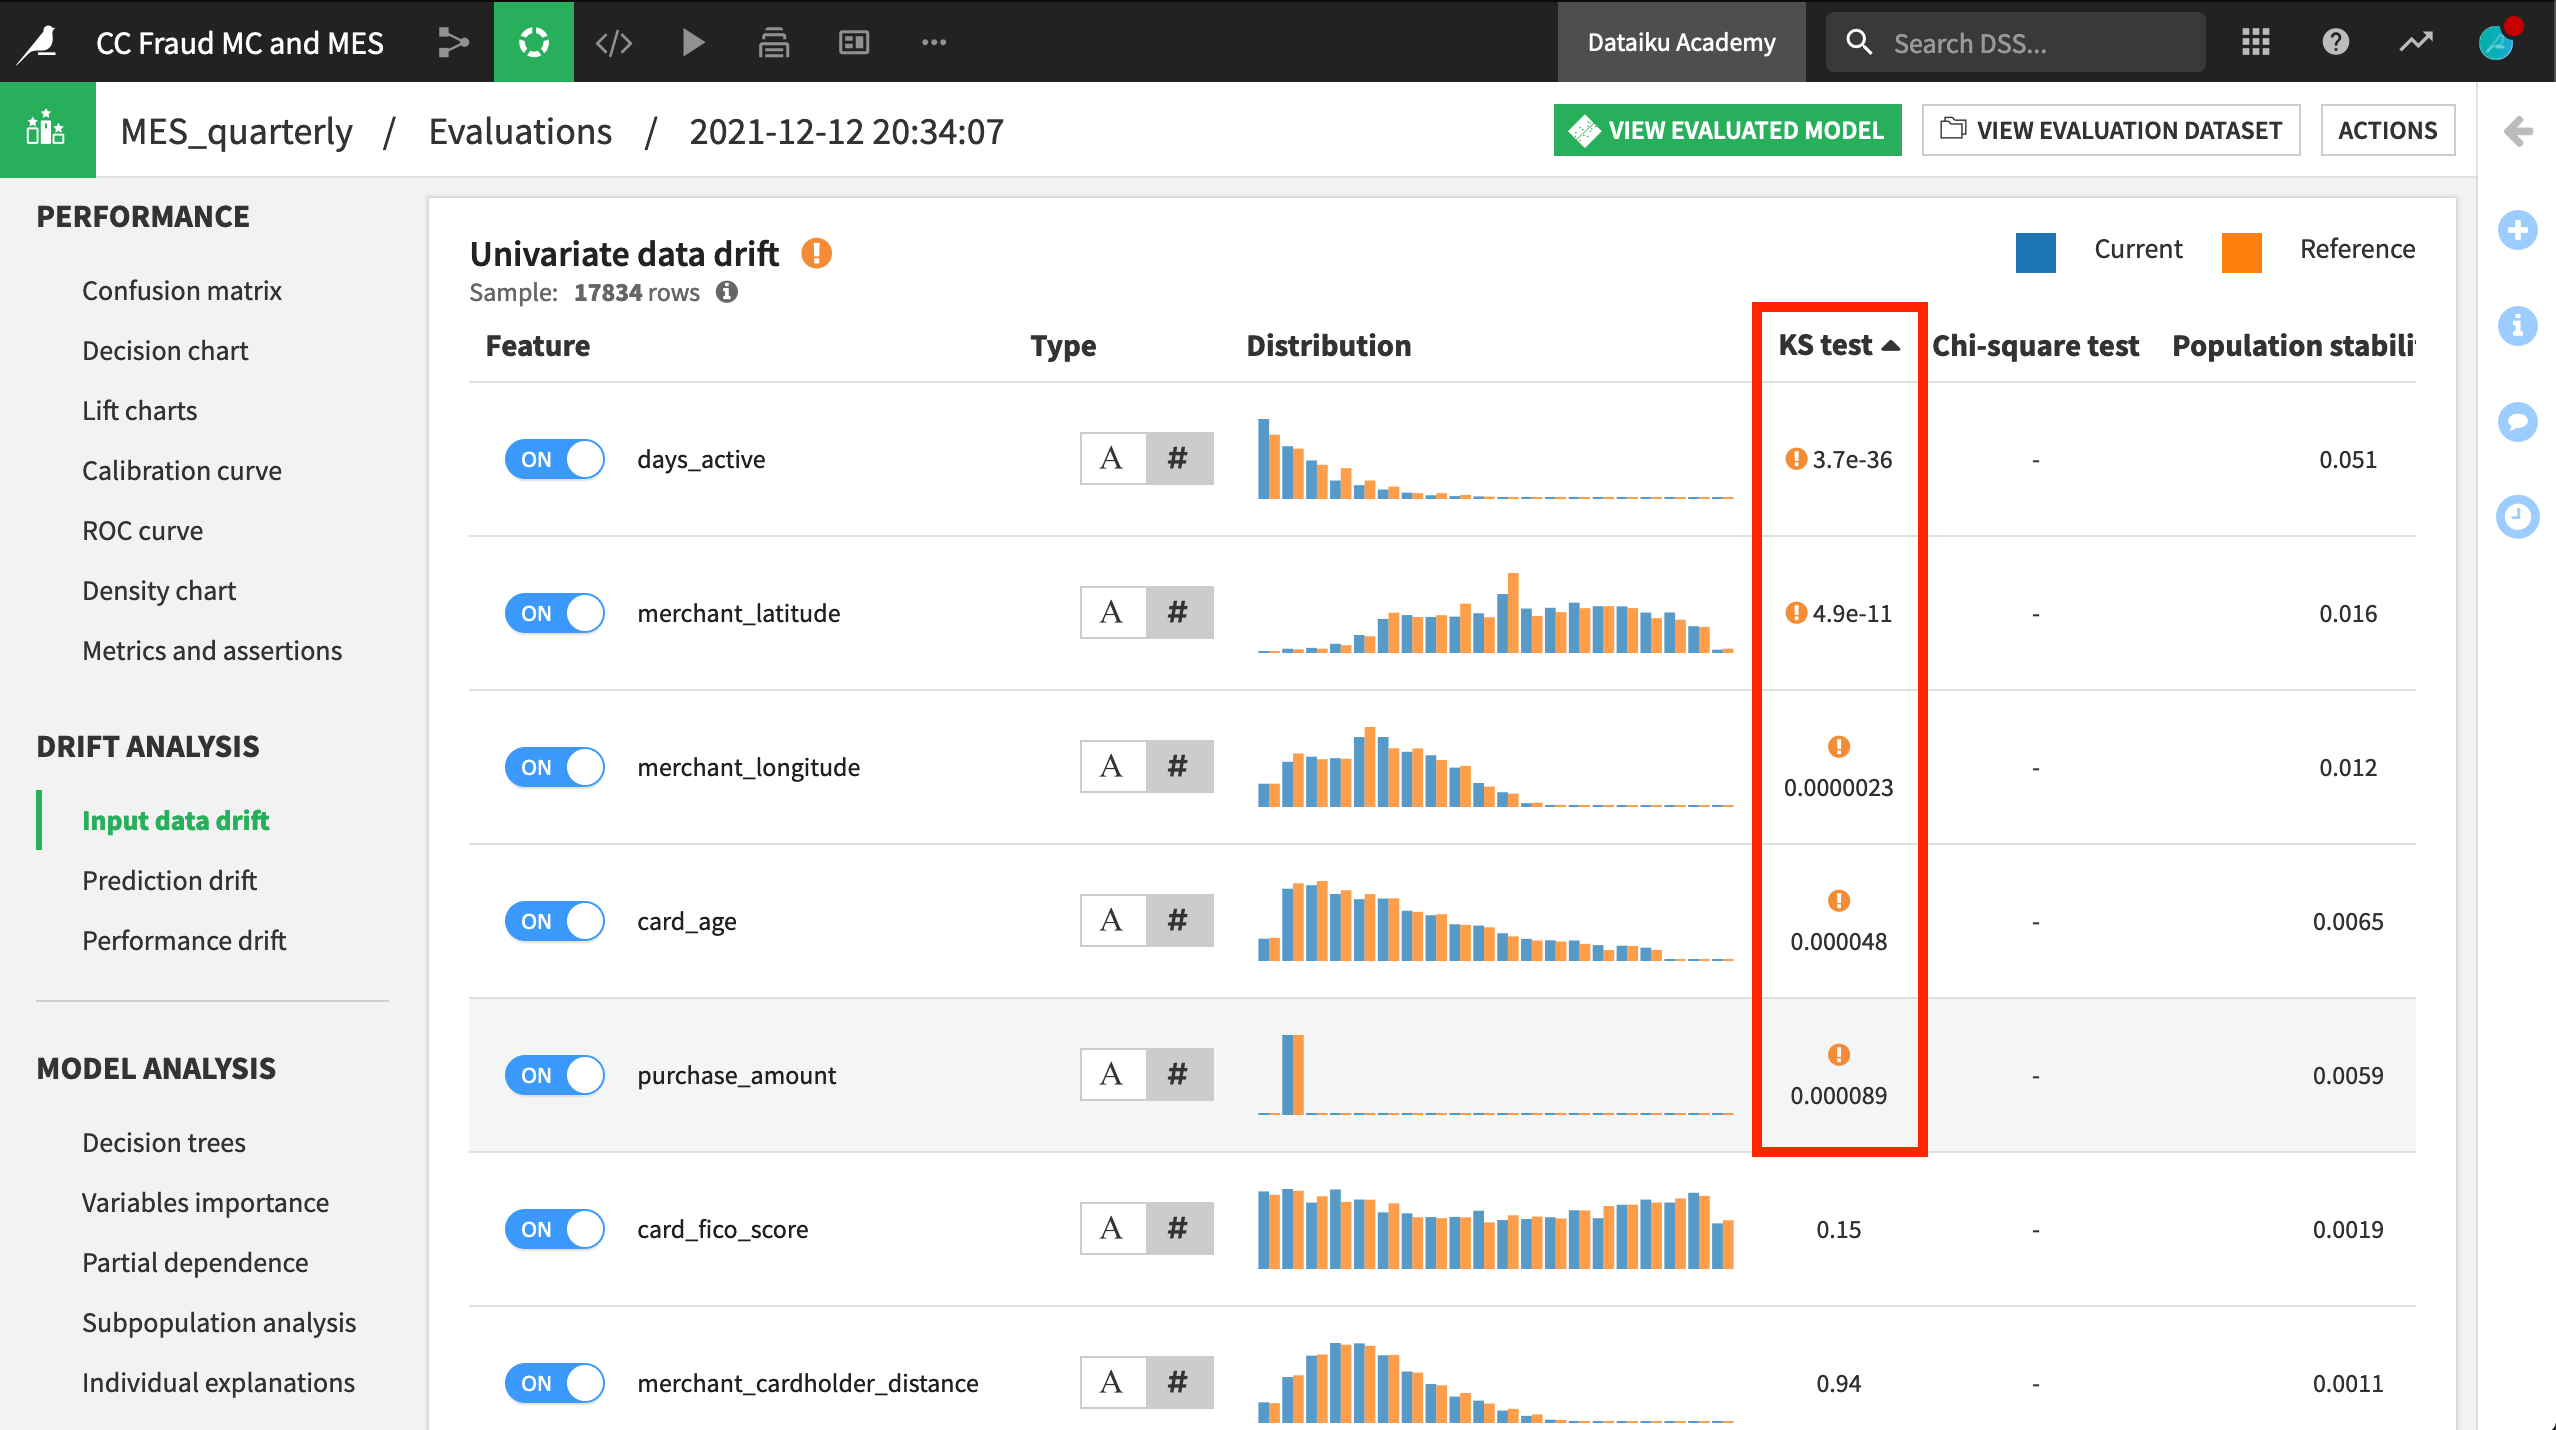
Scrolling down in the same pane, we can actually see which input features have drifted. After sorting by the KS test column, we can see that five features were found to have drifted significantly between Q1 and Q4.
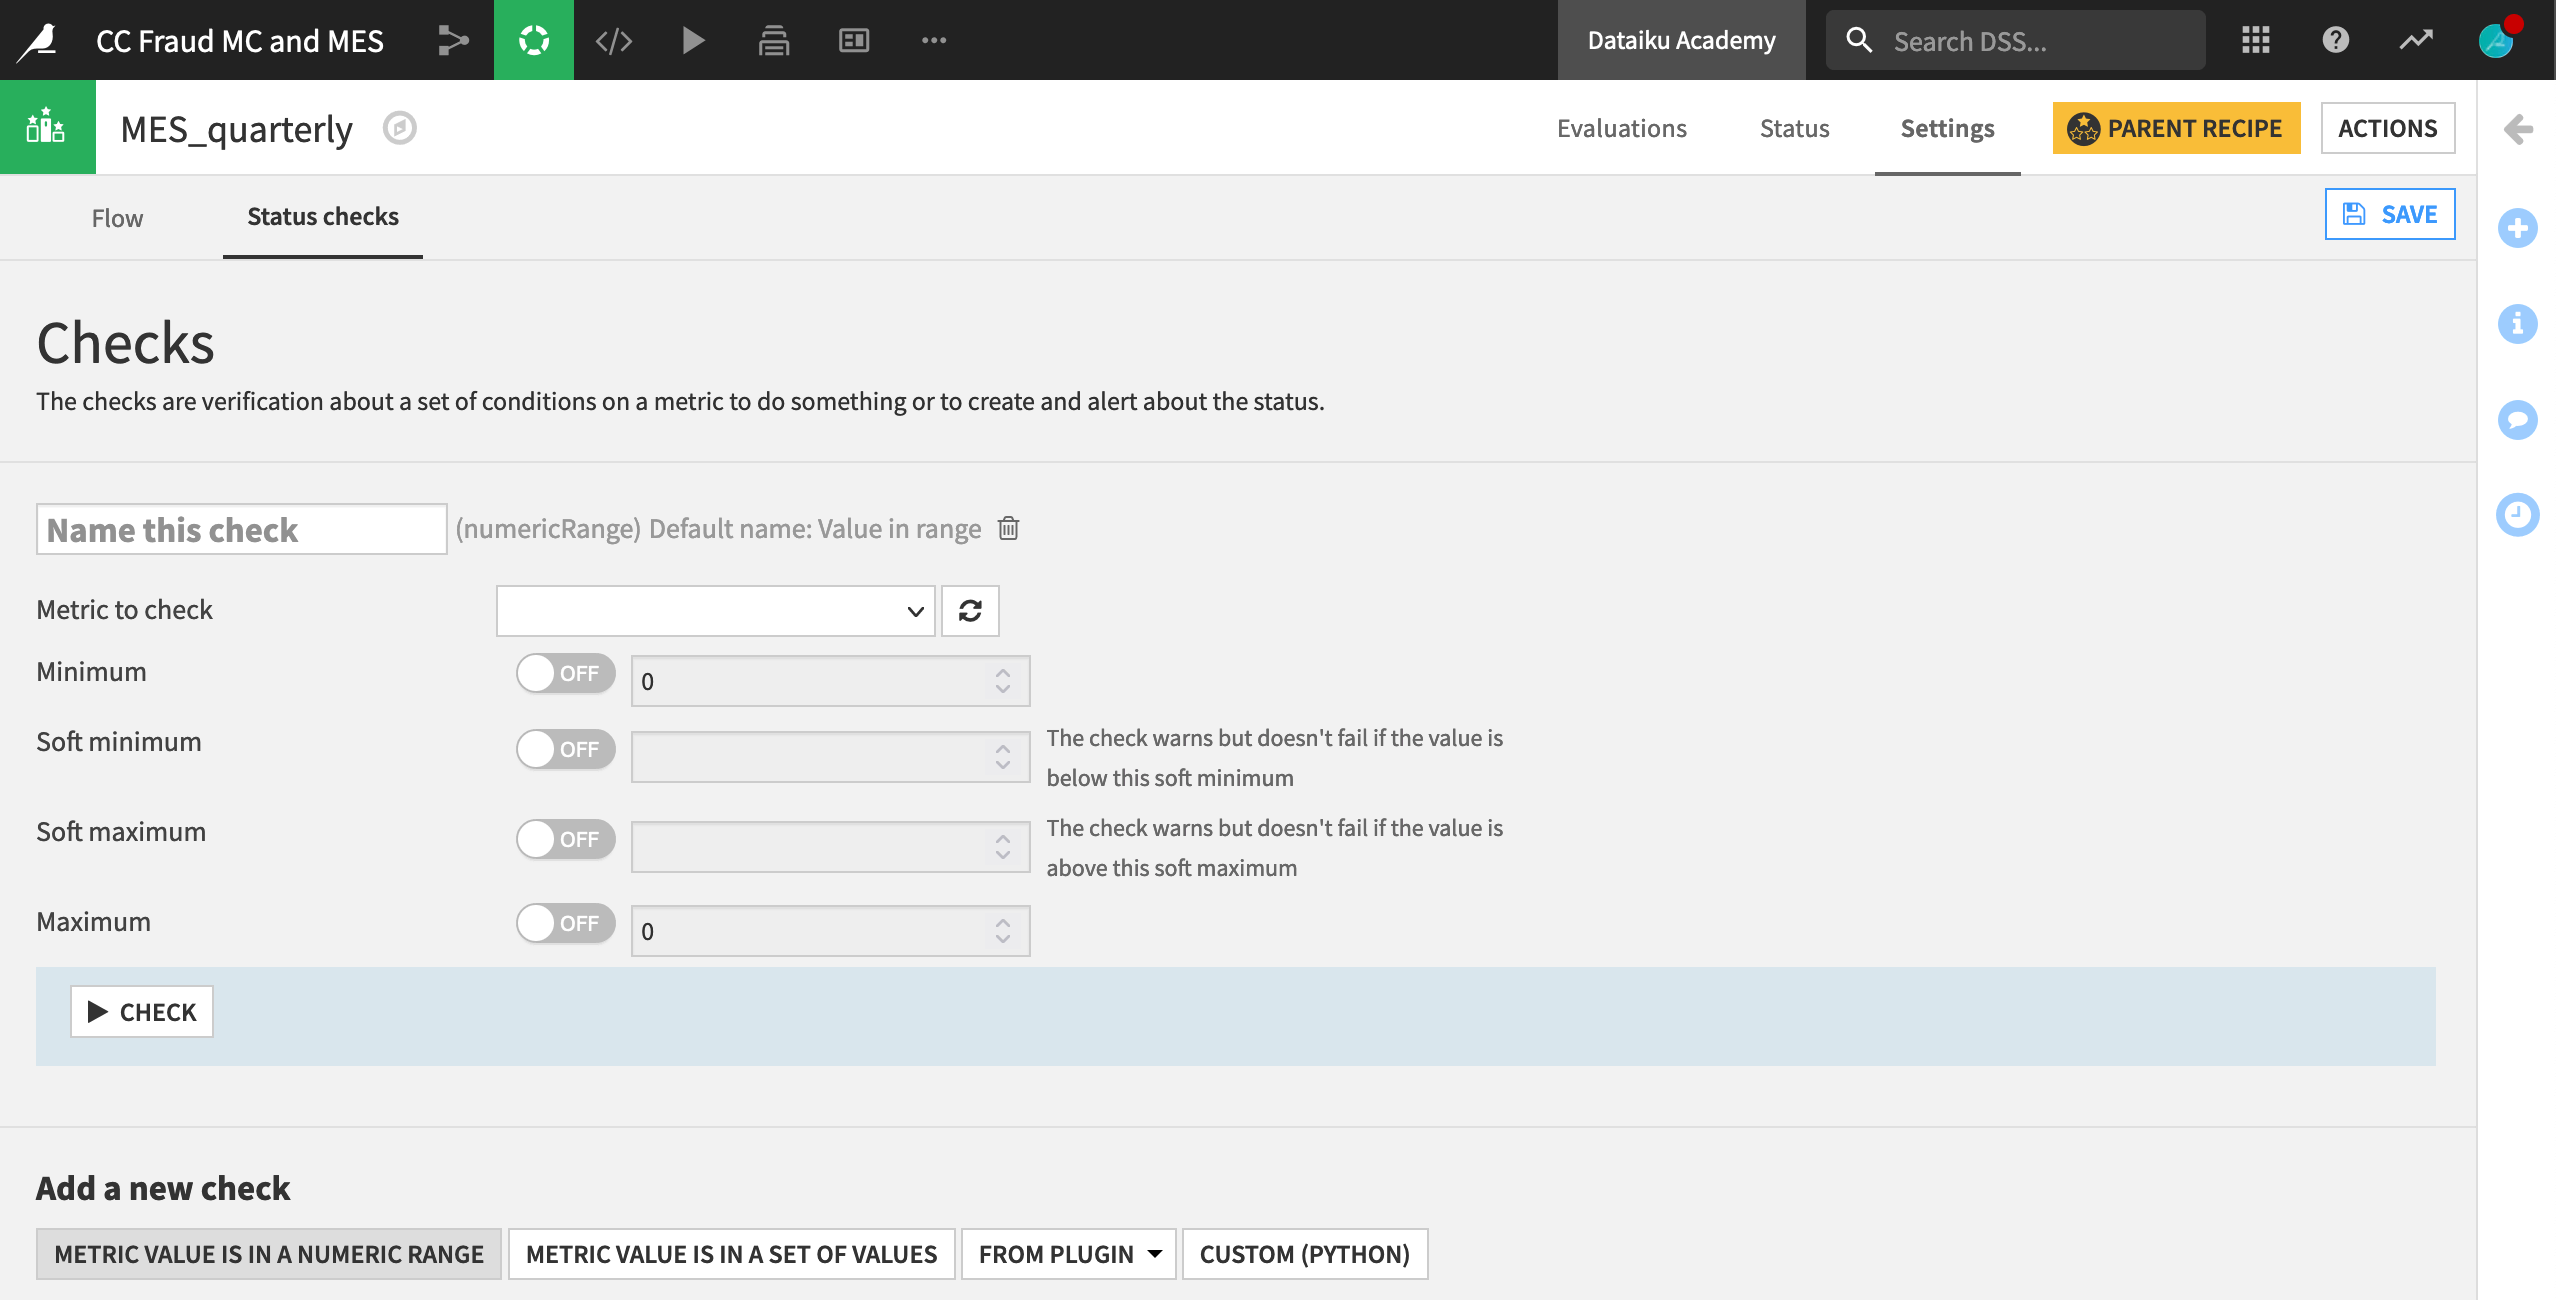
Establish Status Checks
Just like for other saved models or a metrics dataset from the Evaluate recipe, we could establish status checks, depending on any chosen metric. For example, we might want a warning if the model’s ROC AUC dipped below a certain threshold. We could also automatically retrain the model in the event this occurs using a scenario.
What’s Next?
Congratulations on taking your first steps with the Model Comparison and Model Evaluation Stores!
To learn more, please refer to the product documentation on model comparisons and model evaluation.