Concept Summary: Interactive Scoring
“What-if” analyses can be a useful exercise to help both data scientists and business analysts get a sense for what a model will predict, given different input values.
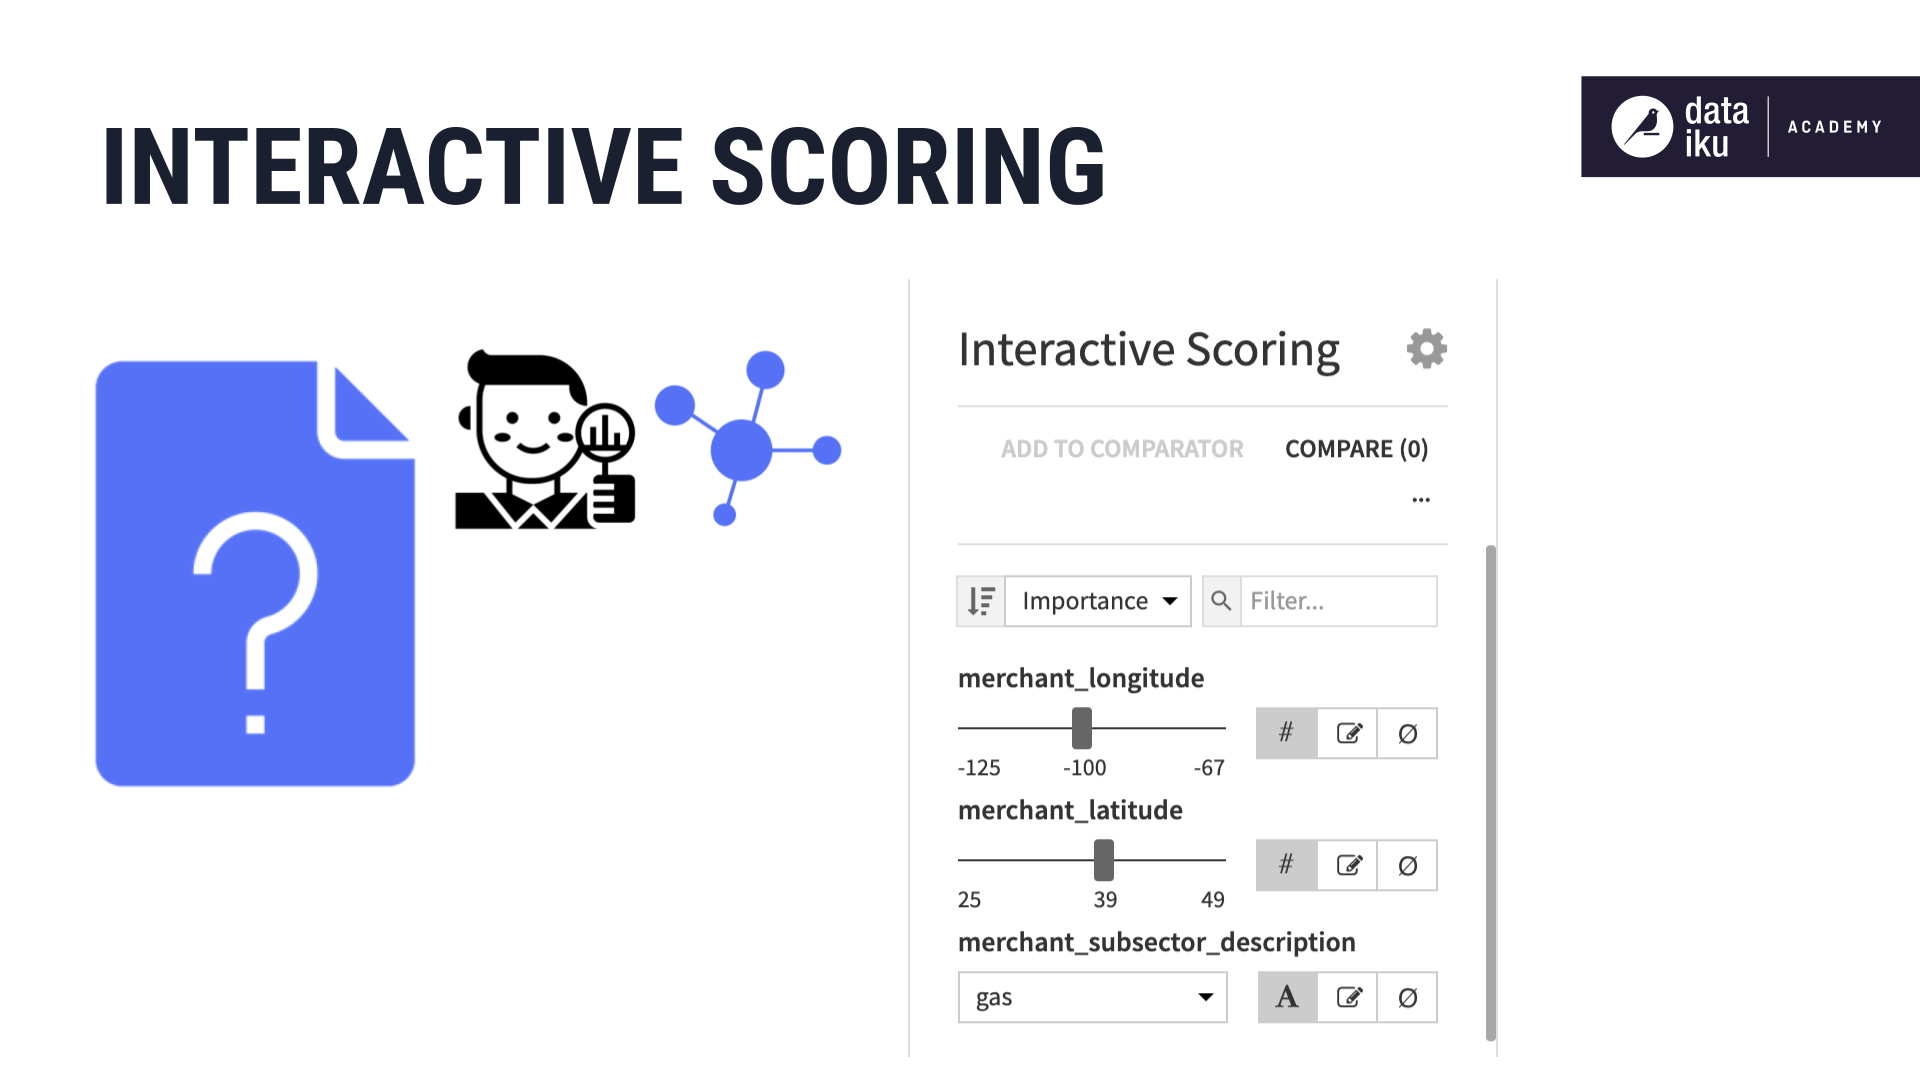
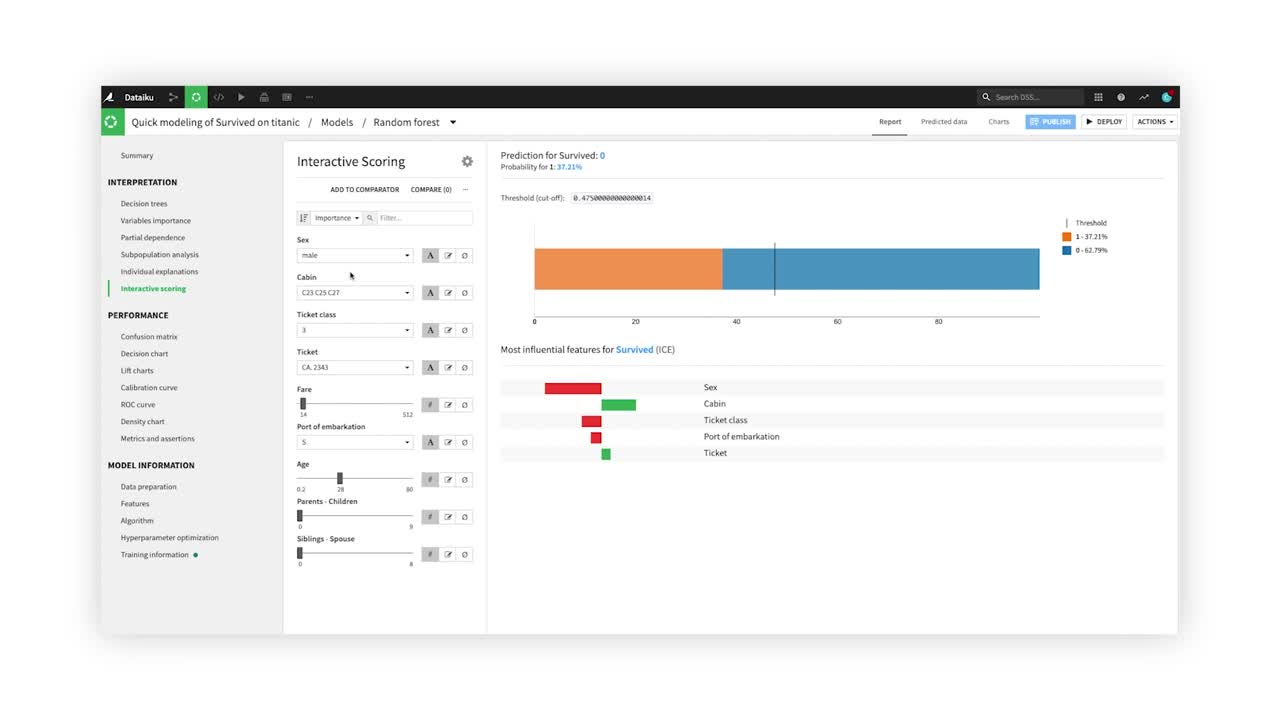
After training a machine learning model in Dataiku DSS, you can use the Interactive Scoring tool to try out various combinations of values for important features and see the resulting predictions.
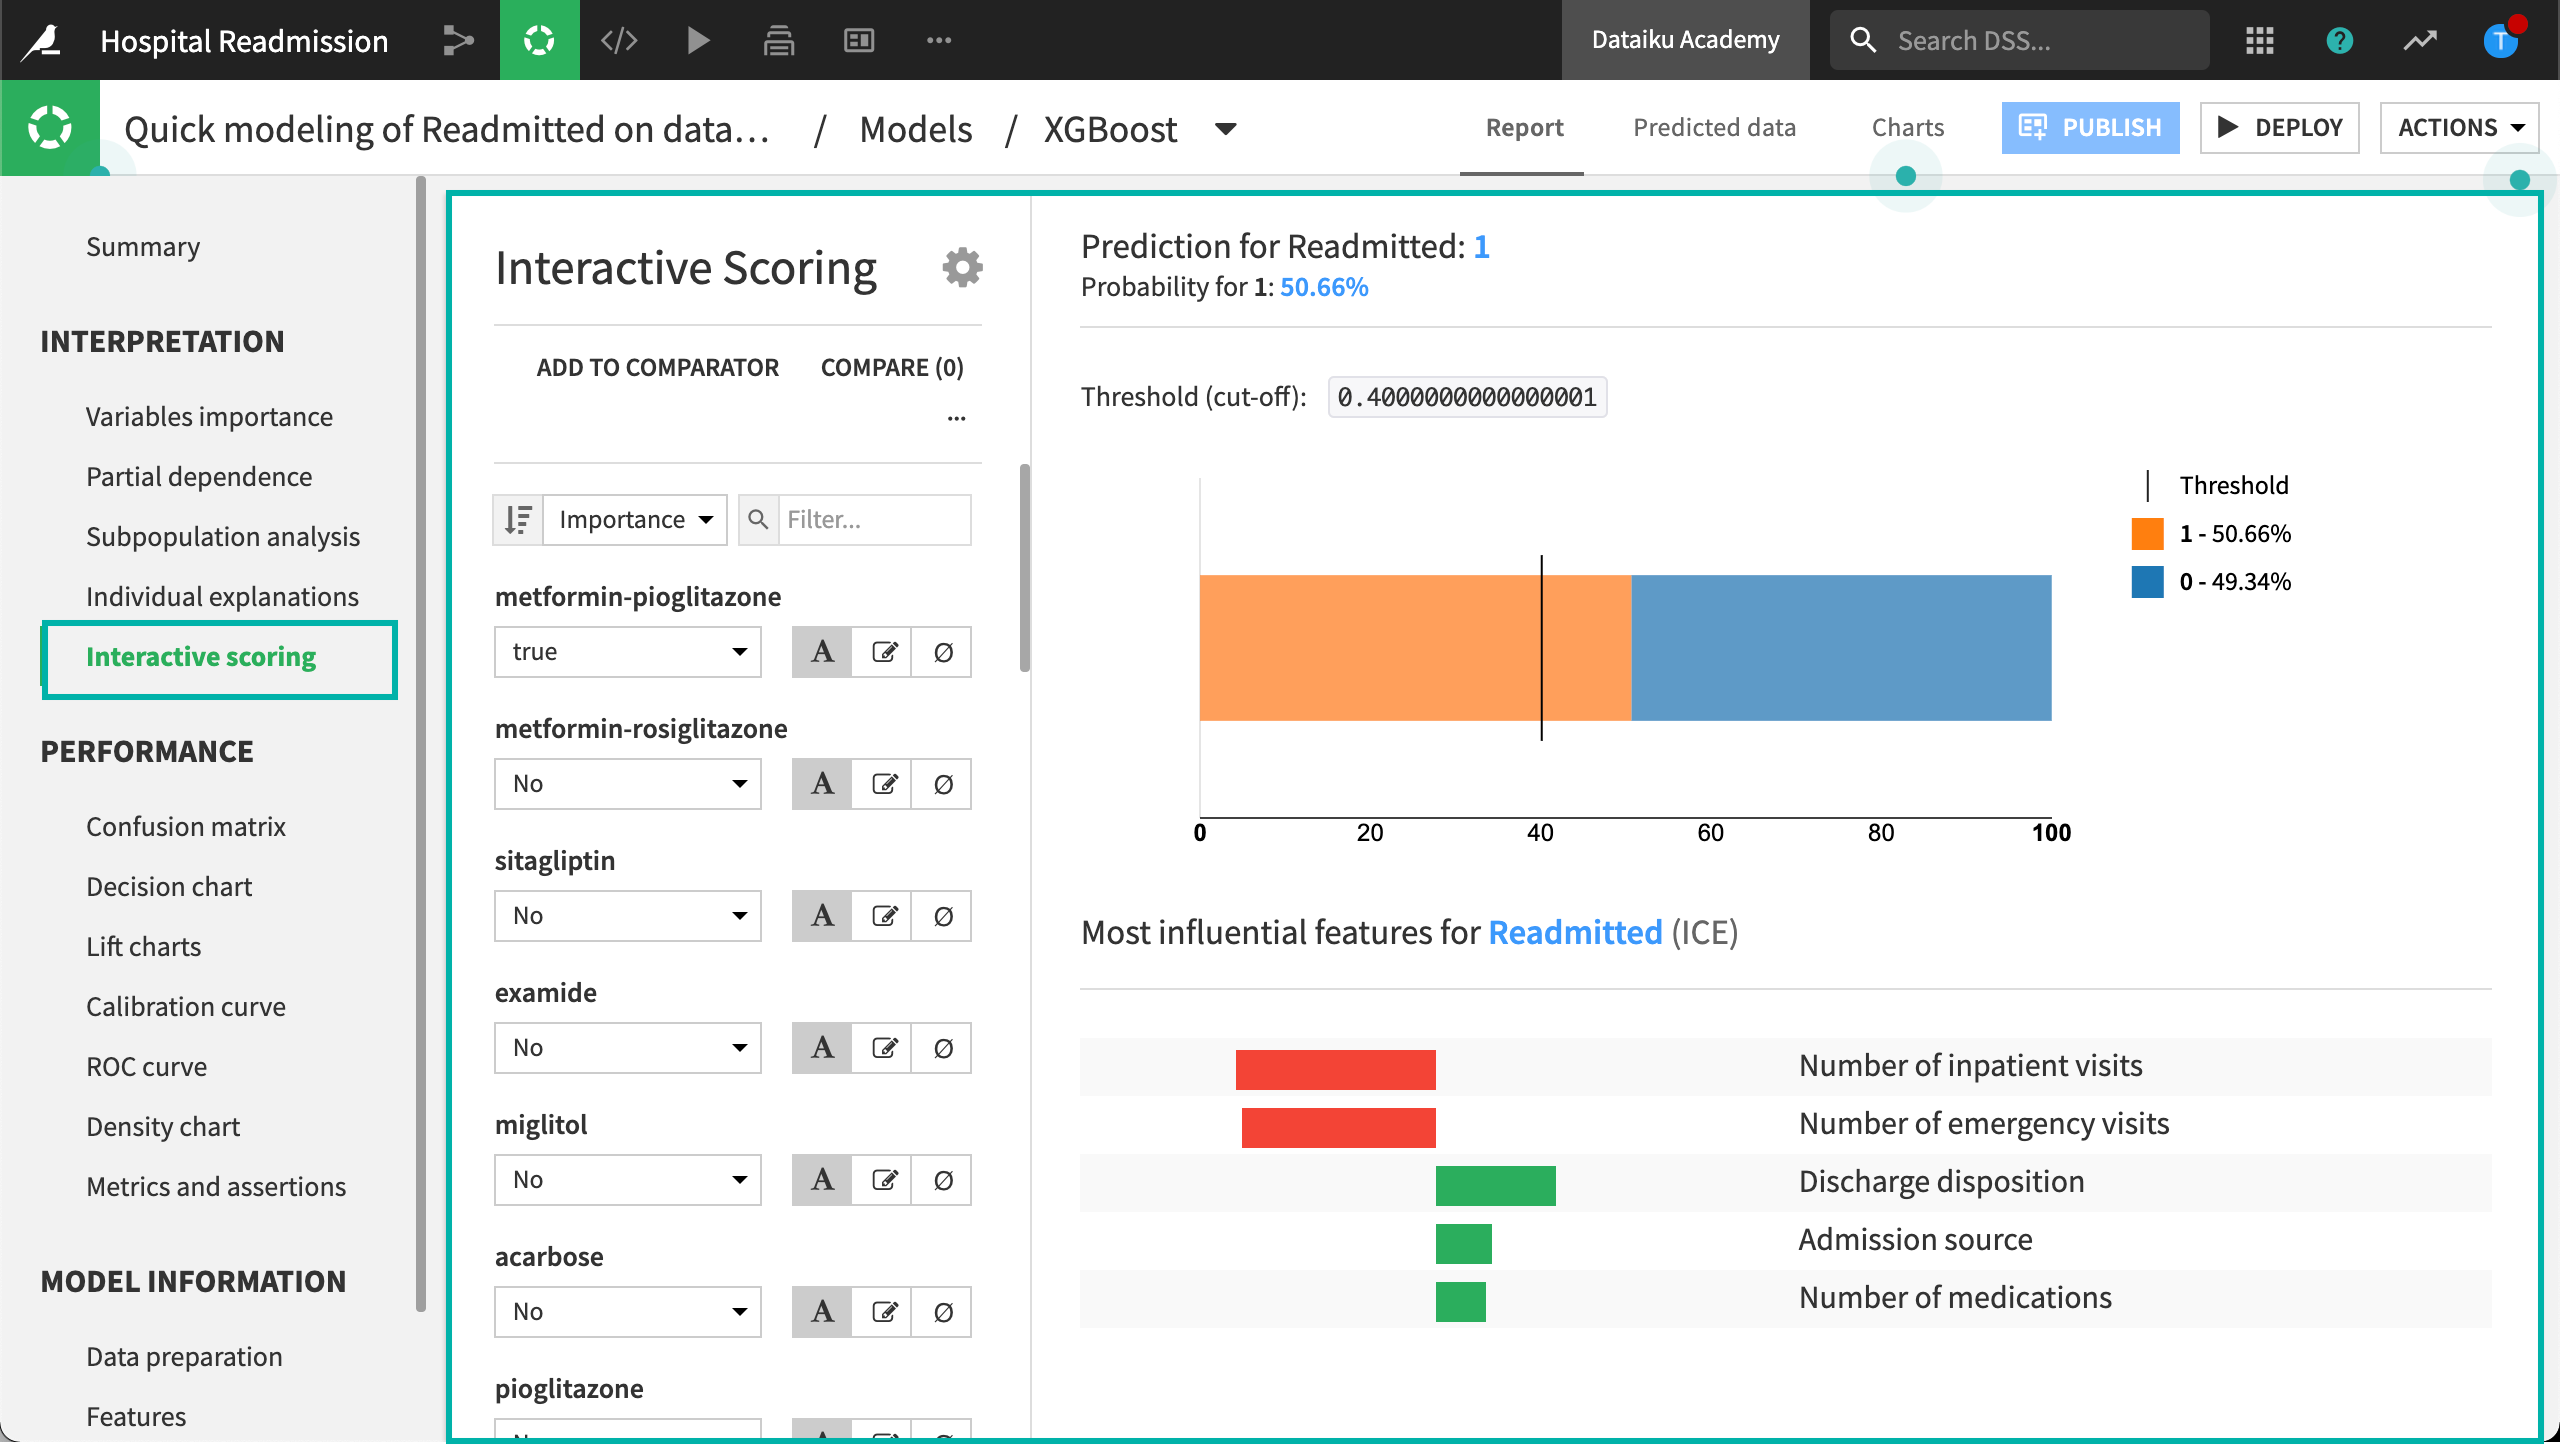
Data Scientists can access Interactive Scoring within the Visual ML interface, or publish it to a dashboard for broader use.
You can use the drop-down menus and sliders to adjust the values, type in your own, or even choose to ignore features to simulate a situation with missing values. On the right, you can review the new prediction based on your inputs.
The visualization will adjust depending on your model’s purpose:
binary classification
multi-class classification
regression
Regardless of the modeling task, for each simulation, you can inspect which features were most influential for this individual prediction, and the direction of the influence.
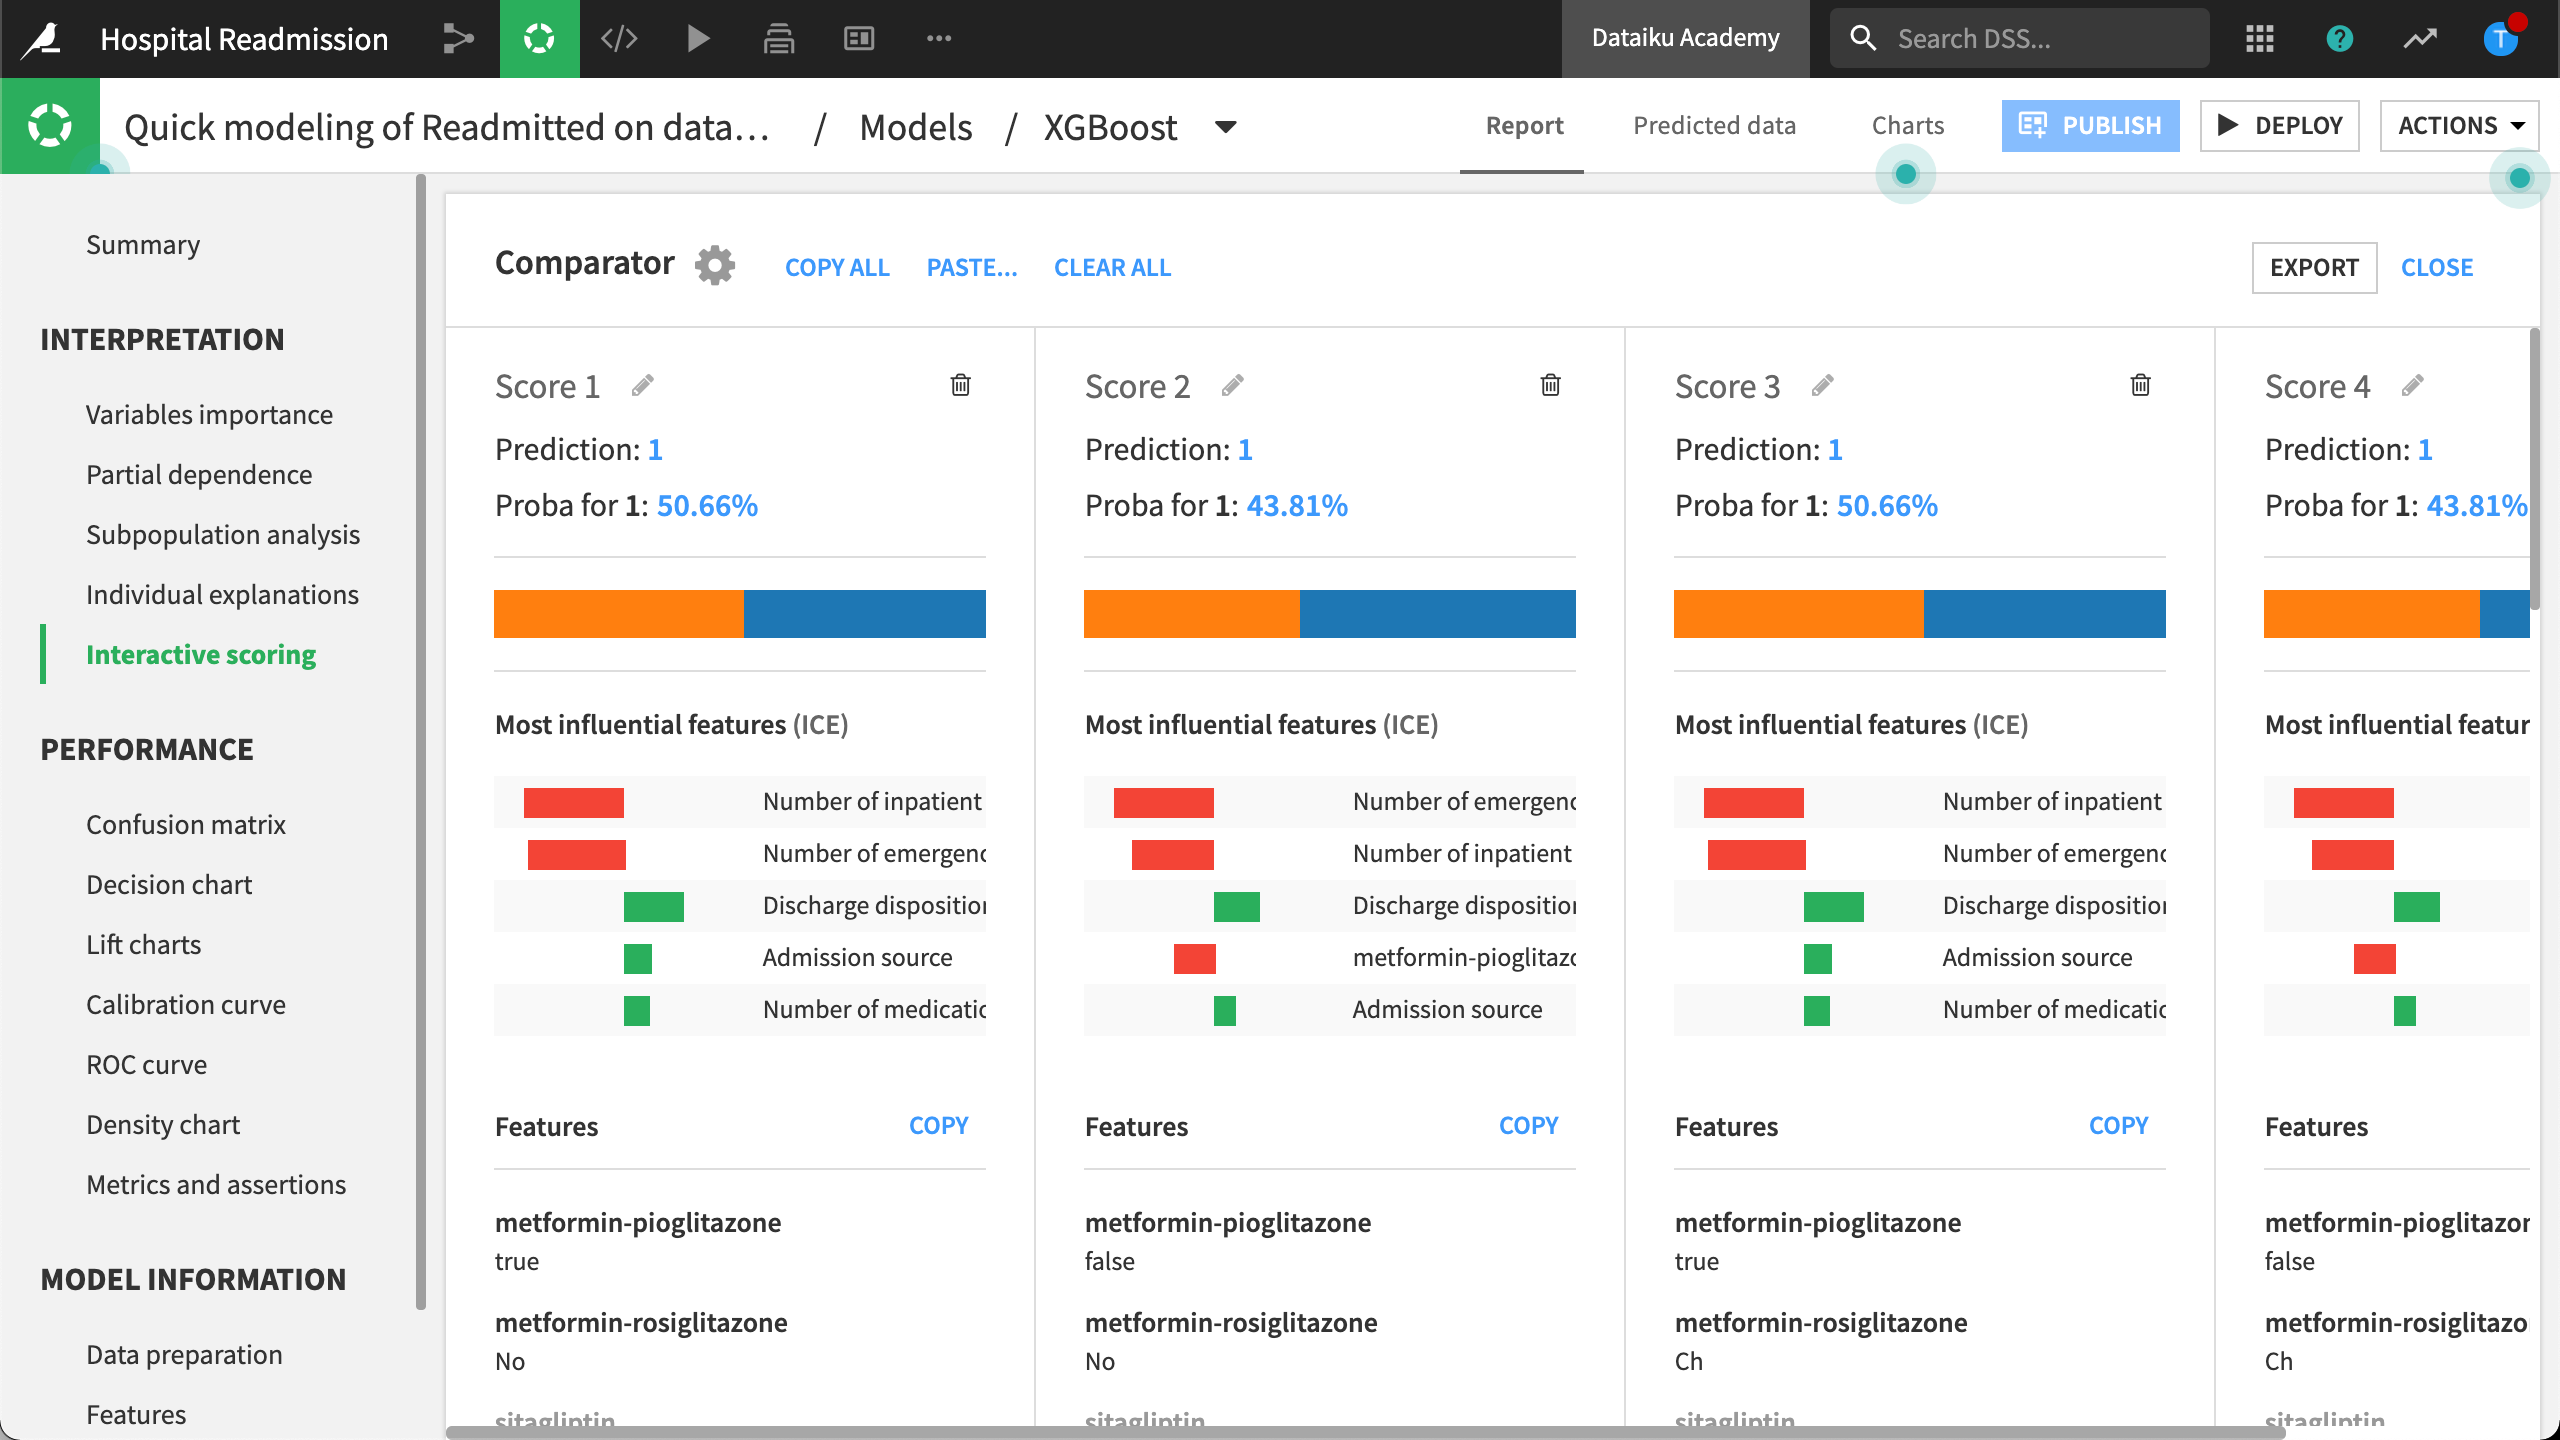
To compare and contrast outcomes for different experiments, try the Comparator tool. You can manually create samples, or copy a row from an existing dataset. You can even give these examples descriptive names and copy them to another saved model altogether, to see if they deliver similar results.
Visit the Reference Documentation to learn more about Interactive Scoring.