Drug Repurposing through Graph Analytics
In partnership with Capgemini, neo4j and Linkurious
Overview
Business Case
As the pharmaceutical industry faces a sharp decline in R&D returns (from 7,2% down to 2,5% between 2013 and 2020), finding new approaches to speed drug repurposing becomes all the more critical. Indeed, length of R&D processes combined with complexity of regulatory requirements for drug certification in a highly competitive environment act as an encouragement to leverage existing drugs and identify other applications.
This procedure takes into account data previously acquired, in particular on the drug’s safety and toxicity, which can make the initial phases of development for a repositioned drug considerably faster, and therefore cheaper (by over 80%), and increases the chances of introducing it on the market (by 150% compared with a novel drug). It was estimated in 2014 that repositioned drugs generated $250 billion in sales worldwide; that is, approximately, one-quarter of the pharmaceutical industry’s annual revenue, with five such drugs each generating over $1 billion in their new indication.
So, how to do this? Leveraging graph analytics approaches can provide a powerful accelerator to complex data structure representations and speed understanding of complex relationships between drugs, symptoms, genes, diseases and more, acting as a catalyst to identify opportunities.
Knowledge Graphs
A biomedical knowledge graph is a resource that integrates one or more expert-derived sources of information into a graph where nodes represent biomedical entities and edges represent relationships between two entities.
Using Knowledge Graph databases over other other types of databases present the following advantages:
There is a flexible online schema environment : great for heterogeneous data from multiple sources
Real word representation with objects and ontologies and relationships
Interpretability by both humans and computers, knowledge graphs can be visualized as they are computed
Enabling AI and machine learning across data at scale
Applied to pharmaceutical research, knowledge graphs provide a framework to take advantage of huge libraries of prospective drugs and isolate which compounds could be functionally relevant. These tools allow us to model biological complexity in detail and thereby make drug discovery more efficient and economical. In the field of drug repurposing, graph analytics can be applied in a two-step approach, starting by the rapid generation of innovative insights by using open data only (as provided in this solution). As a second step, these graphs can be extended through integration of each pharmaceutical company’s own data (clinical and available omics data).
Such an approach can be applied to other fields such as:
Analyzing research literature that would facilitate the identification of new therapies for treating
Drug development : by finding patients for clinical trials for example
Technical Requirements
To leverage this solution, you must meet the following requirements:
Have access to a DSS 9.0+ instance
Access to an external Neo4j database (w/ url and credentials)
The Neo4j plugin for Dataiku installed on your instance
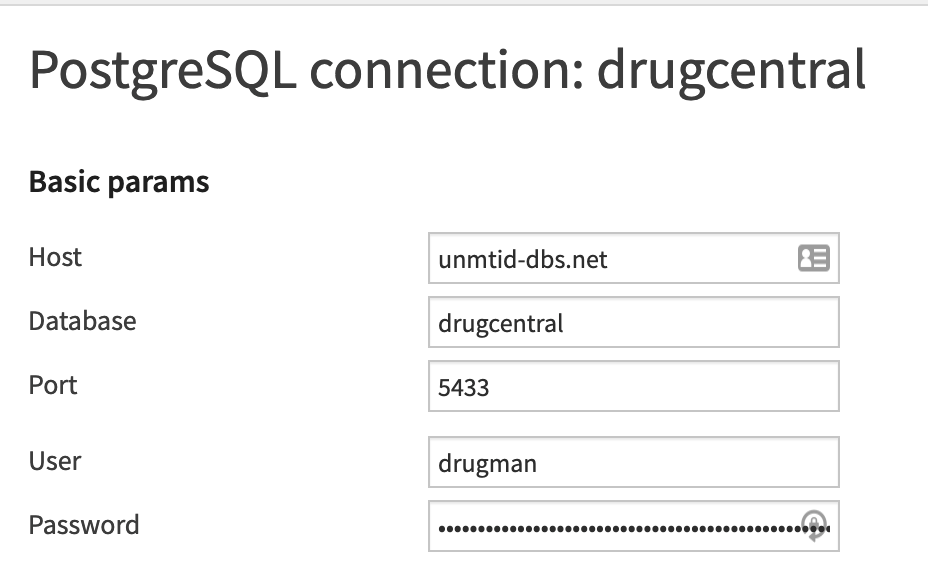
A PostgreSQL connection will need to be created with the name drugcental to access the Drug Central database. The connection details, including login and password can be found on their website
Full leverage of the provided graph can be achieved through ingestion into Linkurious Enterprise to easily navigate graphs and create custom queries. Going beyond the provided open-source only graph can be supported by Capgemini - please reach out to sebastien.tourlet@capgemini.com for more information.
Installation
If the technical requirements are met, this solution can be installed in one of two ways:
On your Dataiku instance click + New Project > Industry solutions > Life Sciences > Drug Repurposing.
Download the .zip project file and upload it directly to your Dataiku instance as a new project.
Note
If running a DSS 9 instance, the solution is found by navigating to + New Project > Sample Projects > Solutions > Drug Repurposing.
Data Requirements
The provided project is fully fuelled by open-source data:
Nodes Information
Gene Nodes: NCBI Gene
Anatomy and Gene Expression: Bgee
Gene Ontology: OBO Foundry
Diseases and Gene Expression: DisGeNET
Symptoms: HPO via NCBI MedGen
Pathways: Pathway Commons and WikiPathways
Side Effects: SIDER
Drug Nodes and Indications: Drug Central
The Drug Central database is accessible via a public SQL server at drugcentral:unmtid-dbs.net:5433
Additional Information
Entrez/Ensembl Lookup and Entrez/GO Lookup: NCBI Gene
Drug/Sider Lookup: PubChem Ids
Workflow Overview
You can follow along with the solution in the Dataiku gallery.
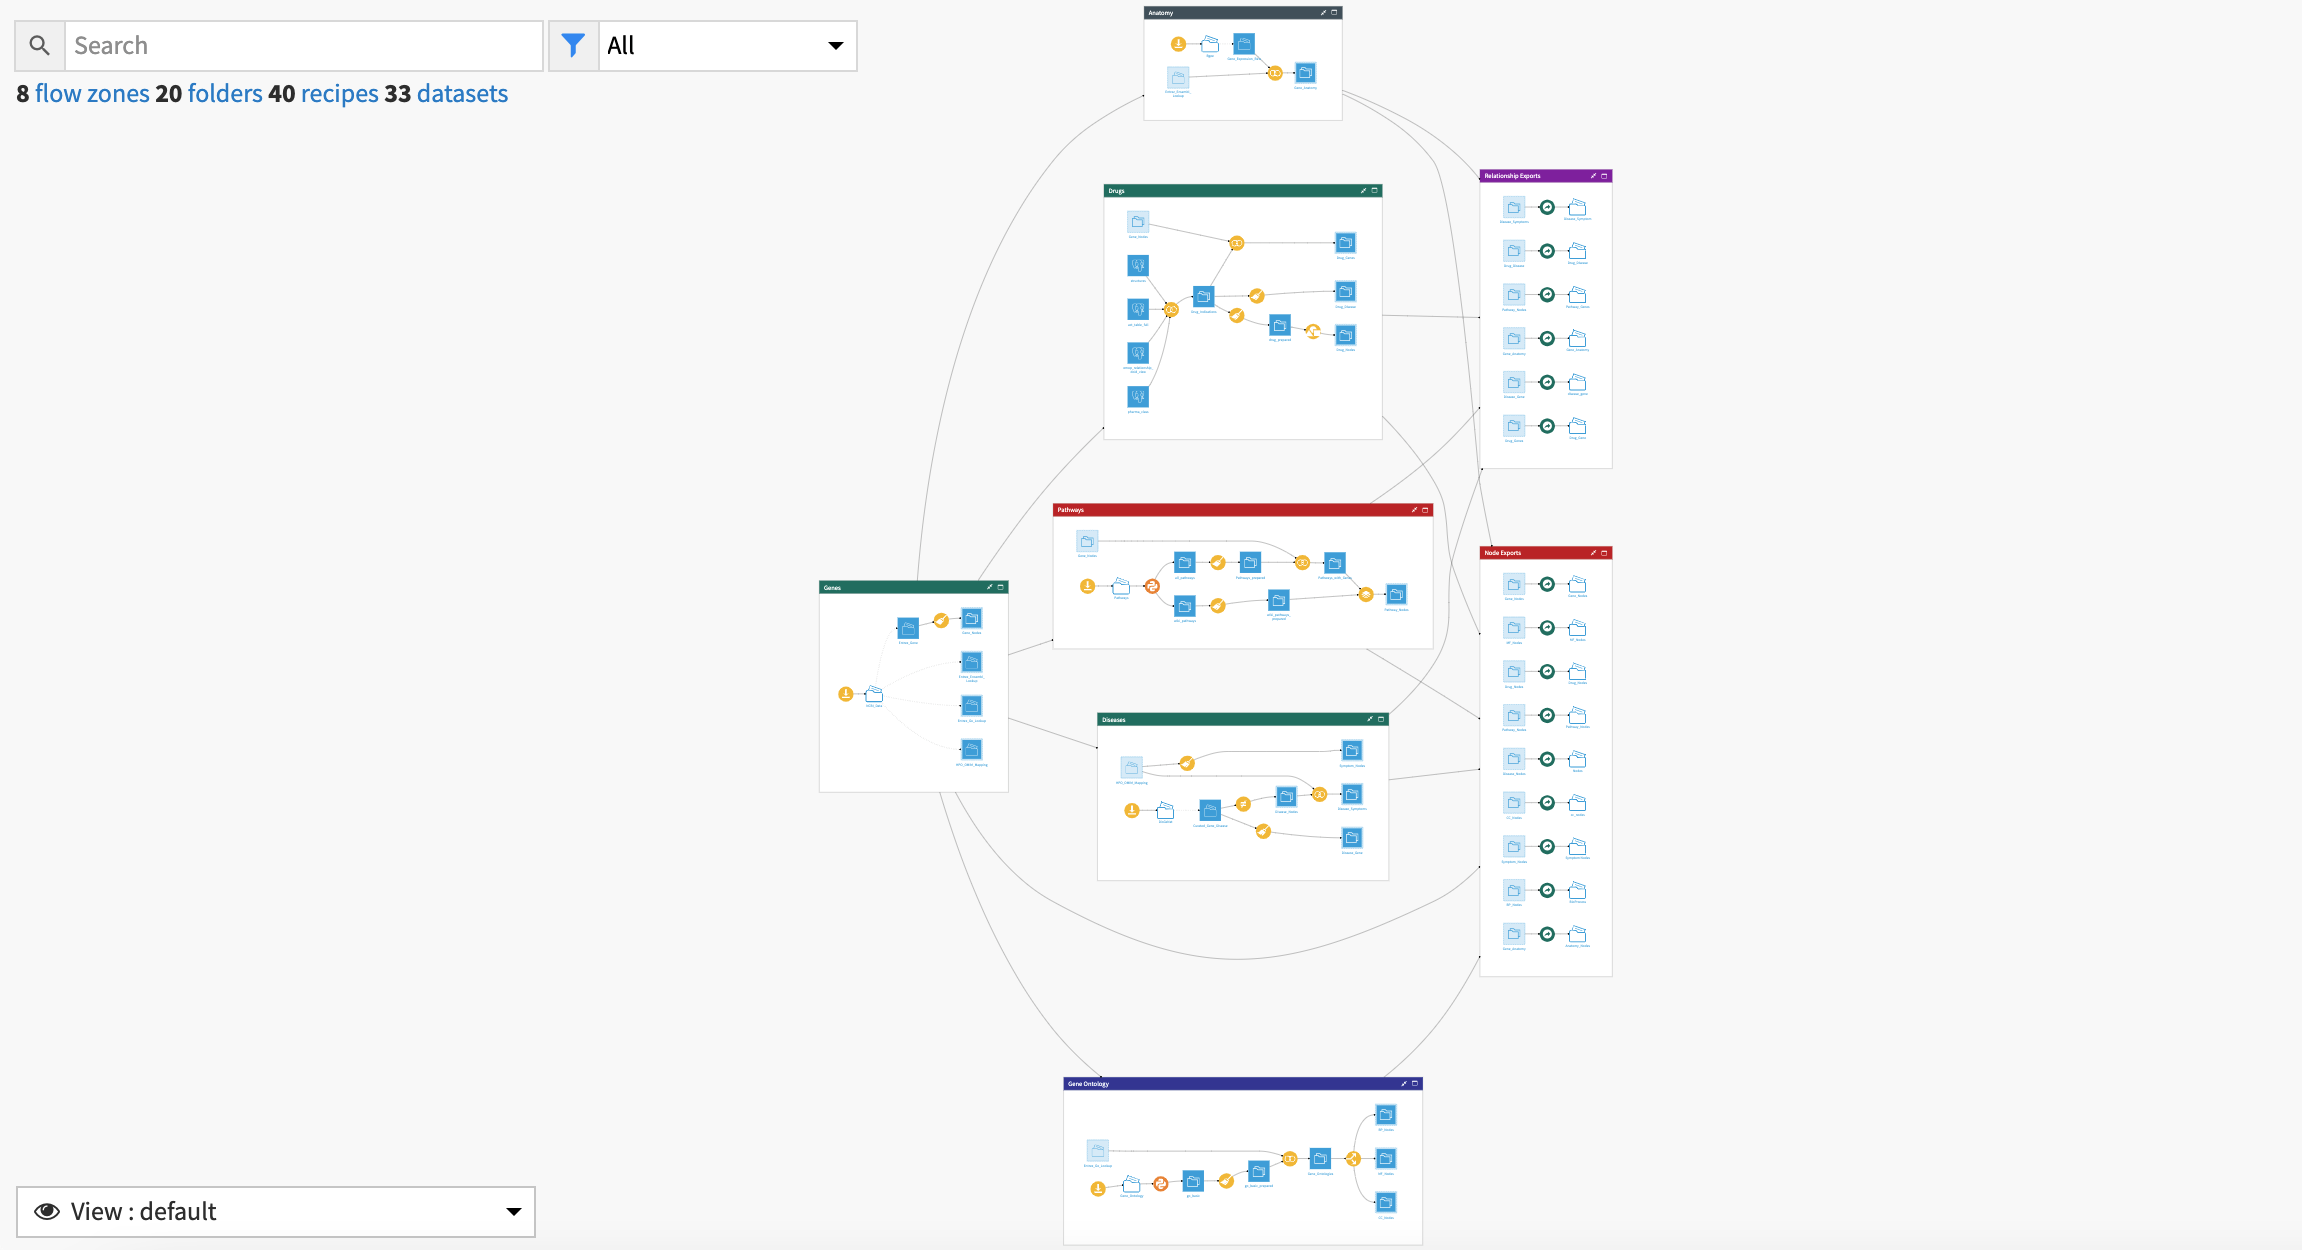
The project has the following high level steps:
Accessing External Data
Cleaning and Preparing Nodes
Blending Data for Edges
Analysis with Neo4j and Linkurious
Walkthrough
Note
In-depth technical details can be found in the wiki of the project.
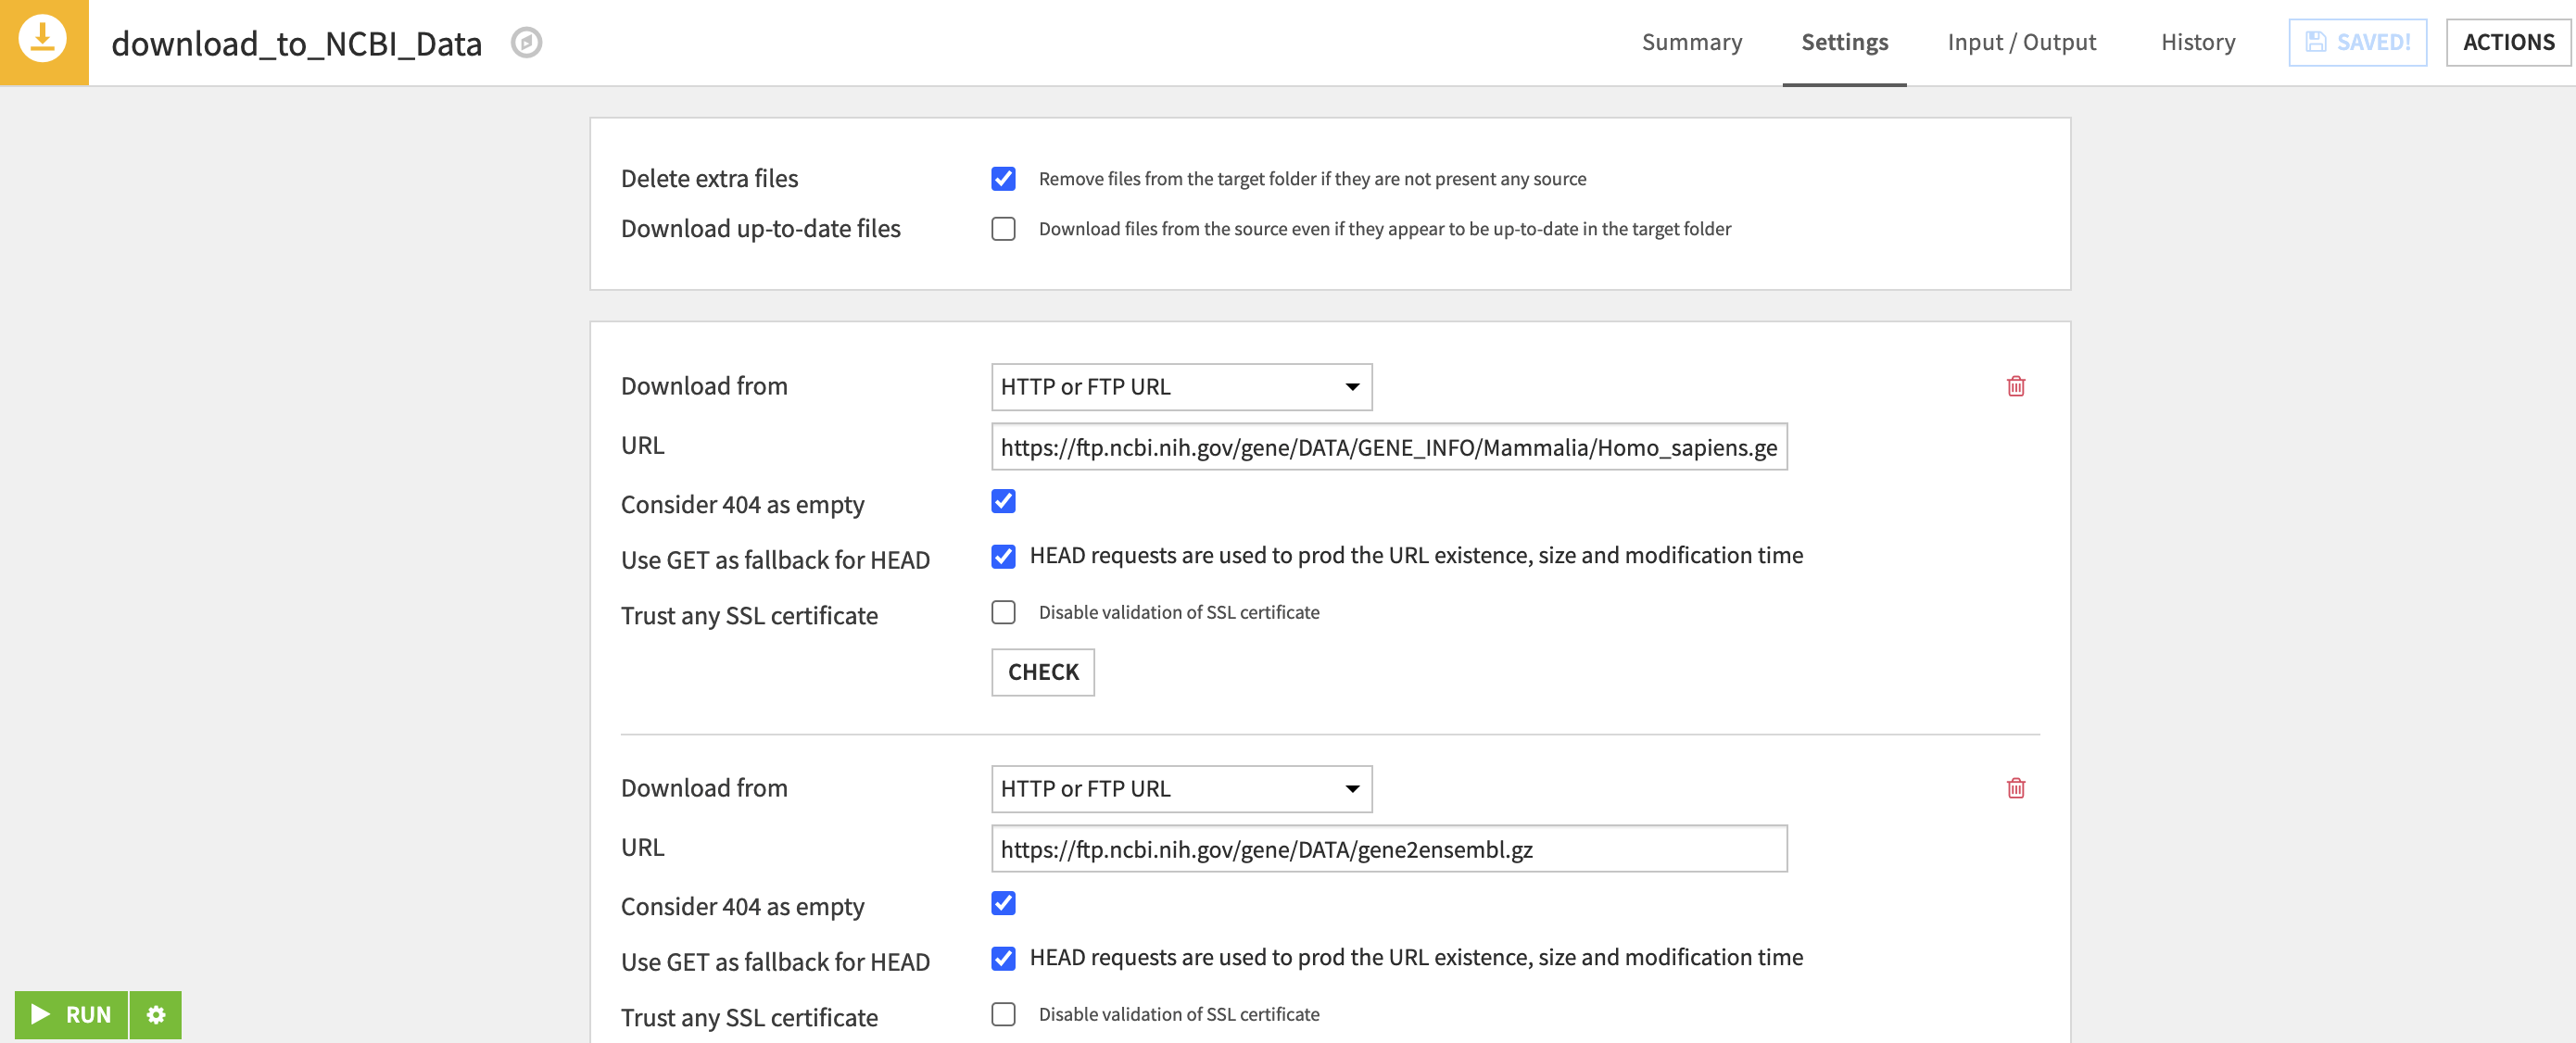
Pulling in External Data
Dataiku allows you to easily connect to and download data from these external urls. Moreover, these downloads can be automated, so that as new information is added to the connected FTP services, your workflow can stay up to date. This connection is done using a visual recipe in Dataiku which creates a managed folder where external data is written to. In some of the recipes in our flow, we have downloaded multiple files to a single folder. This keeps the external data organized on the flow by themes.
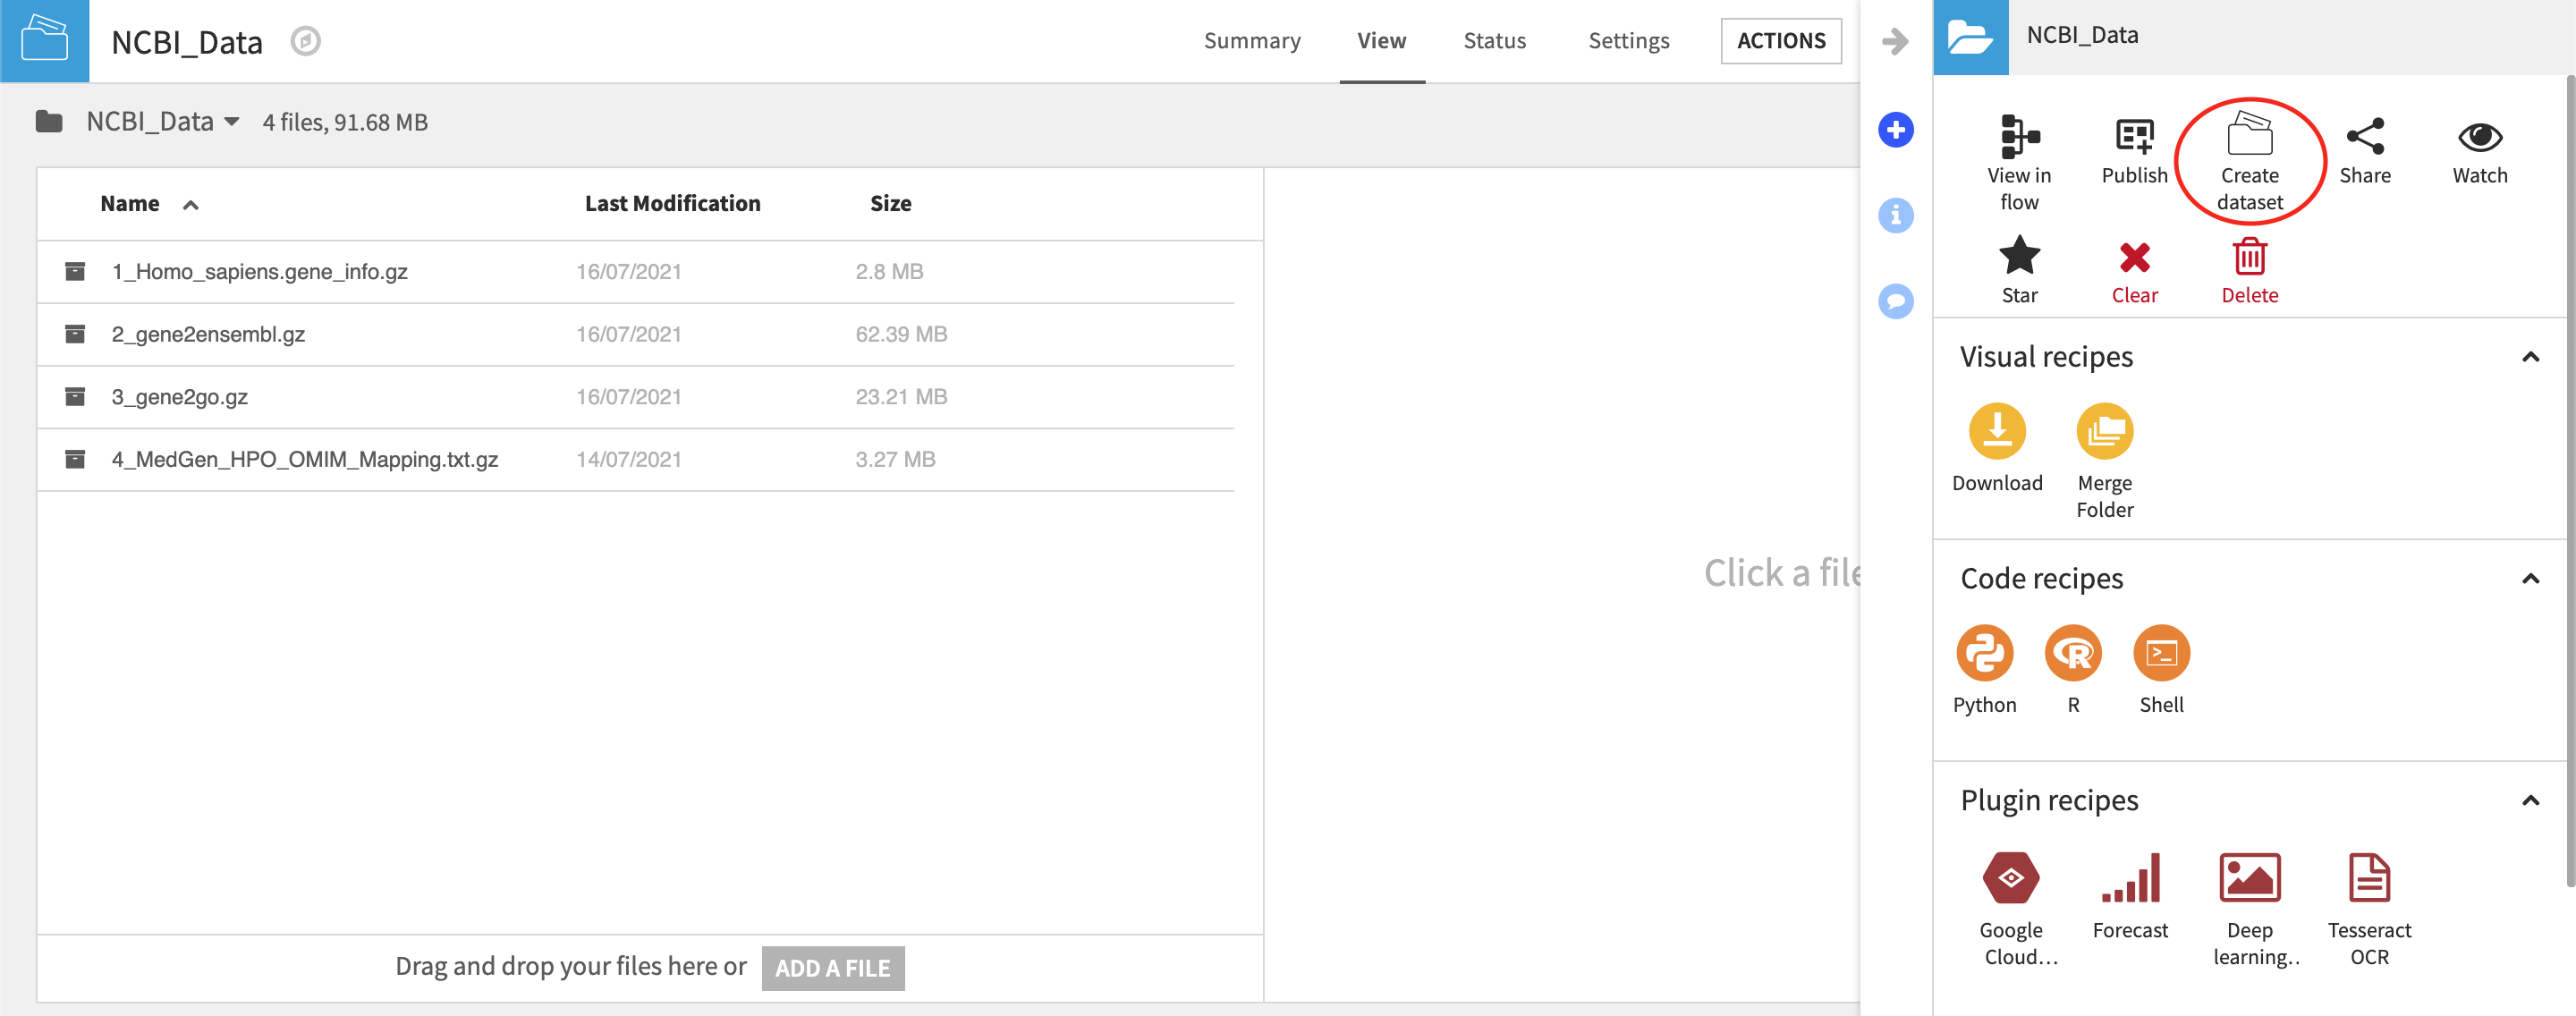
Once files are written to the folder, you can select a file within a folder and from the Actions tab > Create Dataset. This will create a managed dataset on the flow so long as the selected files to be imported into a single dataset have the same schema. From here, these datasets will act like any other and can be inputs to any recipe.
The Graph Nodes
A network graph is a connection of nodes and edges, that maps the relationship among the data. In the world of drug repurposing, nodes and edges can take on many different forms - such as genes, disease, chemical compounds, mechanisms of action and more. Given the complex nature of chemical pathology, mapping the connections between compounds, genes and diseases requires a multigraph structure with heterogenous nodes. In this graph there are 7 types of nodes to connect, listed below.
Genes
Diseases
Drugs
Pathways
Symptoms
Anatomy
Ontology Nodes : Cellular Compounds, Molecular Function, Biological Processes
These nodes serve as center points for the final graph network. The node datasets are derived from the various source tables with minimal cleaning to ensure variable naming consistency across the project. Getting node datasets is completed either
Using prepare recipes to remove unnecessary columns, clean out invalid data, and rename columns
Running basic python recipies to unnest json data into a tabluar format.
Following this initial cleansing of the data, additional prepare recipes are employed to further unnest data into relevant features while dropping any extraneous meta data.
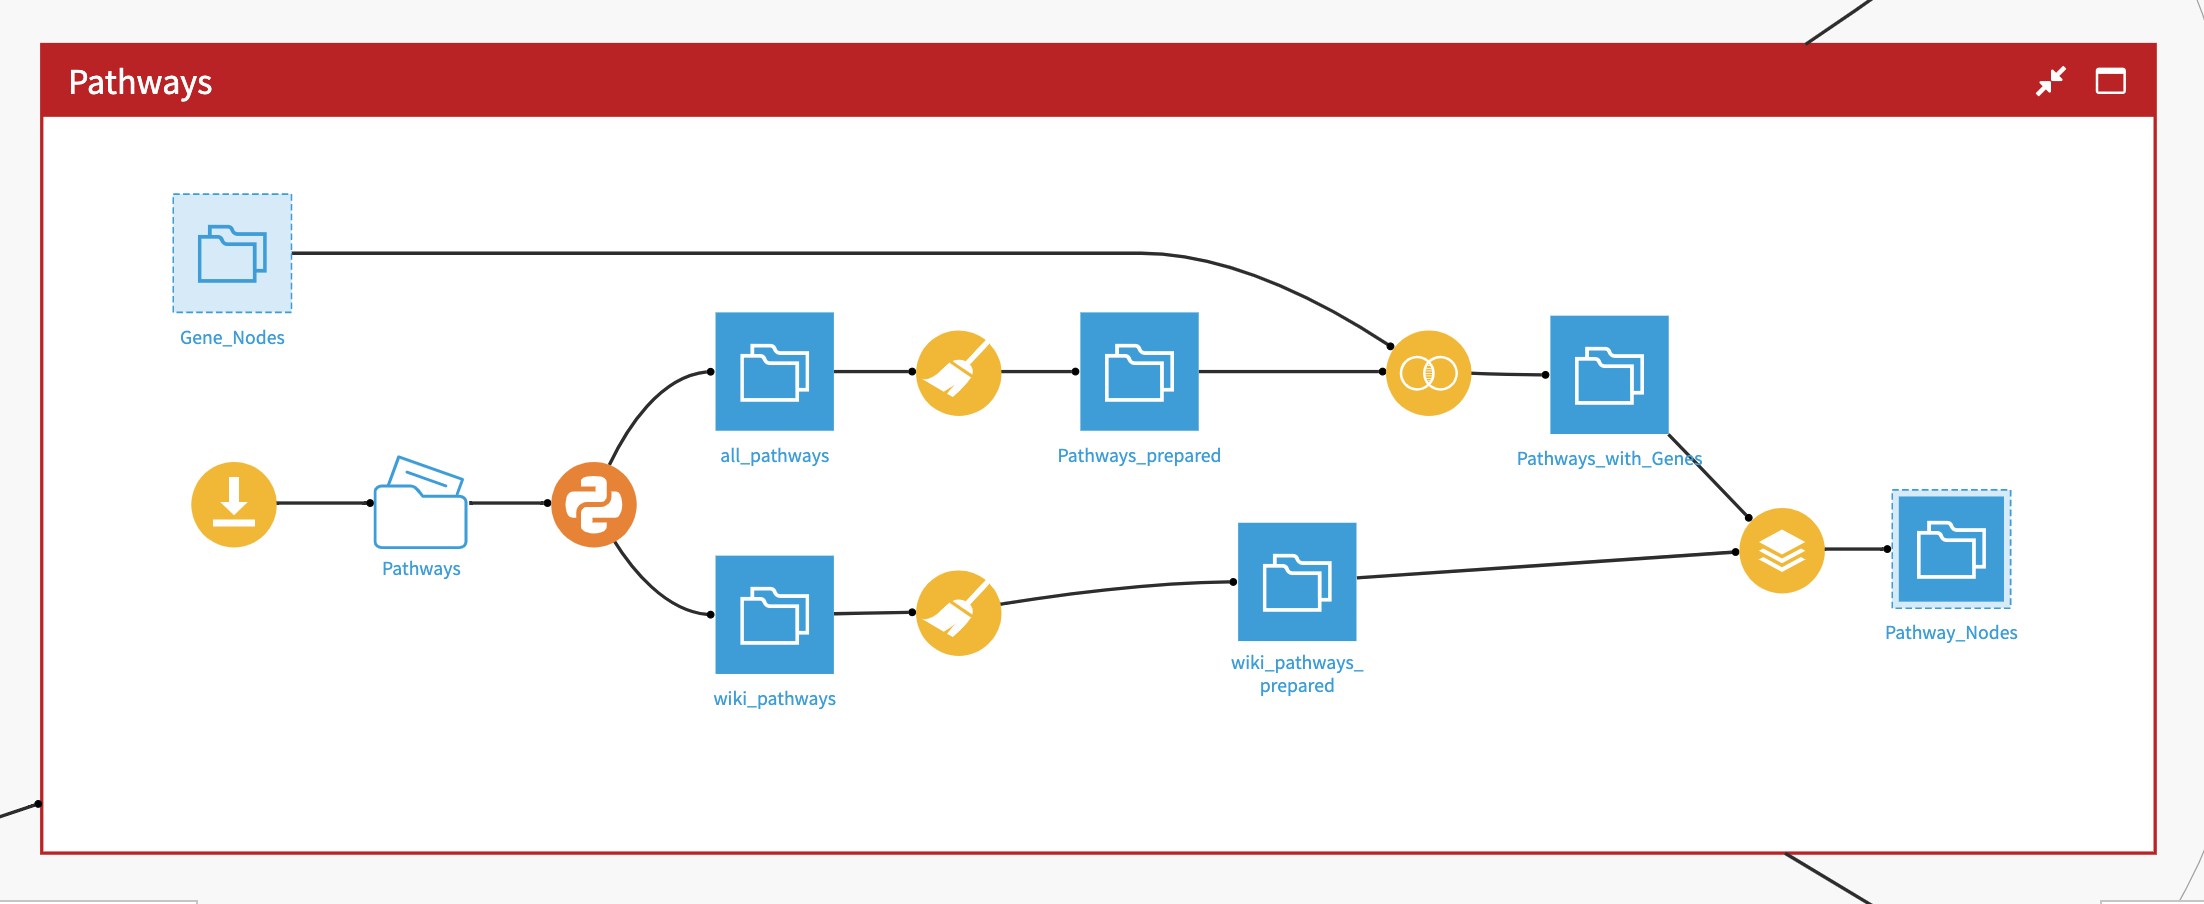
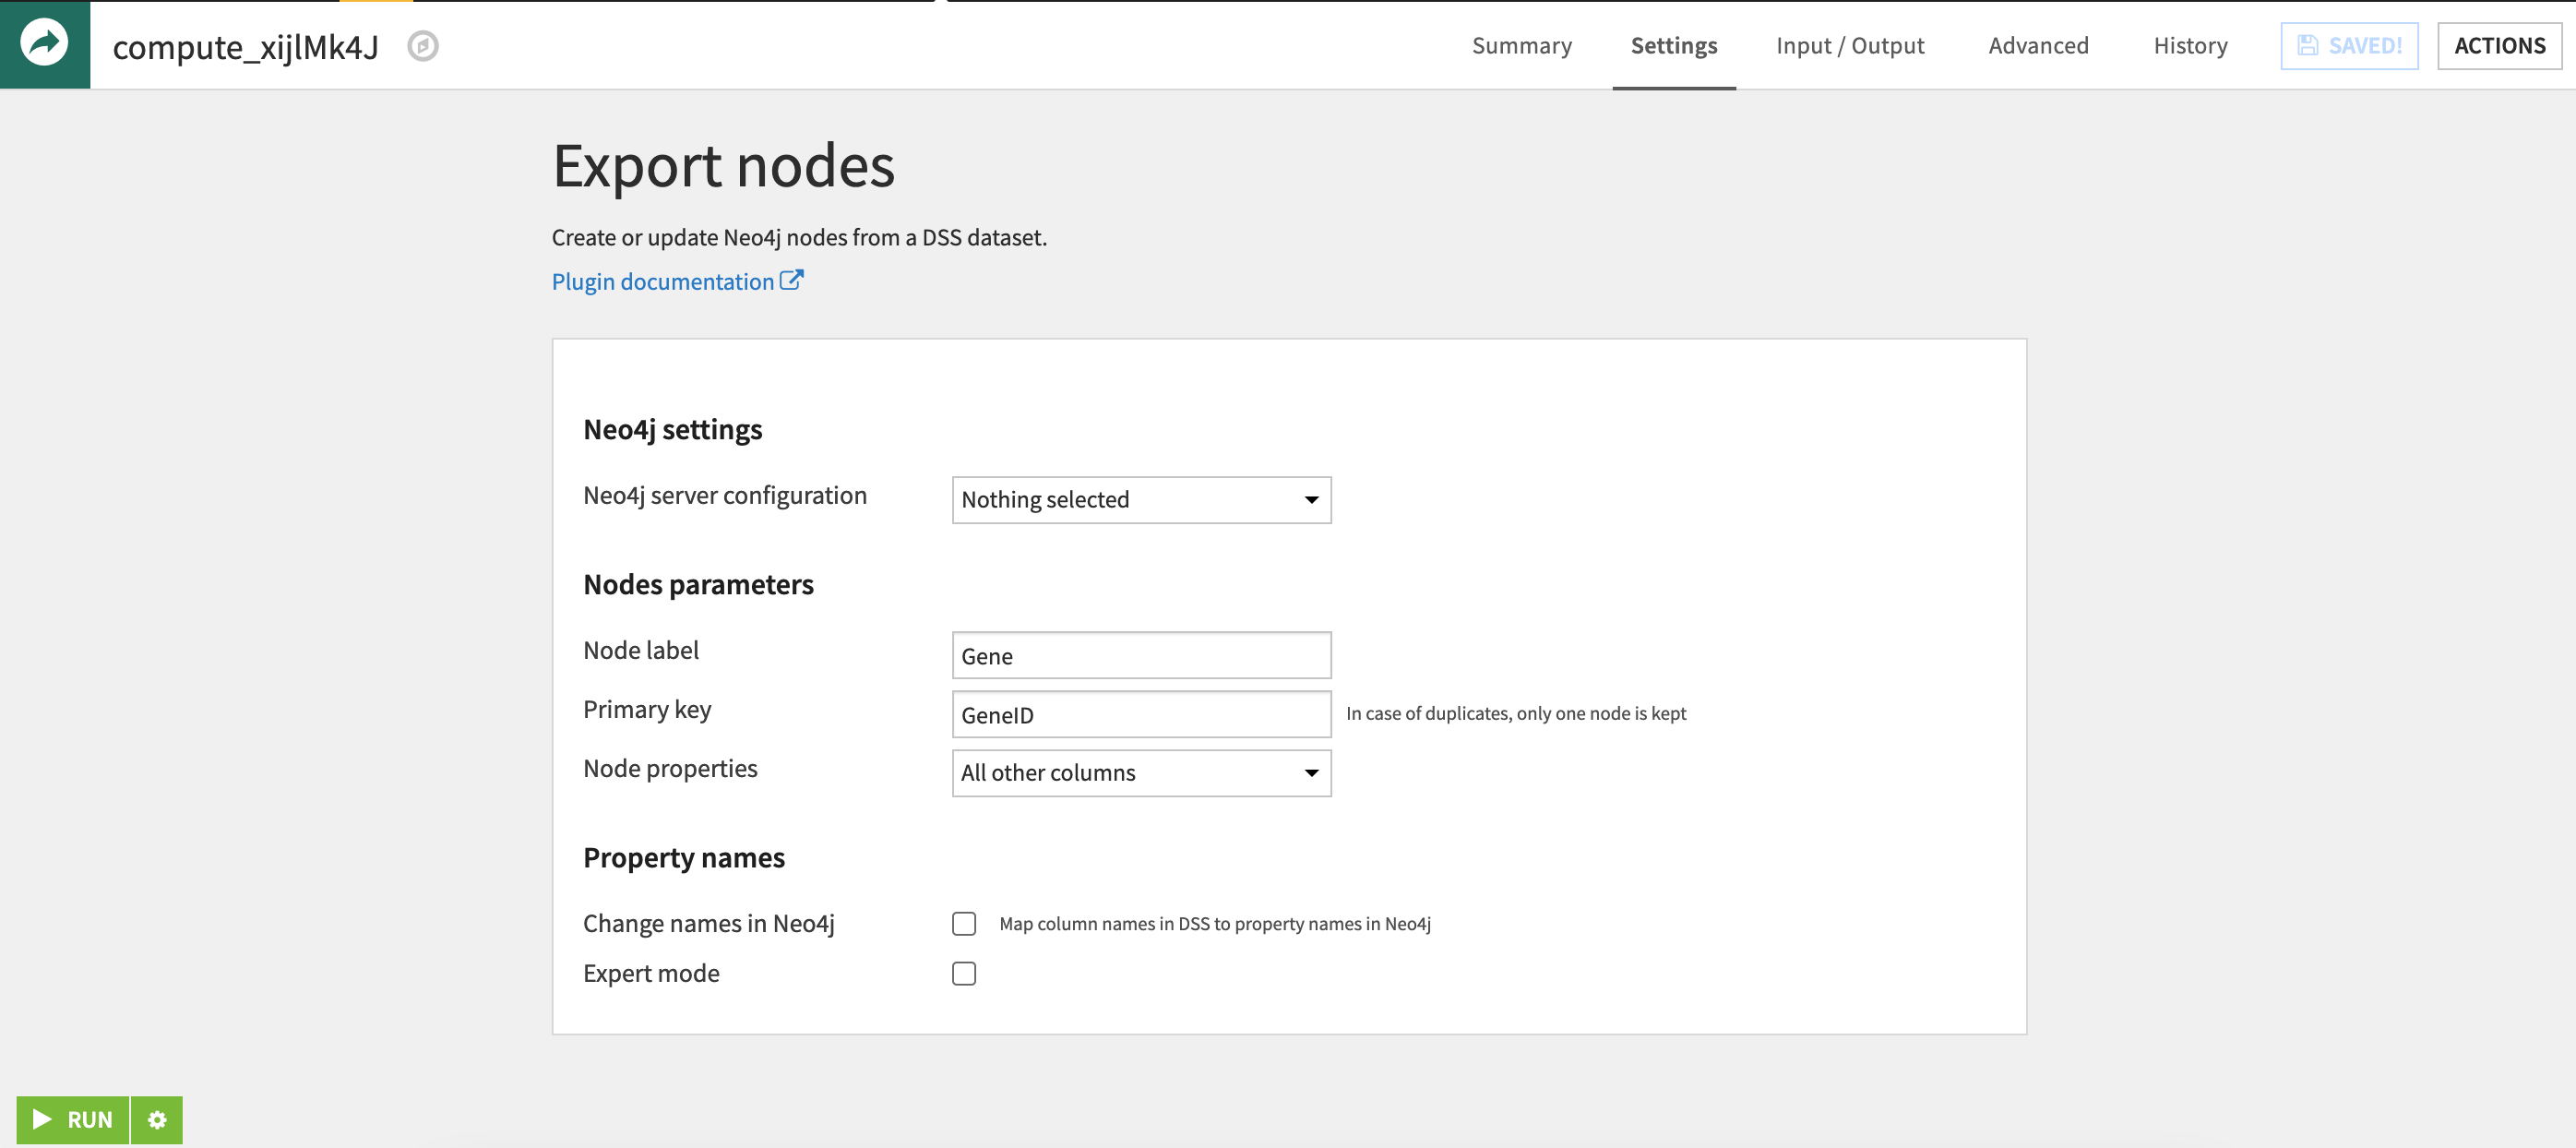
Once the datasets are ready, we use the Neo4j plugin to easily export these nodes to the database. The export recipe takes a single dataset of nodes, allows you to define the node label, and point to a column in the dataset to act as a unique identifier for each node. For more information on how to use the export features of this plugin, please see the Neo4j Plugin Page .
Blending Data for Edges
Edges are the relationships between two nodes of a graph. In the case of drug repurposing, computing the edges for so many different types of nodes means blending data from multiple sources that use different keys to identify genes, diseases, etc. Joining two datasets, such as Diseases and Genes, implicitly creates a relationship between these two nodes (i.e. different diseases are associated with certain genes and vice versa). Similar to exporting nodes, the Neo4j plugin offers a recipe to export relationships.
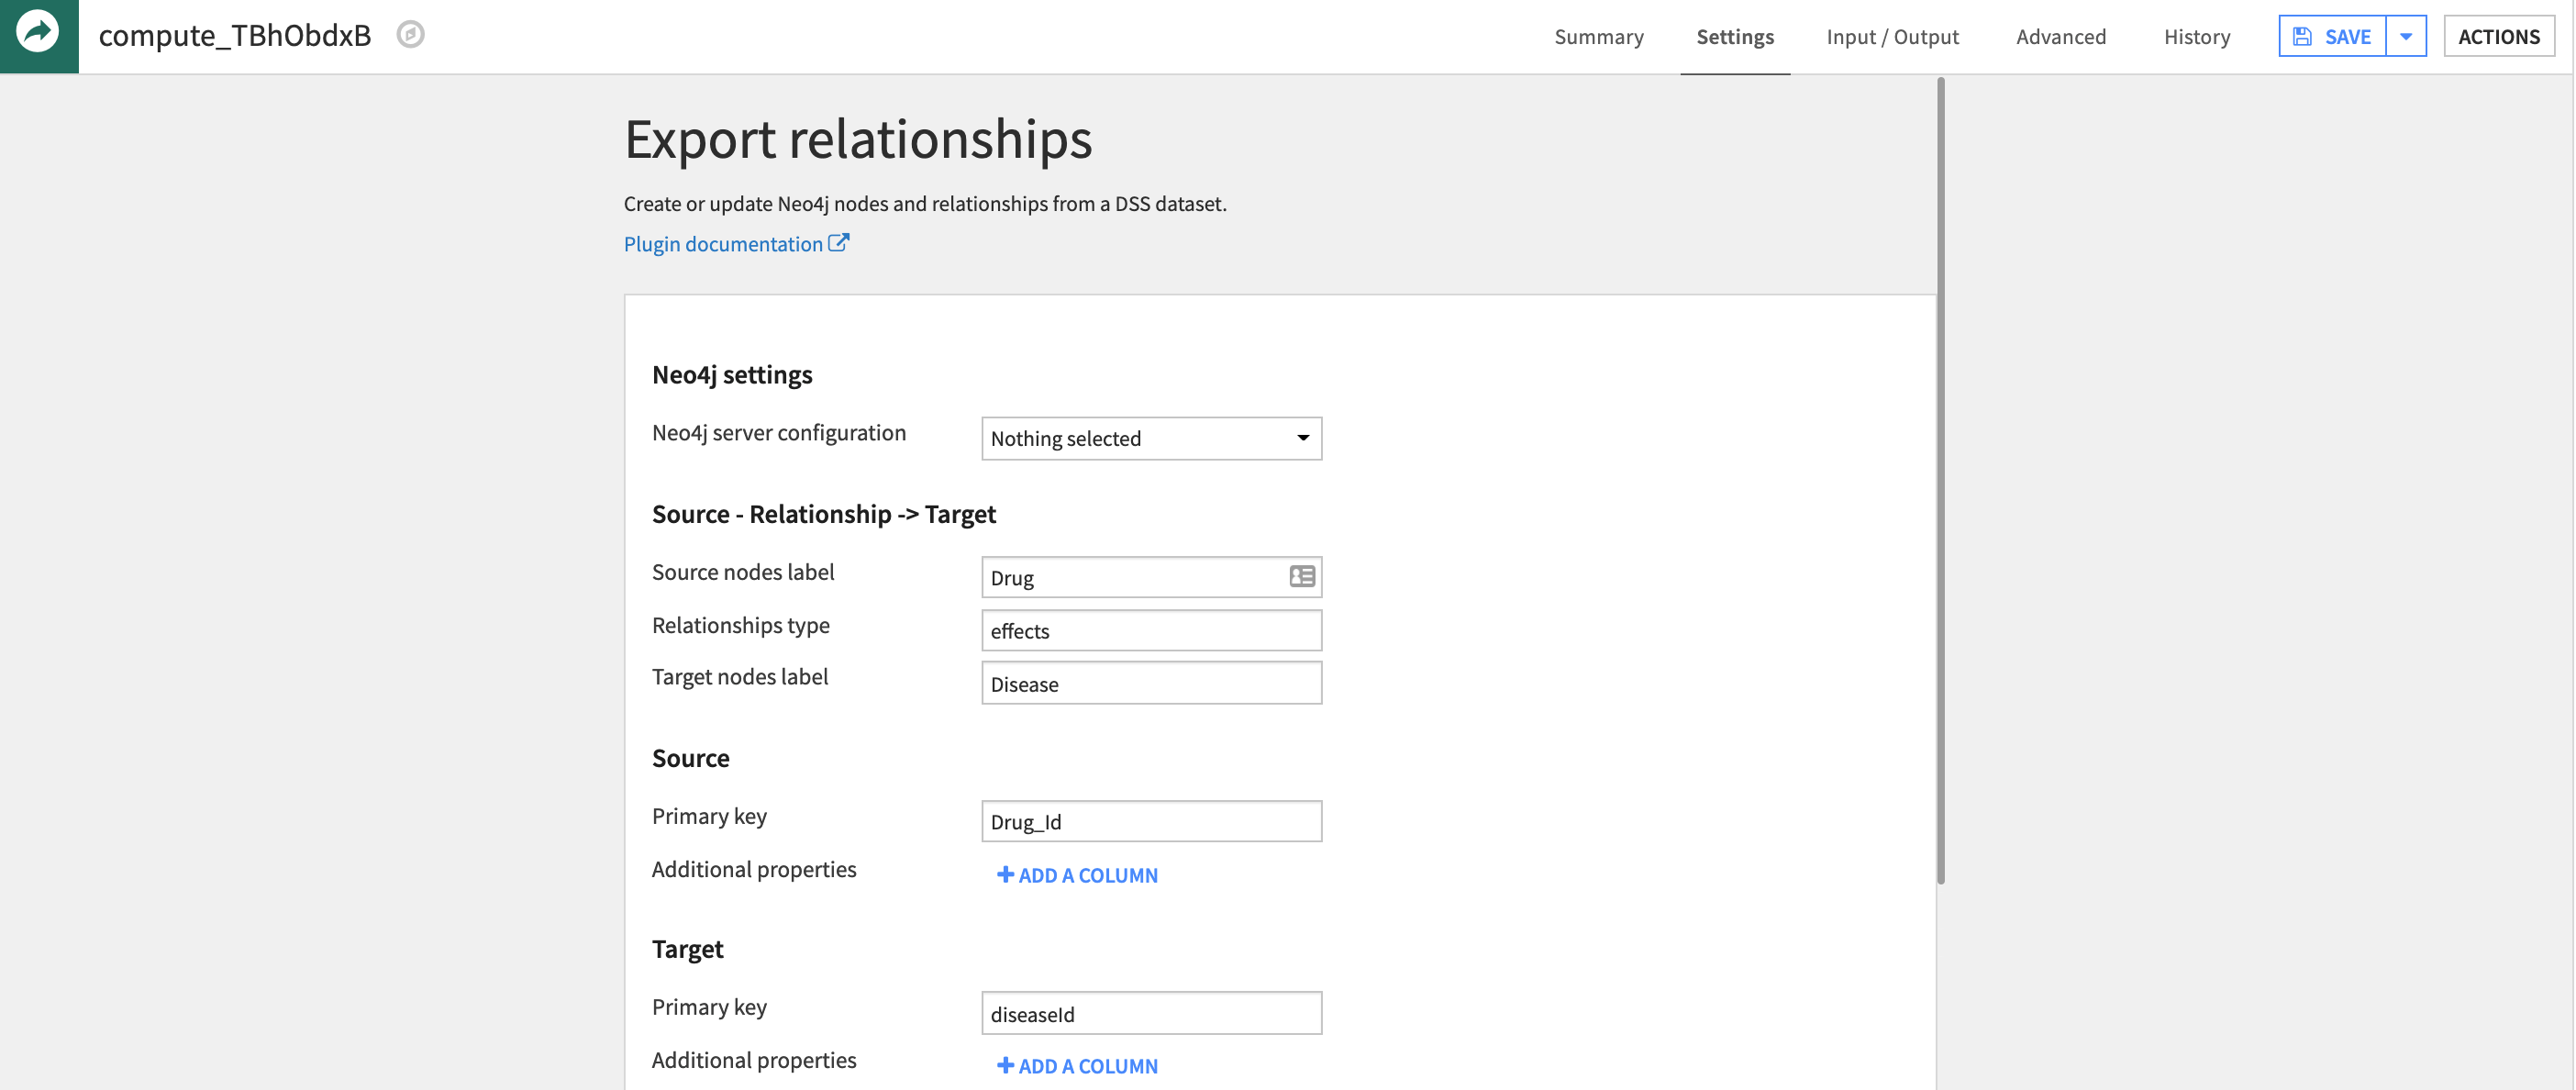
As a requirement, the exported dataset must have a unique column for two different types nodes, such as the post-join Disease_Gene dataset. When using the export recipe, you can define the relationship between the two nodes using a text field. It is important to ensure the labeling convention for nodes is consistent between the node and relationship exports, such as ‘Gene ID’, otherwise the plugin will assume a new type of node in the graph.
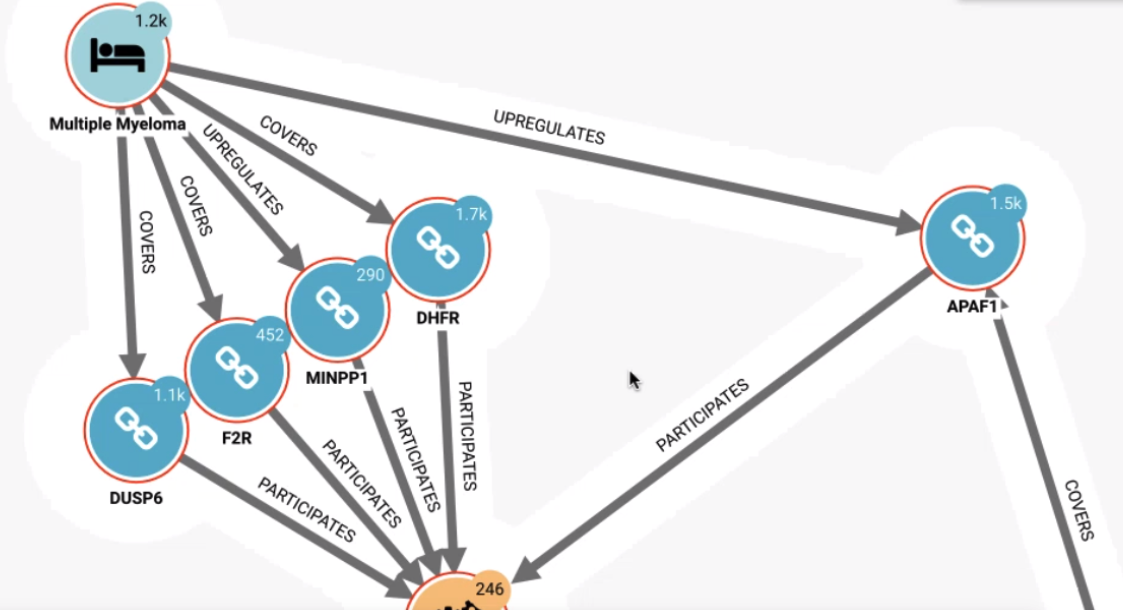
Analysis with Neo4j and Linkurious
Finally, we can use Neo4J and Linkurious to store the complex graph relationship and extract meaning from the various edges and paths between nodes. You can also add your own datasets and sources of information into the graph network.
While all the data used in this project is publically available, the baseline graph can be enhanced and supplemented with proprietary data. The Neo4j plugin can also be used in reverse to download specific data back to Dataiku using a custom Cypher query.