Hands-On: Perform Bivariate Analysis
Note
This lesson is a continuation of the Interactive Visual Statistics hands-on tutorial.
Next, let’s use the Bivariate analysis card to examine the data distribution for pairs of variables simultaneously.
For example, let’s examine the response variable (type) for each factor variable (density and alcohol). To examine the distributions for each factor-response pair:
Click the New Card button from the “Worksheet” header, and then select Bivariate analysis. This brings up the “Bivariate analysis” window.
Select the variables: density and alcohol, and click the “plus” icon to add them to the “Factor(s)” box. Then select type and add it to the “Response” box. Notice that DSS selects the statistical “Options” that are appropriate based on the combination of the variable types.
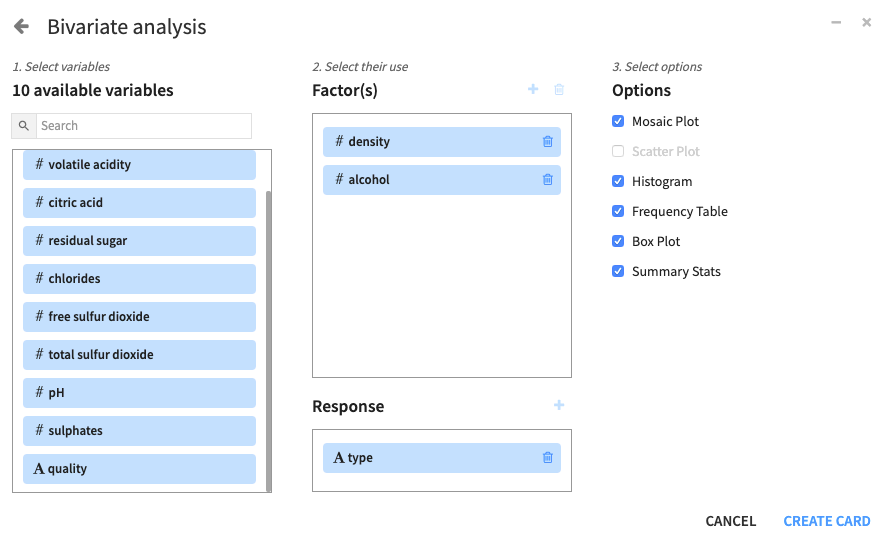
Click Create Card to create the bivariate analysis card.
DSS creates a card with one section for each factor-response pair.
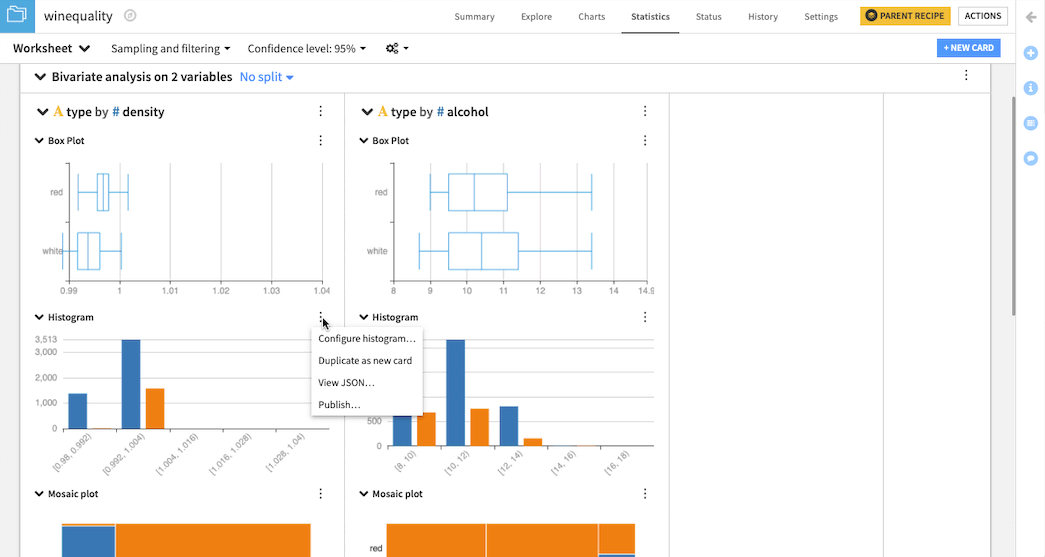
Notice that each descriptive statistical option (e.g. histogram) in the card has a menu (⋮) that provides options to configure its output. For example, clicking the menu for a histogram plot provides options that include Configure histogram….
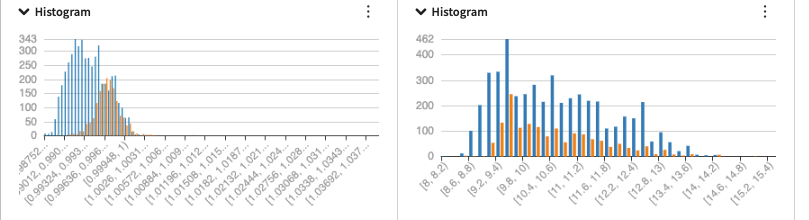
To get a better view of the distributions from the histogram plots, click Configure histogram… for each histogram plot, and change the “Max nb. of bins:” value for density (and alcohol) from
5to100.
The card also shows additional options, as appropriate, for the selected variable types. For more information about the bivariate analysis card, see Bivariate Analysis in the reference documentation.