Market Basket Analysis
Overview
Business Case
Personalization is a huge opportunity for Retail and CPG businesses: 80% of companies report seeing an uplift since implementing personalization, which includes recommending relevant products to users. Several techniques can be used to build relevant recommendations: one of them is the Market Basket Analysis, used by retailers to increase sales by better understanding customer purchasing patterns. It relies on the analysis of large purchase history dataset to identify products that are likely to be purchased together.
One of the most famous examples of it is the well-known e-commerce giant which heavily uses “Frequently bought together” items on the product pages. It can also be leveraged by bricks-and-mortar stores: for example, a sports shop could choose to place running shoes next to swimsuits based on the analysis to increase sales. Overall, it is a great and powerful way to generate value through several use cases: optimizing product placement both online and offline, offering product bundles deals etc. While driving additional sales for the retailer and enhancing the shopping experience for customers, Market Basket Analysis is a key asset to make the customers build brand loyalty toward the company.
The solution consists of a data pipeline that computes association rules, identifies product recommendations for customers, and in doing so opens up a wide range of product and purchasing analyses. Analysts can input their own data and surface the outputs in a dashboard or interactive WebApp in order to analyze their organization’s own transaction data. Data Scientists should use this solution as an initial building block to develop advanced analytics / support decision making. Roll-out and customization services can be offered on demand.
Technical Requirements
Warning
It is strongly recommended to read the project wiki before using this solution as it further explains many of the parameters, requirements, and deliverables throughout the solution.
To leverage this solution, you must meet the following requirements:
Have access to a DSS 9.0+ instance
To benefit natively from the solution, a PostgreSQL or Snowflake connection storing your transaction data (see Data Requirements) is needed
A Python 3.6 code environment named
solution_market-basket-analysiswith the following required packages:
mlxtend==0.18.0
dateparser==1.0.0
regex==2022.3.2
Flask==2.0.1
Note
Dataiku Online instances will auto-install these requirements when the Solution is created.
Installation
This solution is available to install on Dataiku and Dataiku Online instances.
Installing on your Dataiku Instance
If the technical requirements are met, this solution can be installed in one of two ways:
On your Dataiku instance click + New Project > Industry solutions > Retail > Market Basket Analysis.
Download the .zip project file and upload it directly to your Dataiku instance as a new project.
Note
If running a DSS 9 instance, the solution is found by navigating to + New Project > Sample projects > Solutions > Market Basket Analysis
Installing on a Dataiku Online Instance
Dataiku Online customers can add this Solution to their managed instance from the Launchpad: Features > Add A Feature > Extensions > Market Basket Analysis
Data Requirements
The Dataiku flow was initially built using publicly available data. However, this project is meant to be used with your own data which can be uploaded using the Dataiku Application. Having a transactional historical dataset is mandatory to run the project and each row of the dataset should be comprised of:
The Description column describes the item and is later used as the item identifier.
The InvoiceNo column serves as our transaction identifier.
The InvoiceDate column will contextualize the purchase of an item, within a transaction, on a given date
Optionally, the transactions_dataset can also have rows containing
CustomerID for incorporating customer data
Country to contextualize transactions on where they occurred.
Workflow Overview
You can follow along with the sample project in the Dataiku gallery.
The project has the following high level steps:
Connect your data as an input and select your analysis parameters via the Dataiku Application.
Ingest and pre-process the data to be compatible with the association rules computation.
Compute the association rules and filter the most relevant rules for better consumption downstream.
Identify products to be recommended to customers based on their past transactions.
Interactively visualize the most frequently bought items, and the products associated with them for smarter product recommendations.
Walkthrough
Note
In addition to reading this document, it is recommended to read the wiki of the project before beginning in order to get a deeper technical understanding of how this solution was created, the different types of data enrichment available, longer explanations of solution specific vocabulary, and suggested future direction for the solution.
Plug and play with your own data and parameter choices
To begin, you will need to create a new instance of the Market Basket Analysis Dataiku Application. This can be done by selecting the Dataiku Application from your instance home, and click Create App Instance.
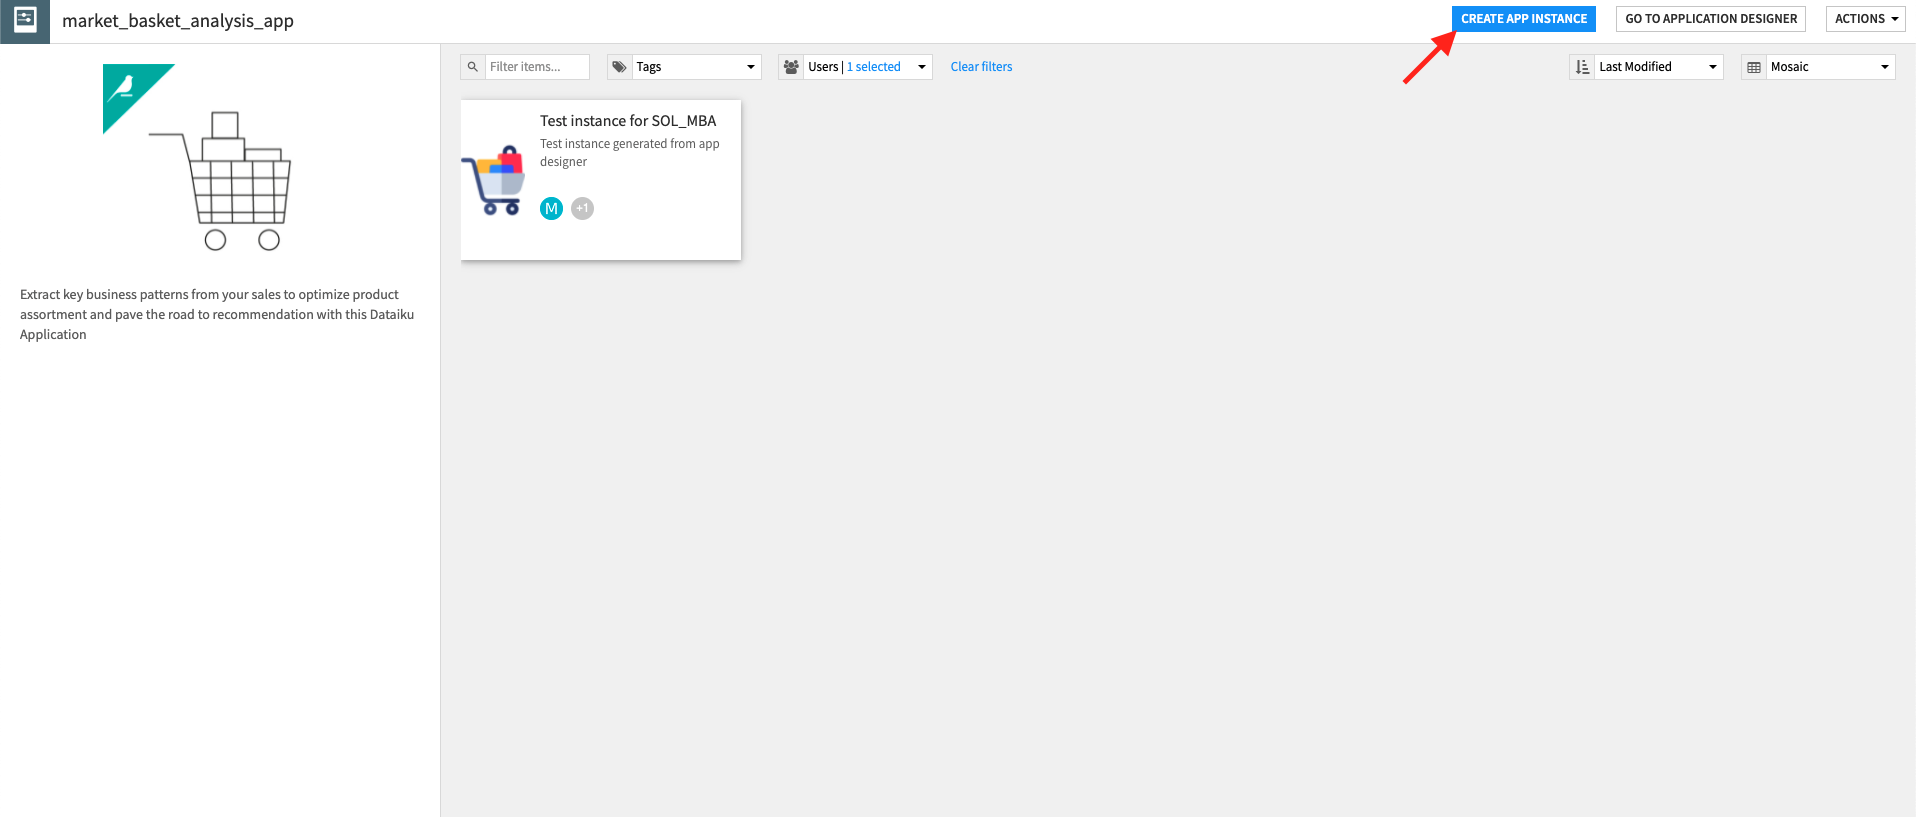
Once the new instance has been created you can walk through the steps of the Application to add your data and select the analysis parameters to be run.
In the Inputs section of the Application, reconfigure the connection parameters of the flow. By default the solution works with datasets in a filesystem connection. To connect the solution to your own transaction data you will need your admin to inform you on your connection type and schema to be input into the Application parameters. Once completed, the RECONFIGURE button will rebuild the full flow to work with your data. Following reconfiguration you can refresh the webpage and search for and test the transaction dataset.
Once your data has been uploaded, the data needs to be preprocessed before association rules are identified. Within the Transactions preprocessing section of the App, we can define how we want our transactions dataset to be transformed. Specifically, it is here where we can map the schema of our input transaction dataset to the solution defined scheme (See Data Requirements section above). Additionally, we can filter the data by a specified period of time, clarify how the dates are formatted, and filter transactions based on a minimum number of items purchased.
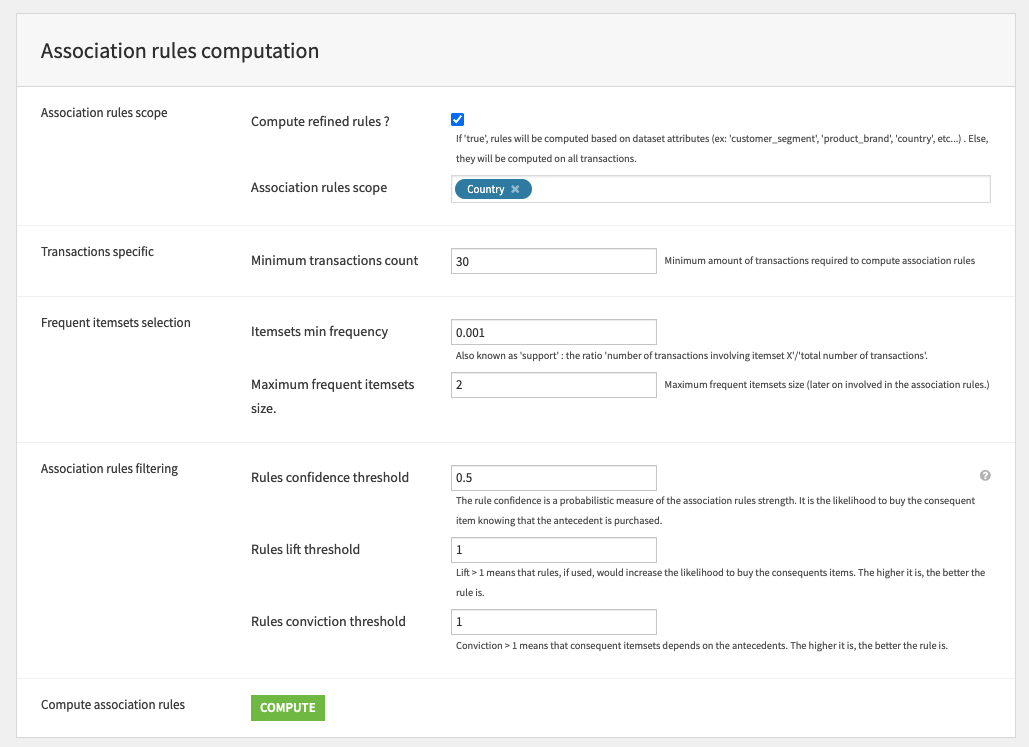
With our data filtered and formatted correctly, we are ready to move to Association rules computation to define the parameters linked to the association rule learning process. A more detailed rules process can be applied by selecting Compute refined rules and inputting the desired rules scope (e.g. Country). The remaining parameters of this section allow us to define how we calculate association rules (minimum number of transactions to be considered, itemset frequency) and filtering (confidence, lift, and conviction thresholds).
In order to recommend items to customers, several parameters need to be set in the Customers recommendations section. First and foremost, we have to define our prioritization for rules metrics to be applied to customers (i.e. confidence, lift, conviction, or support). We can also filter customer transaction dates and set a maximum number of transactions per customer to keep in the analysis.
We offer two final sections to make the Dataiku App more production ready. The Build specific flow parts section allows us to only build the parts of the solution that are relevant to us based on our specific needs at the moment (i.e. if we only want to rebuild customer recommendations, we shouldn’t need to build the whole flow again). The Automation section activates pre-built scenarios in order to refresh the project with new data over time.
Once we’ve built all elements of our Dataiku Application you can either continue to the Project View to explore the generated datasets or go straight to the Dashboards and WebApp to visualize the data. If you’re mainly interested in the visual components of this pre-packaged solution, feel free to skip over the next section.
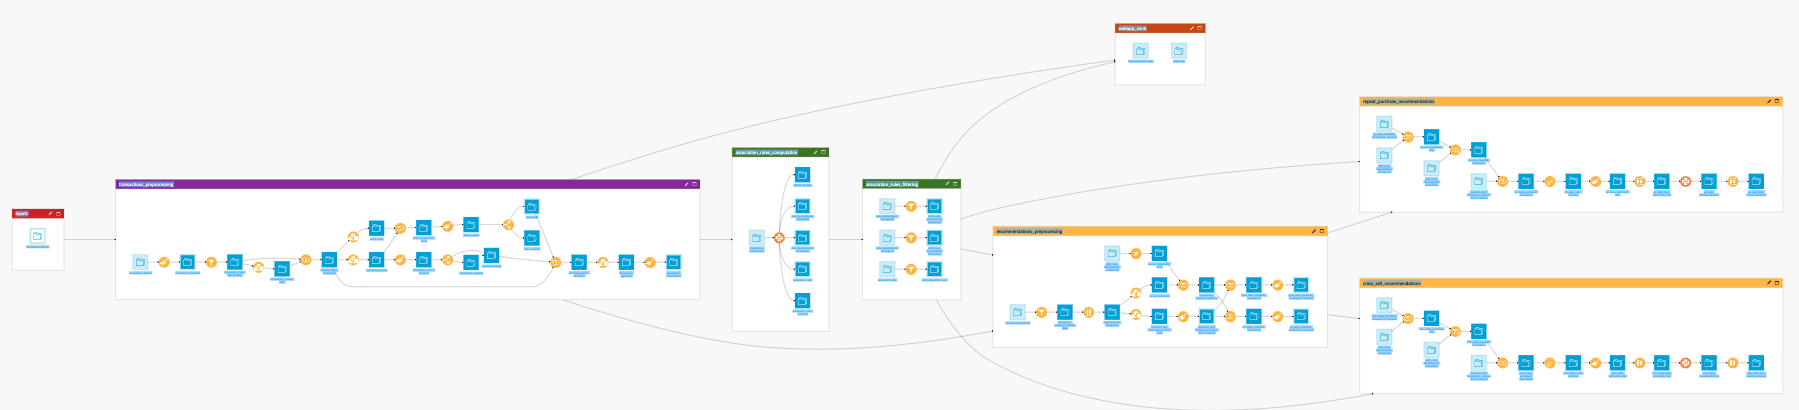
Under the Hood: What happens in the Dataiku Application’s underlying Flow?
The Dataiku Application is built on top of a Dataiku Flow that has been optimized to accept input datasets and respond to your select parameters. Let’s quickly walk through the different flow zones to get an idea of how this was done.
The inputs contains a single dataset which is populated by ingesting our transactions table defined in the Inputs section of the Application. By default it contains a publicly available dataset we have provided.
The transactions_preprocessing flow zone looks a bit intimidating but is, in reality, a series of visual steps that clean the data and filter it based on the parameters set in the Dataiku Application. It outputs the transactions_preprocessed dataset which is used for association rules computation.
The association_rules_computation zone generates all learned association rules between items based on the transaction history and defined Application parameters. The resulting 5 datasets represent the learned association rules, identified itemsets (products bought together), consequences, antecedents, and a general summary. The project wiki goes into great detail on the different datasets and their contents.
As you will see when exploring the output datasets generated by the association rules computation, it’s possible to have a large amount of learned rules. It’s therefore important to filter the most relevant rules based on our self defined thresholds. As a reminder, we can filter rules based on 4 metrics selected in the Dataiku Application.
Support the proportion of transactions which contain both itemsets (e.g. tomato and onion).
Confidence of a rule is the conditional probability of getting one itemset (e.g. tomato) knowing another itemset (e.g. onion).
Lift measures the power of a rule and the strength of a dependent relationship between itemsets.
Conviction measures the dependency of a rule outcome to its trigger.
Three flow zones are dedicated to creating recommendations based on the association rules we’ve chosen to use.:
We begin with the recommendations_preprocessing zone which uses the filtering parameters set in the Dataiku Application to filter on transactions dates before computing all the distinct purchased items, identifying unique customers, and applying our association rules to identify all the associated items that each customer could have purchased based on what they did purchase. This zone results in two product-oriented outputs: (1) repeat purchases candidates and (2) cross-sell candidates.
The cross_sales_recommendations zone identifies products that are likely to be purchased together based on the association rules learnings so that we can personalize recommendation of products online and place strongly associated items close together in our physical stores.
The repeat_purchase_recommendations zone also identifies products using association rules but in this case it focuses on items that are likely to be re-purchased. This enables us to tailor promotions and marketing for our existing customer base.
Finally, the webapp_zone isolates the datasets required for the backend of this solution’s webapps.
Further explore your association rules with shareable visualizations
The Market Basket Analysis solution comes with a prebuilt dashboard containing:
3 slides with visualizations built with Dataiku charts to make consumption of the project’s datasets easier to consume
2 slides with interactive Webapps to allow us to explore the association rules and product recommendations derived from our transactions data
Note
Both the charts and Webapps are impacted by parameters selected in the Dataiku Application so final renderings in your own projects may differ as a result.
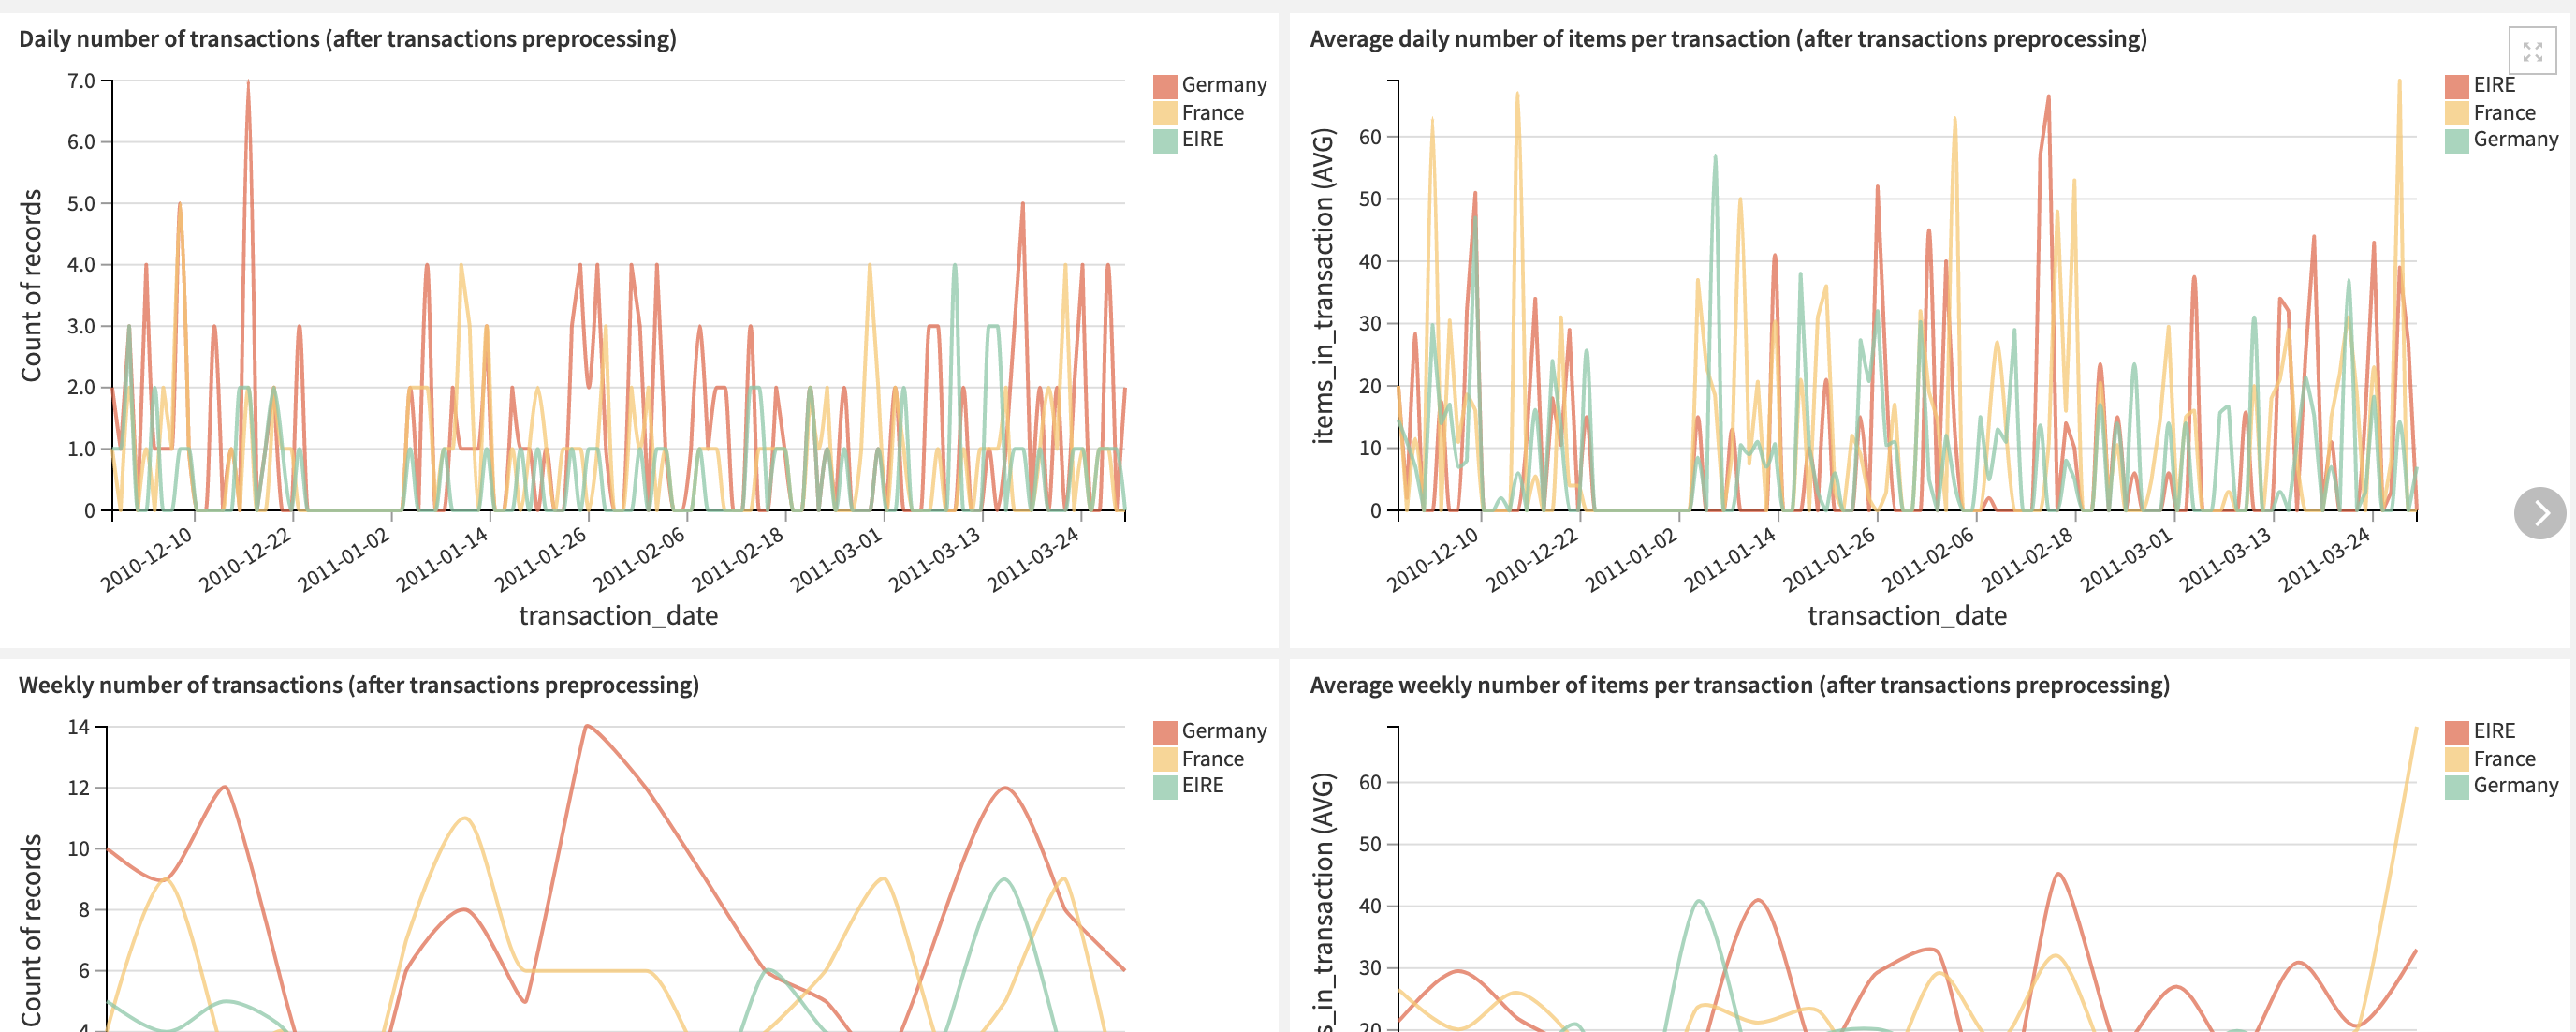
The dashboard charts give a variety of visual ways to understand our transactions dataset both before and after applying preprocessing. These visualizations alone can give us an overview of the transactions impacting our Market Basket Analysis, identify purchasing patterns, understand the origin of certain association rules, and better tune the parameters of the Dataiku Application to more easily find association rules.
The final two slides of the dashboard contain two Webapps: Items frequency analysis and Rules browser. If you are unable to interact with the Webapp within the dashboard, you might need to start/restart the Webapp backend. This can be done by going to the Webapp menu or by running the restart_webapp_backend scenario.
Let’s first take a look at the Items frequency analysis Webapp which allows us to analyze the support of our most frequent items. The images contained in this article use the “Country” column of our transactions dataset as an association rule scope. Within this Webapp there are some additional helpers that can be expanded to better understand the wording used throughout.
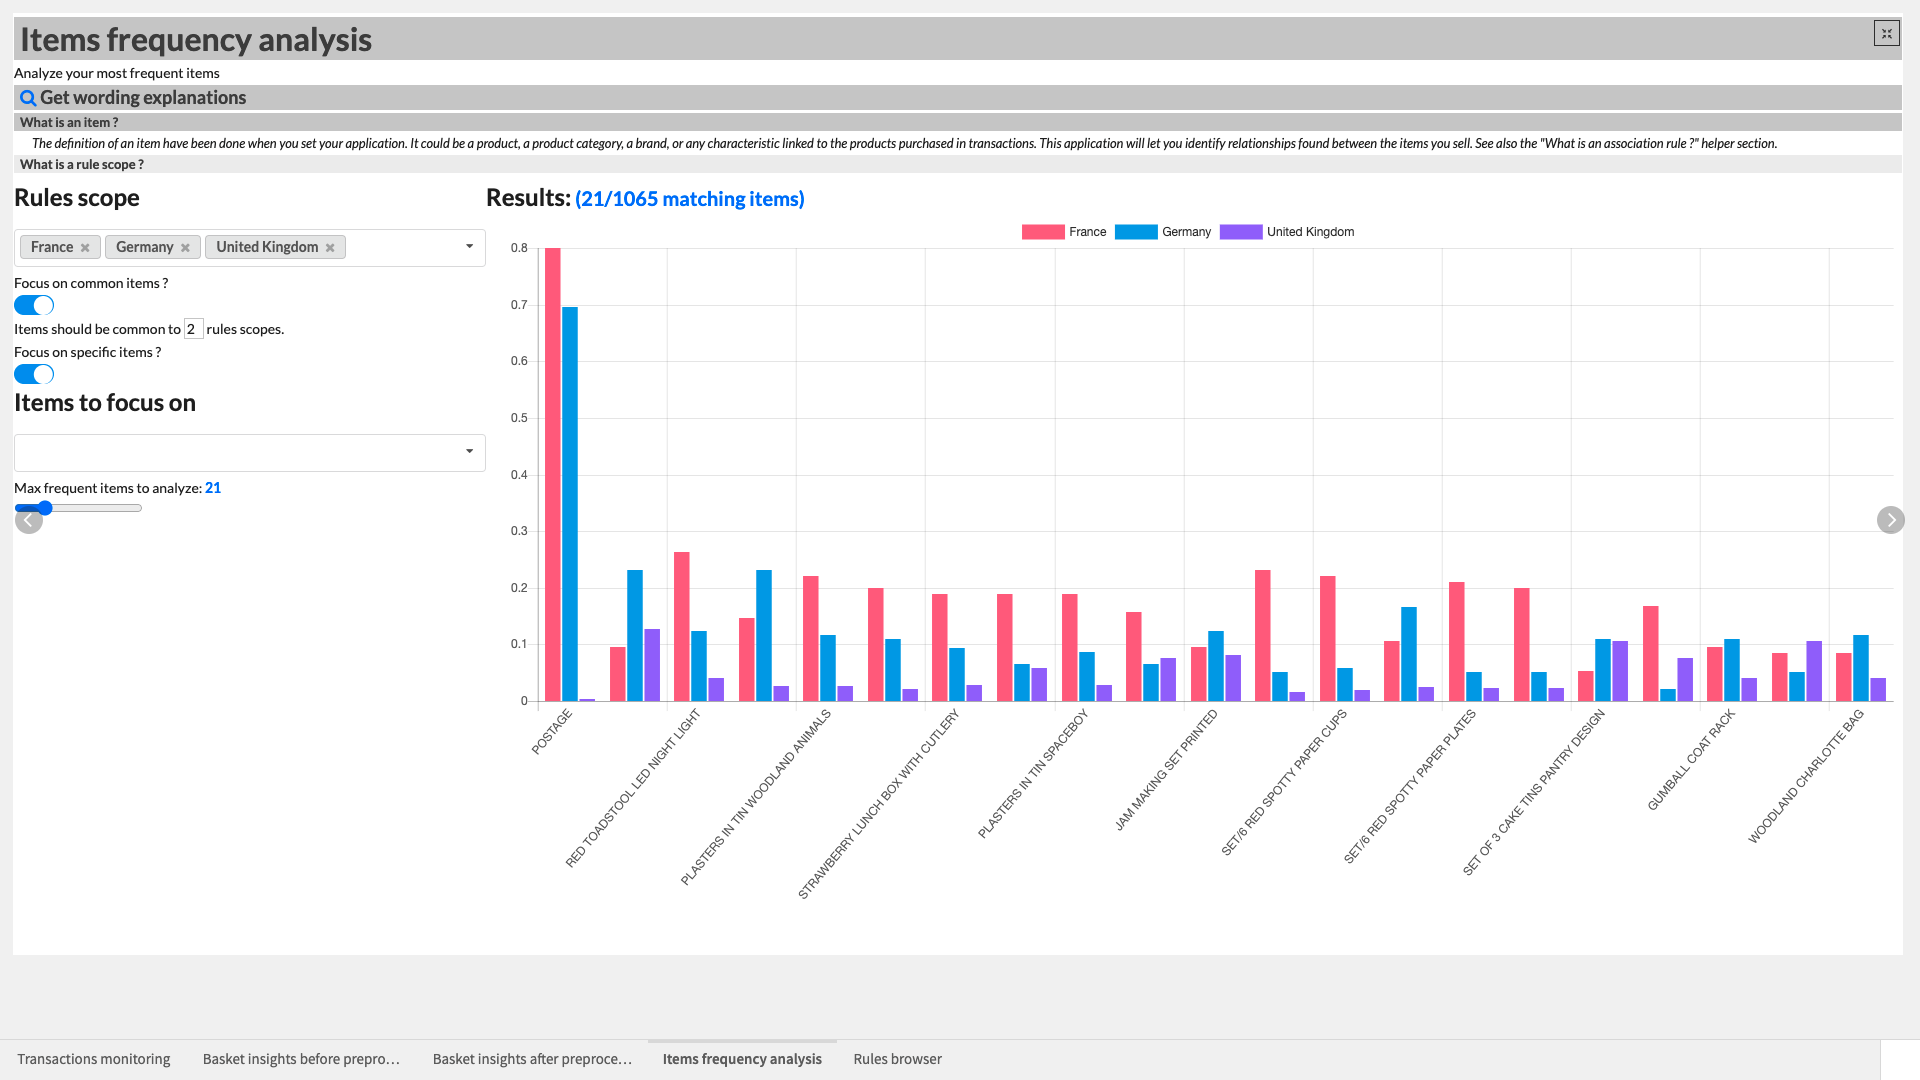
If a rules scope was configured in the Dataiku Application, you will need to choose at least one rules scope (e.g. one Country). We can additionally choose to focus on items that are common to a specified number of rules and/or select specific items to focus on from the full list of frequent items identified in our transactions dataset. A counter at the top of the WebApp shows how many items out of the total item count match the filters we’ve set.
Let’s end by taking a look at the Rules browser Webapp found in the final slide of the dashboard. This Webapp allows us to choose our most frequent items in order to browse the computed association rules linked to them. Once again there are expandable helpers to clarify the language used in this Webapp. We can interact with the Webapp by first searching for selecting one or more items (e.g. Blue Pen, Party Balloons). Selecting an item will allow us to visualize their associated rules on the right split into Triggers (the antecedent of the rule, aka. the item we selected) and Outcomes (the consequent of the rules, aka items they are associated with). Hovering over an underlined value will provide a quick description of the metric.
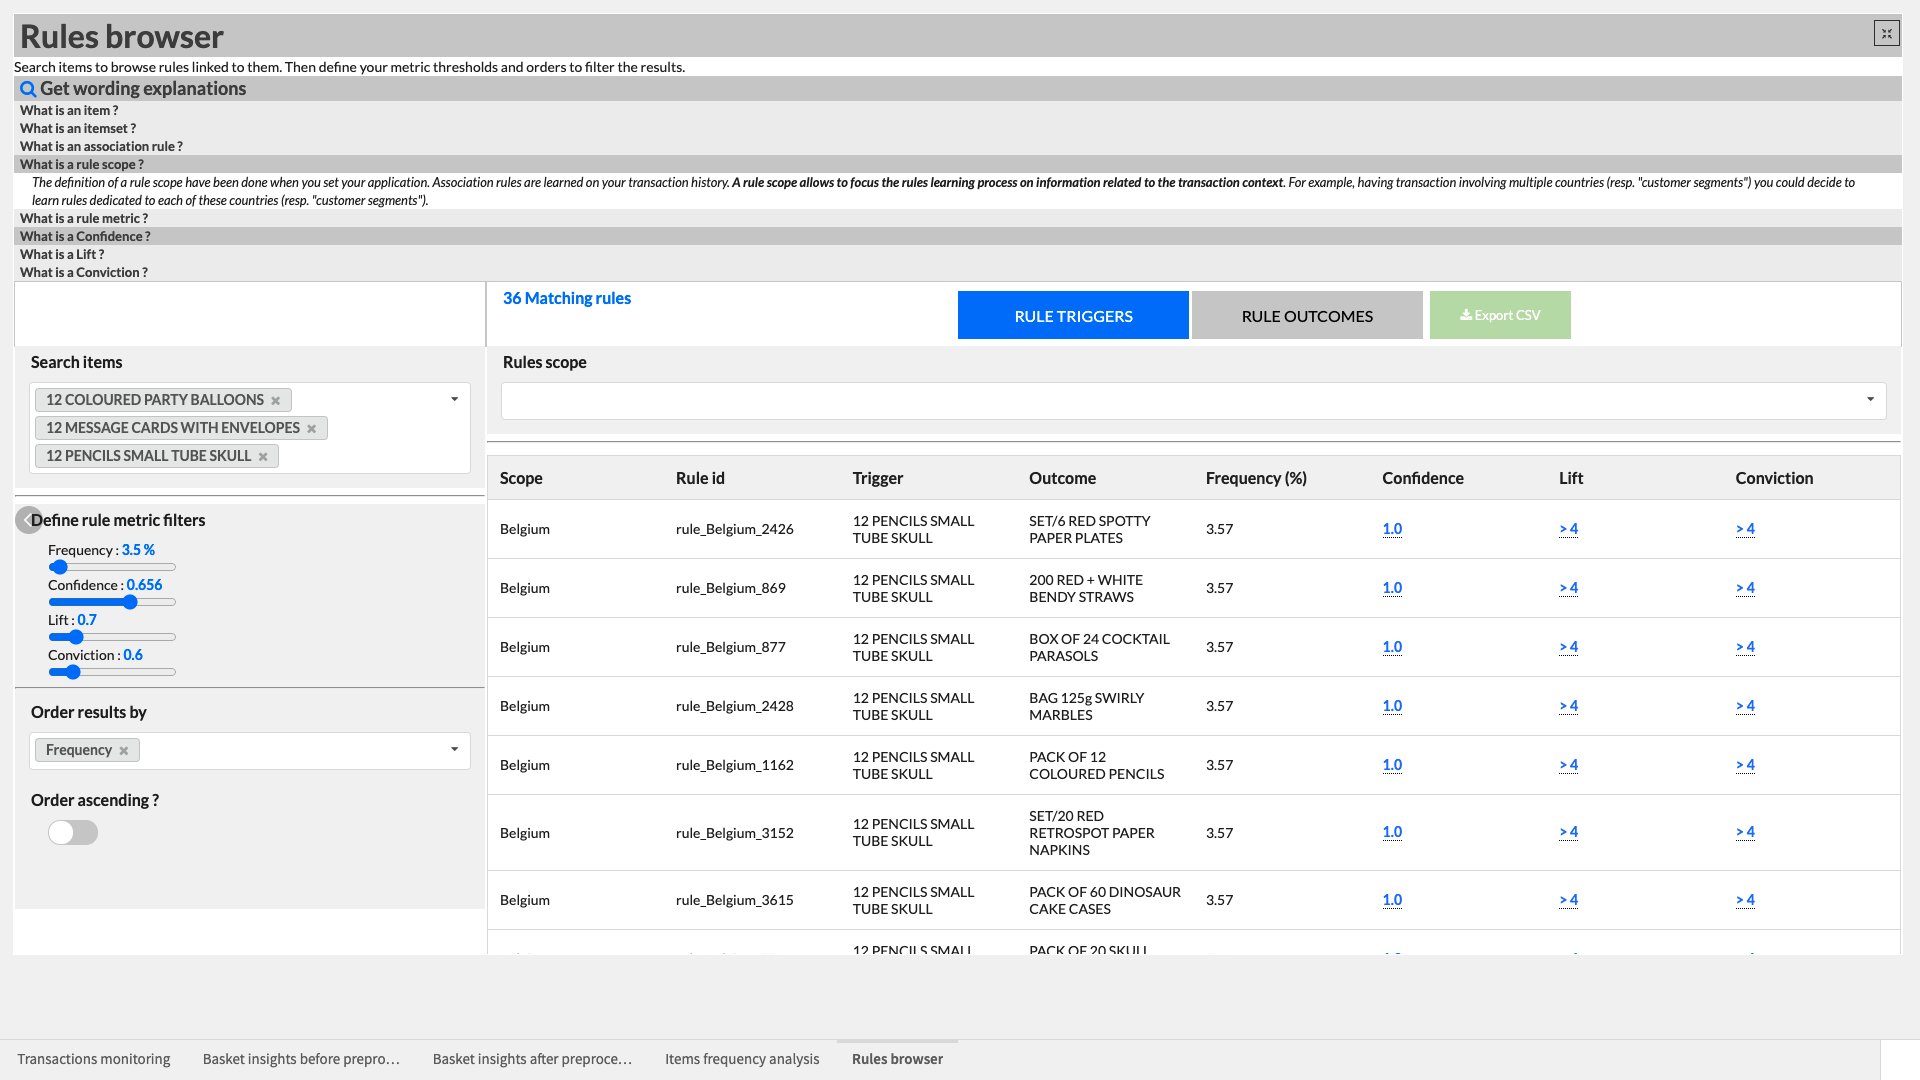
We can browse the computed association rules more easily using the other interactive elements of the Webapp by:
Swapping between the two tabs of Triggers or Outcomes
Filtering rules based on a rule metric threshold
Ordering results (ascending or descending) by one of the rules metrics
Additionally, we can export the results of our interactive analysis as a CSV for further sharing and/or analysis.
A short note on automation
As mentioned in the Dataiku Application section of this article, it is possible to automate the flow of this solution to be triggered based on new data, a specific time etc. All of these trigger parameters can be tuned in the Scenarios menu of the project. Additionally, reporters can be created to send messages to Teams, Slack, email, etc. to keep our full organization informed. These scenarios can also be run ad-hoc as needed. Full detail on the scenarios and project automation can be found in the wiki.