Hands-On: Automation with Metrics, Checks & Scenarios
Tip
The hands-on tutorial below on how to automate workflows in Dataiku DSS using metrics, checks, and scenarios is also found in the Dataiku Academy’s Automation course, which is part of the Advanced Designer learning path. Register for the course if you’d like to track and validate your knowledge alongside concept videos, summaries, and quizzes.
Hands-On Tutorial: Metrics & Checks (Part 1)
In a data science project, datasets need to be updated; models need to be rebuilt; and dashboards need to be refreshed. In order to put such a project into production, it is essential to have tools that can track the evolution of objects.
Key to achieving this process in Dataiku DSS are metrics, checks, and scenarios.
Let’s Get Started!
This hands-on tutorial has three parts:
In the first part, we’ll focus on understanding how to use metrics and checks in Dataiku DSS in order to monitor the status of datasets and models.
In the second part, we’ll demonstrate how to use metrics and checks inside of a scenario in order to safely automate workflows.
In the third part, we’ll look at ways to customize metrics, checks, and scenarios with code.
Advanced Designer Prerequisites
This lesson assumes that you have basic knowledge of working with Dataiku DSS datasets and recipes.
Note
If not already on the Advanced Designer learning path, completing the Core Designer Certificate is recommended.
You’ll need access to an instance of Dataiku DSS (version 9.0 or above) with the following plugins installed:
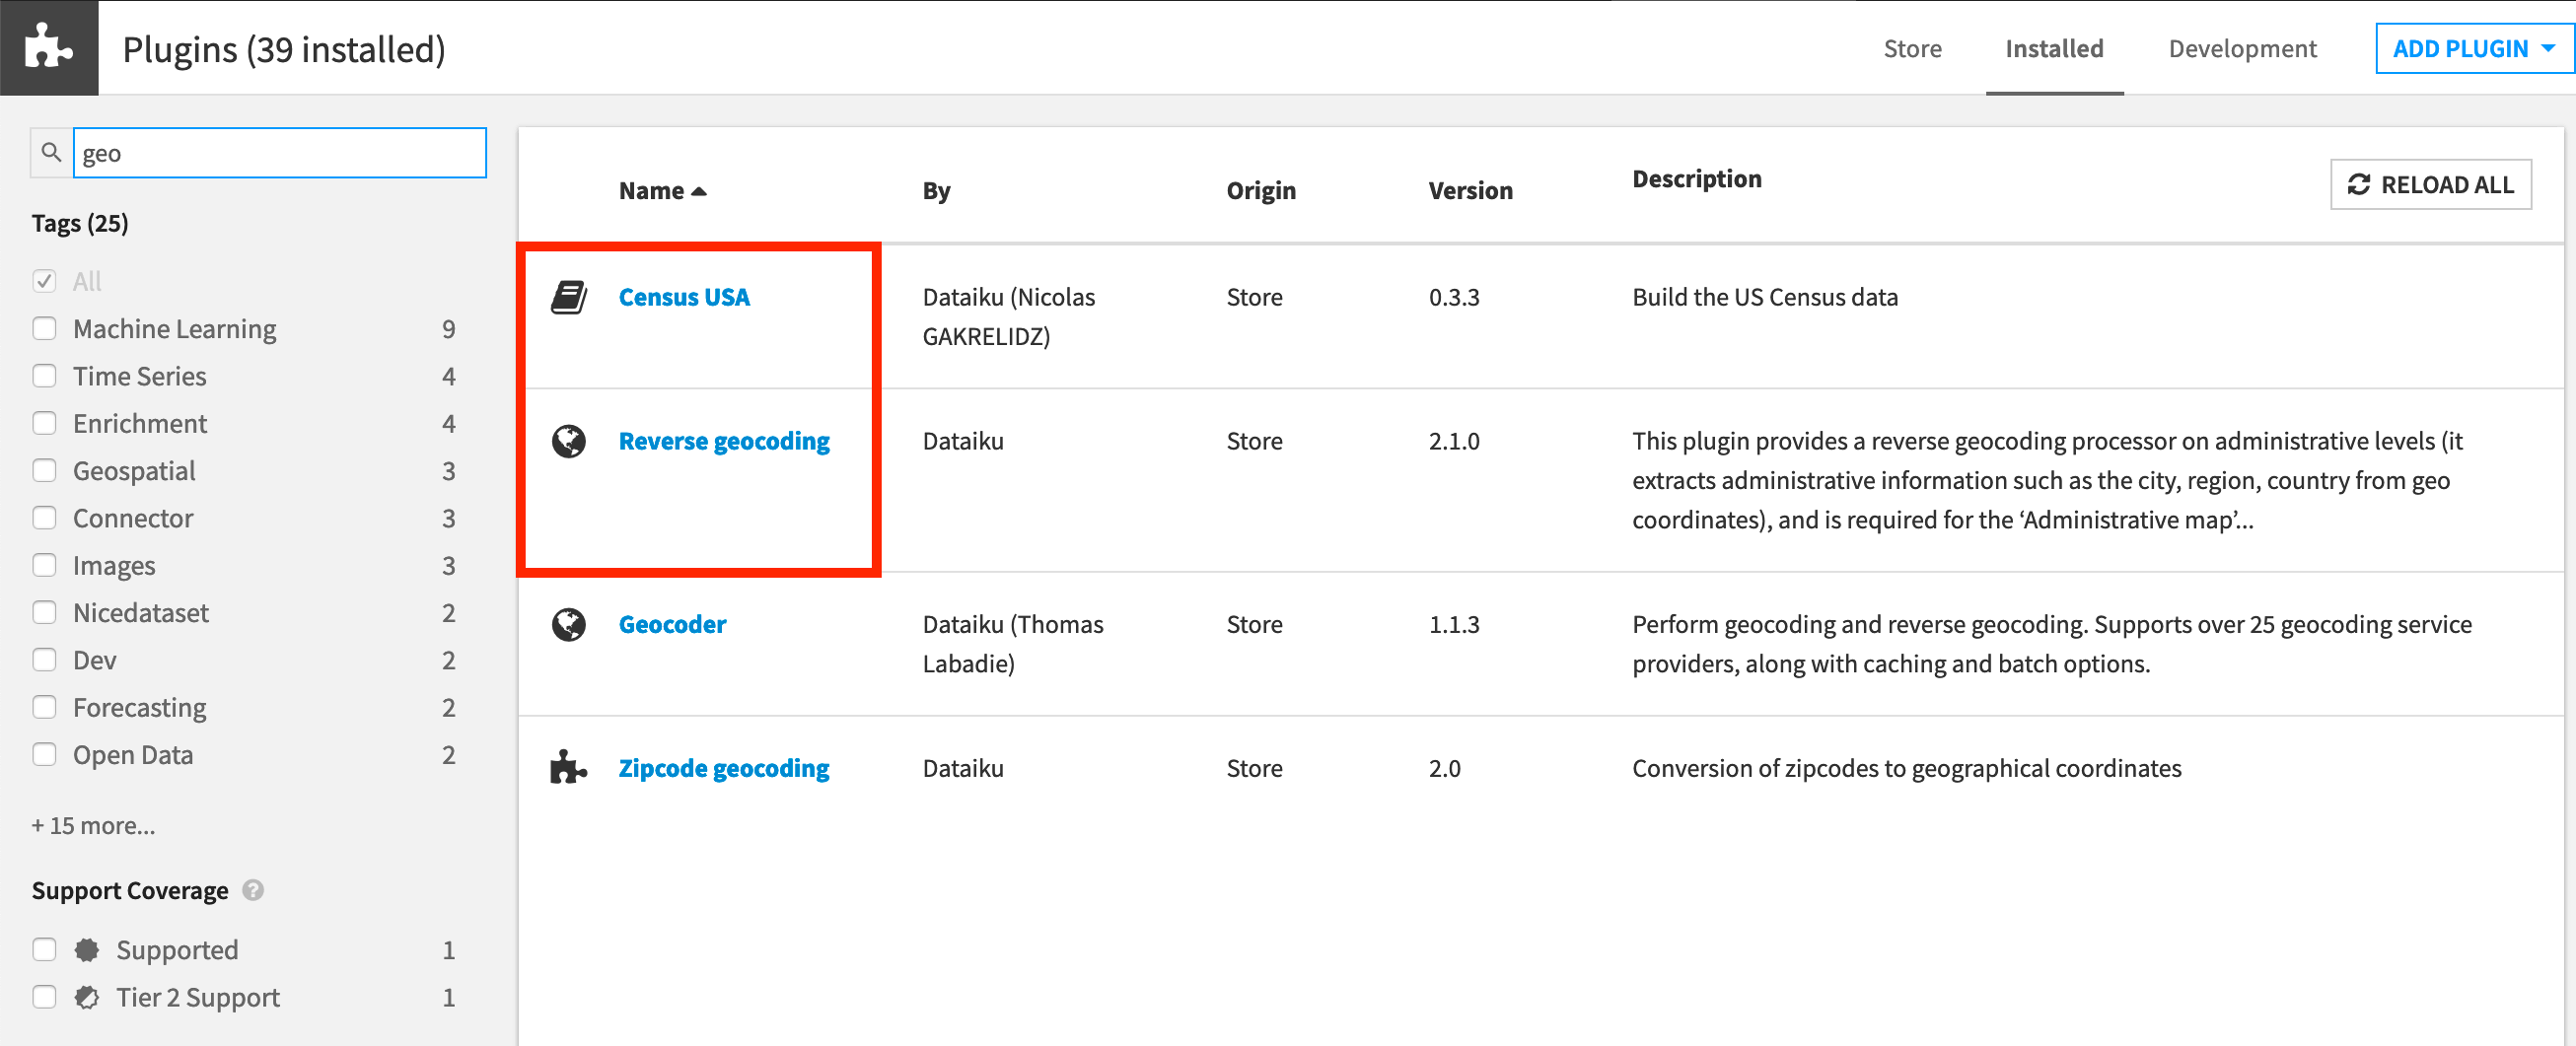
Census USA (minimum version 0.3)
These plugins are available through the Dataiku Plugin store, and you can find the instructions for installing plugins in the reference documentation. To check whether the plugins are already installed on your instance, go to the Installed tab in the Plugin Store to see a list of all installed plugins.
Plugin Installation for Dataiku Online Users
Tip
Users of Dataiku Online should note that while plugin installation is not directly available, you can still explore available plugins from your launchpad:
From your instance launchpad, open the Features panel on the left hand side.
Click Add a Feature and choose “US Census” from the Extensions menu. (“Reverse geocoding” is already available by default).
You can see what plugins are already installed by searching for “installed plugins” in the DSS search bar.
Create Your Project
Click +New Project > DSS Tutorials > Advanced Designer > Flow Views & Automation (Tutorial).
Warning
If creating a new project, be sure to use the Flow Views & Automation rather than Flow Views & Actions.
Note
If you’ve already completed one of the Plugin Store tutorial, you can use the same project.
Note
You can also download the starter project from this website and import it as a zip file.
Change Dataset Connections (Optional)
Aside from the input datasets, all of the others are empty managed filesystem datasets.
You are welcome to leave the storage connection of these datasets in place, but you can also use another storage system depending on the infrastructure available to you.
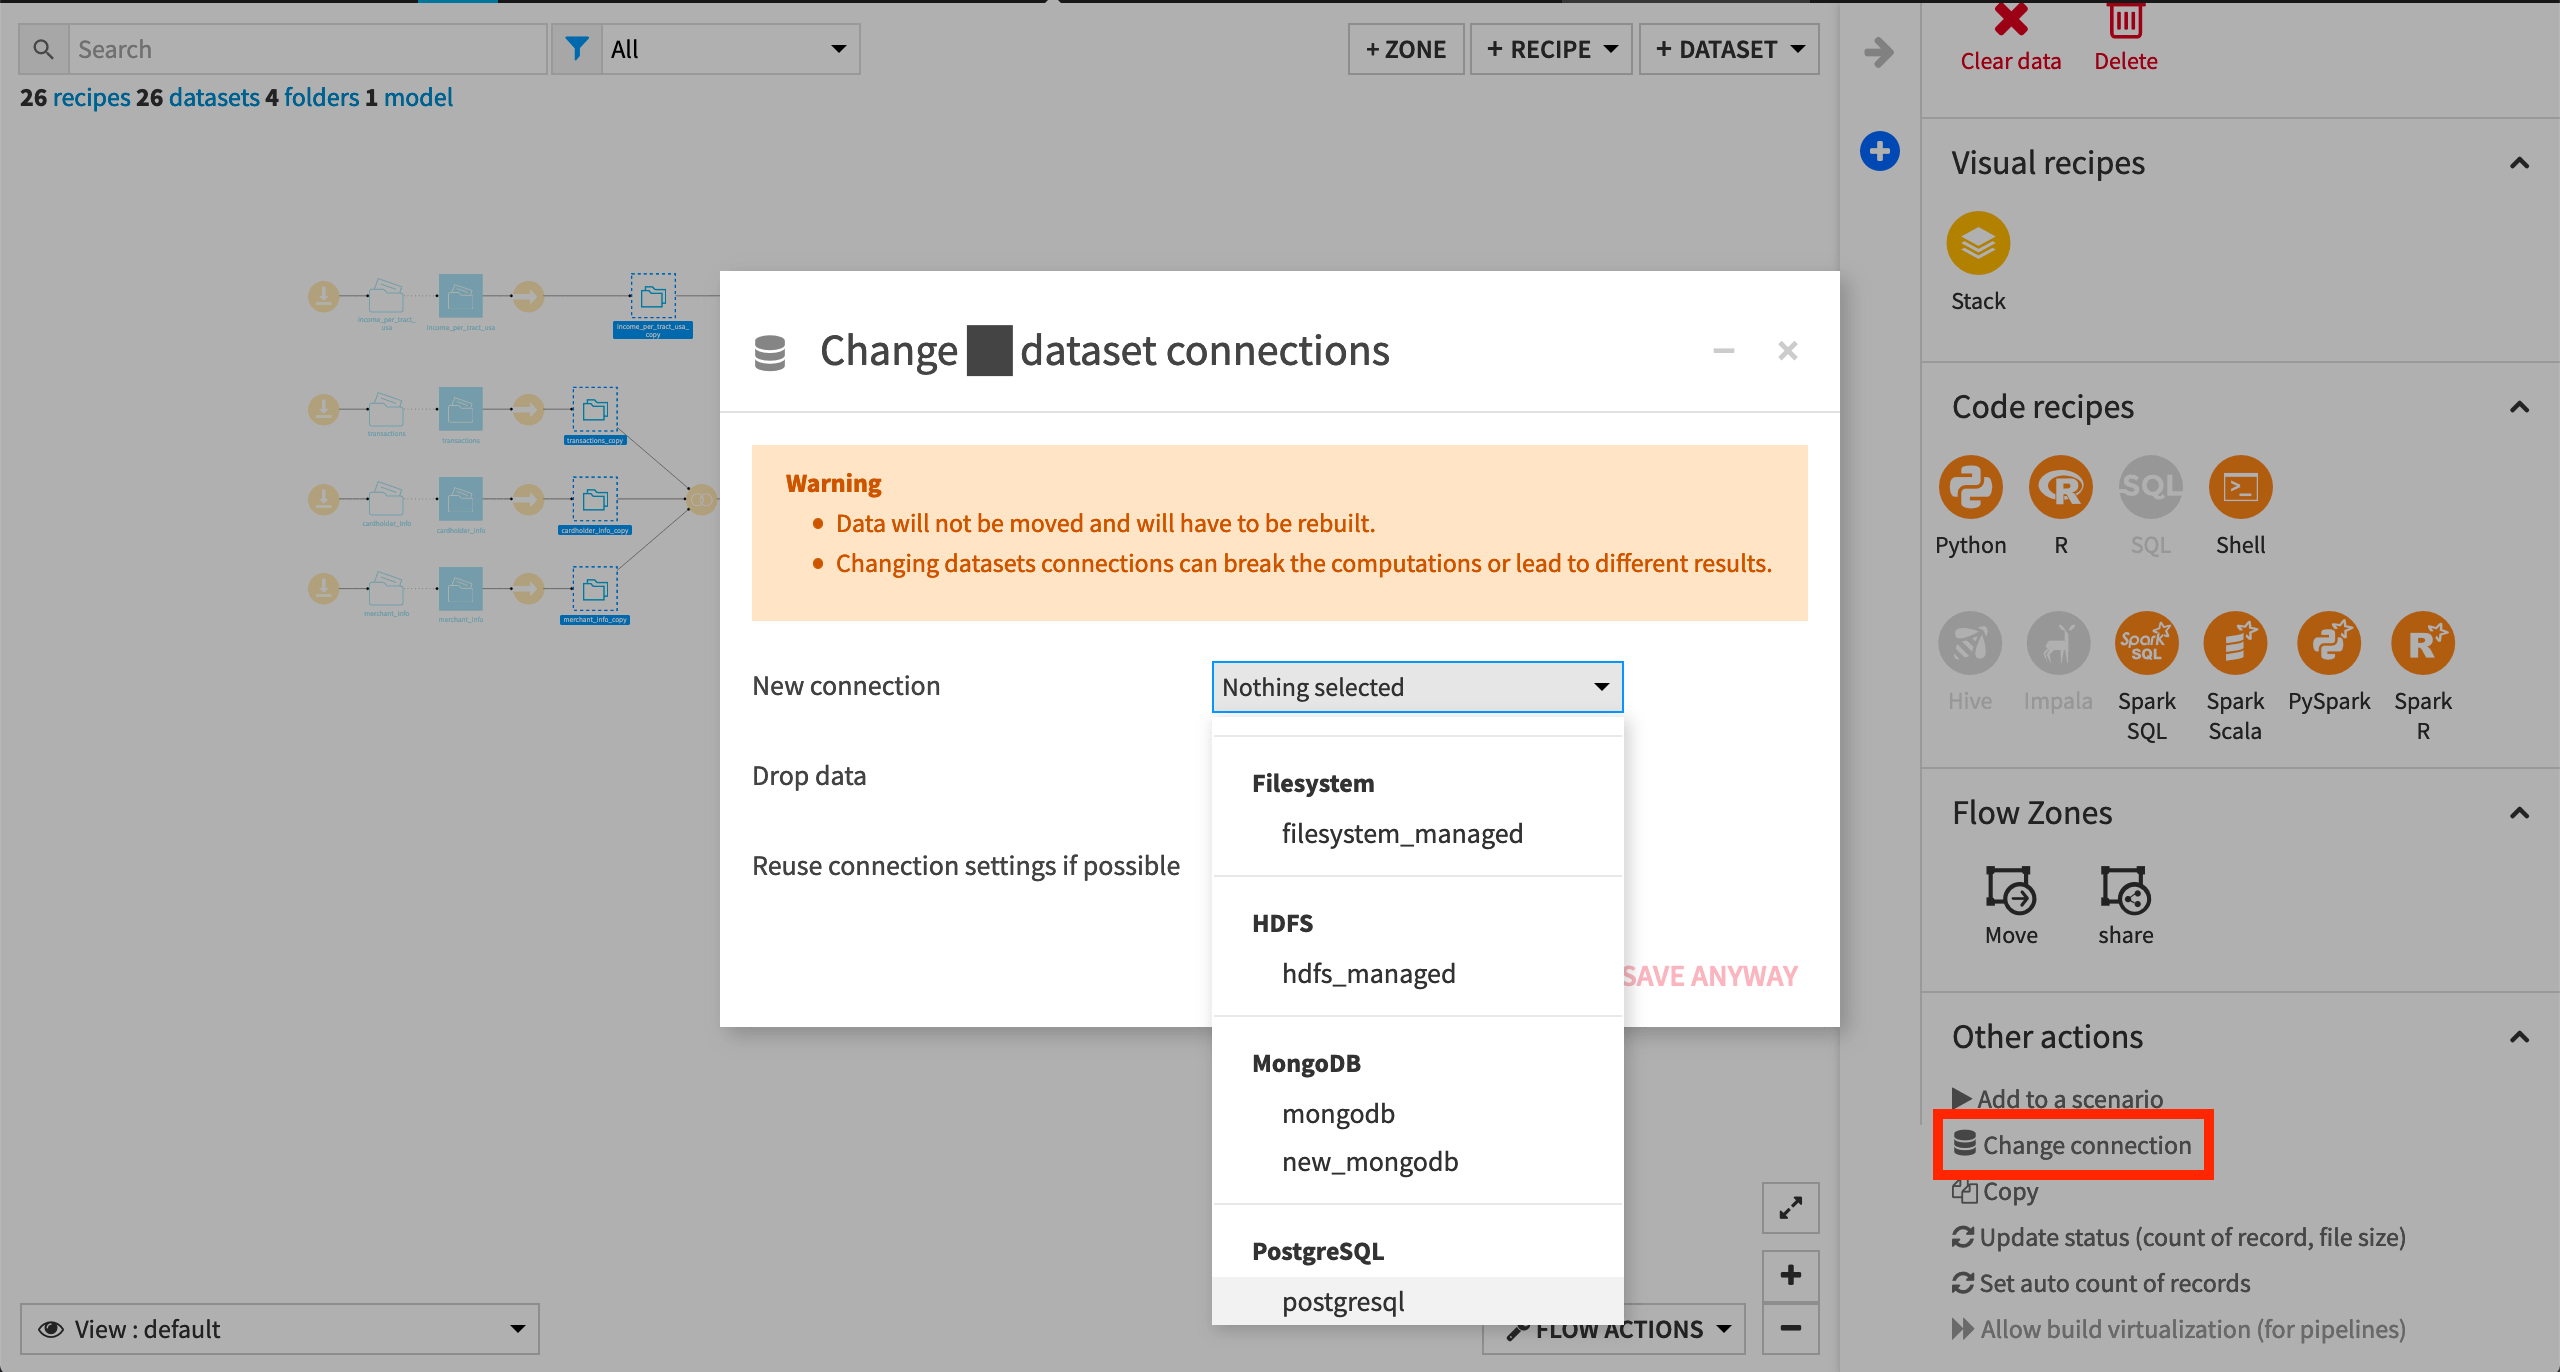
To use another connection, such as a SQL database, follow these steps:
Select the empty datasets from the Flow. (On a Mac, hold Shift to select multiple datasets).
Click Change connection in the “Other actions” section of the Actions sidebar.
Use the dropdown menu to select the new connection.
Click Save.
Note
For a dataset that is already built, changing to a new connection clears the dataset so that it would need to be rebuilt.
Note
Another way to select datasets is from the Datasets page (G+D). There are also programmatic ways of doing operations like this that you’ll learn about in the Developer learning path.
The screenshots below demonstrate using a PostgreSQL database.
Whether starting from an existing or fresh project, ensure that the datasets merchants_census_tracts_joined and transactions_unknown_scored are built.
See Build Details Here if Necessary
From the Flow, select the end datasets required for this tutorial: merchants_census_tracts_joined and transactions_unknown_scored
Choose Build from the Actions sidebar.
Leave the setting “Build required dependencies” in place.
Click Build to start the job, or click Preview to view the suggested job.
In the Jobs tab, you can see all the activities that Dataiku will perform.
Click Run, and observe how Dataiku progresses through the list of activities.
Note
When the datasets are built, note that the project has a variable state_name defined as “Delaware” (see the Variables tab of the More Options menu). This variable gets used in the Group recipe that creates the transactions_by_merchant_id dataset. Accordingly, the only value for merchant_state in the merchants_census_tracts_joined dataset is “Delaware”. We’ll see how to change this with a scenario later.
Standard Metrics
A key dataset in the Flow is transactions_joined_prepared. Let’s establish some metrics and checks for this dataset in order to monitor its status.
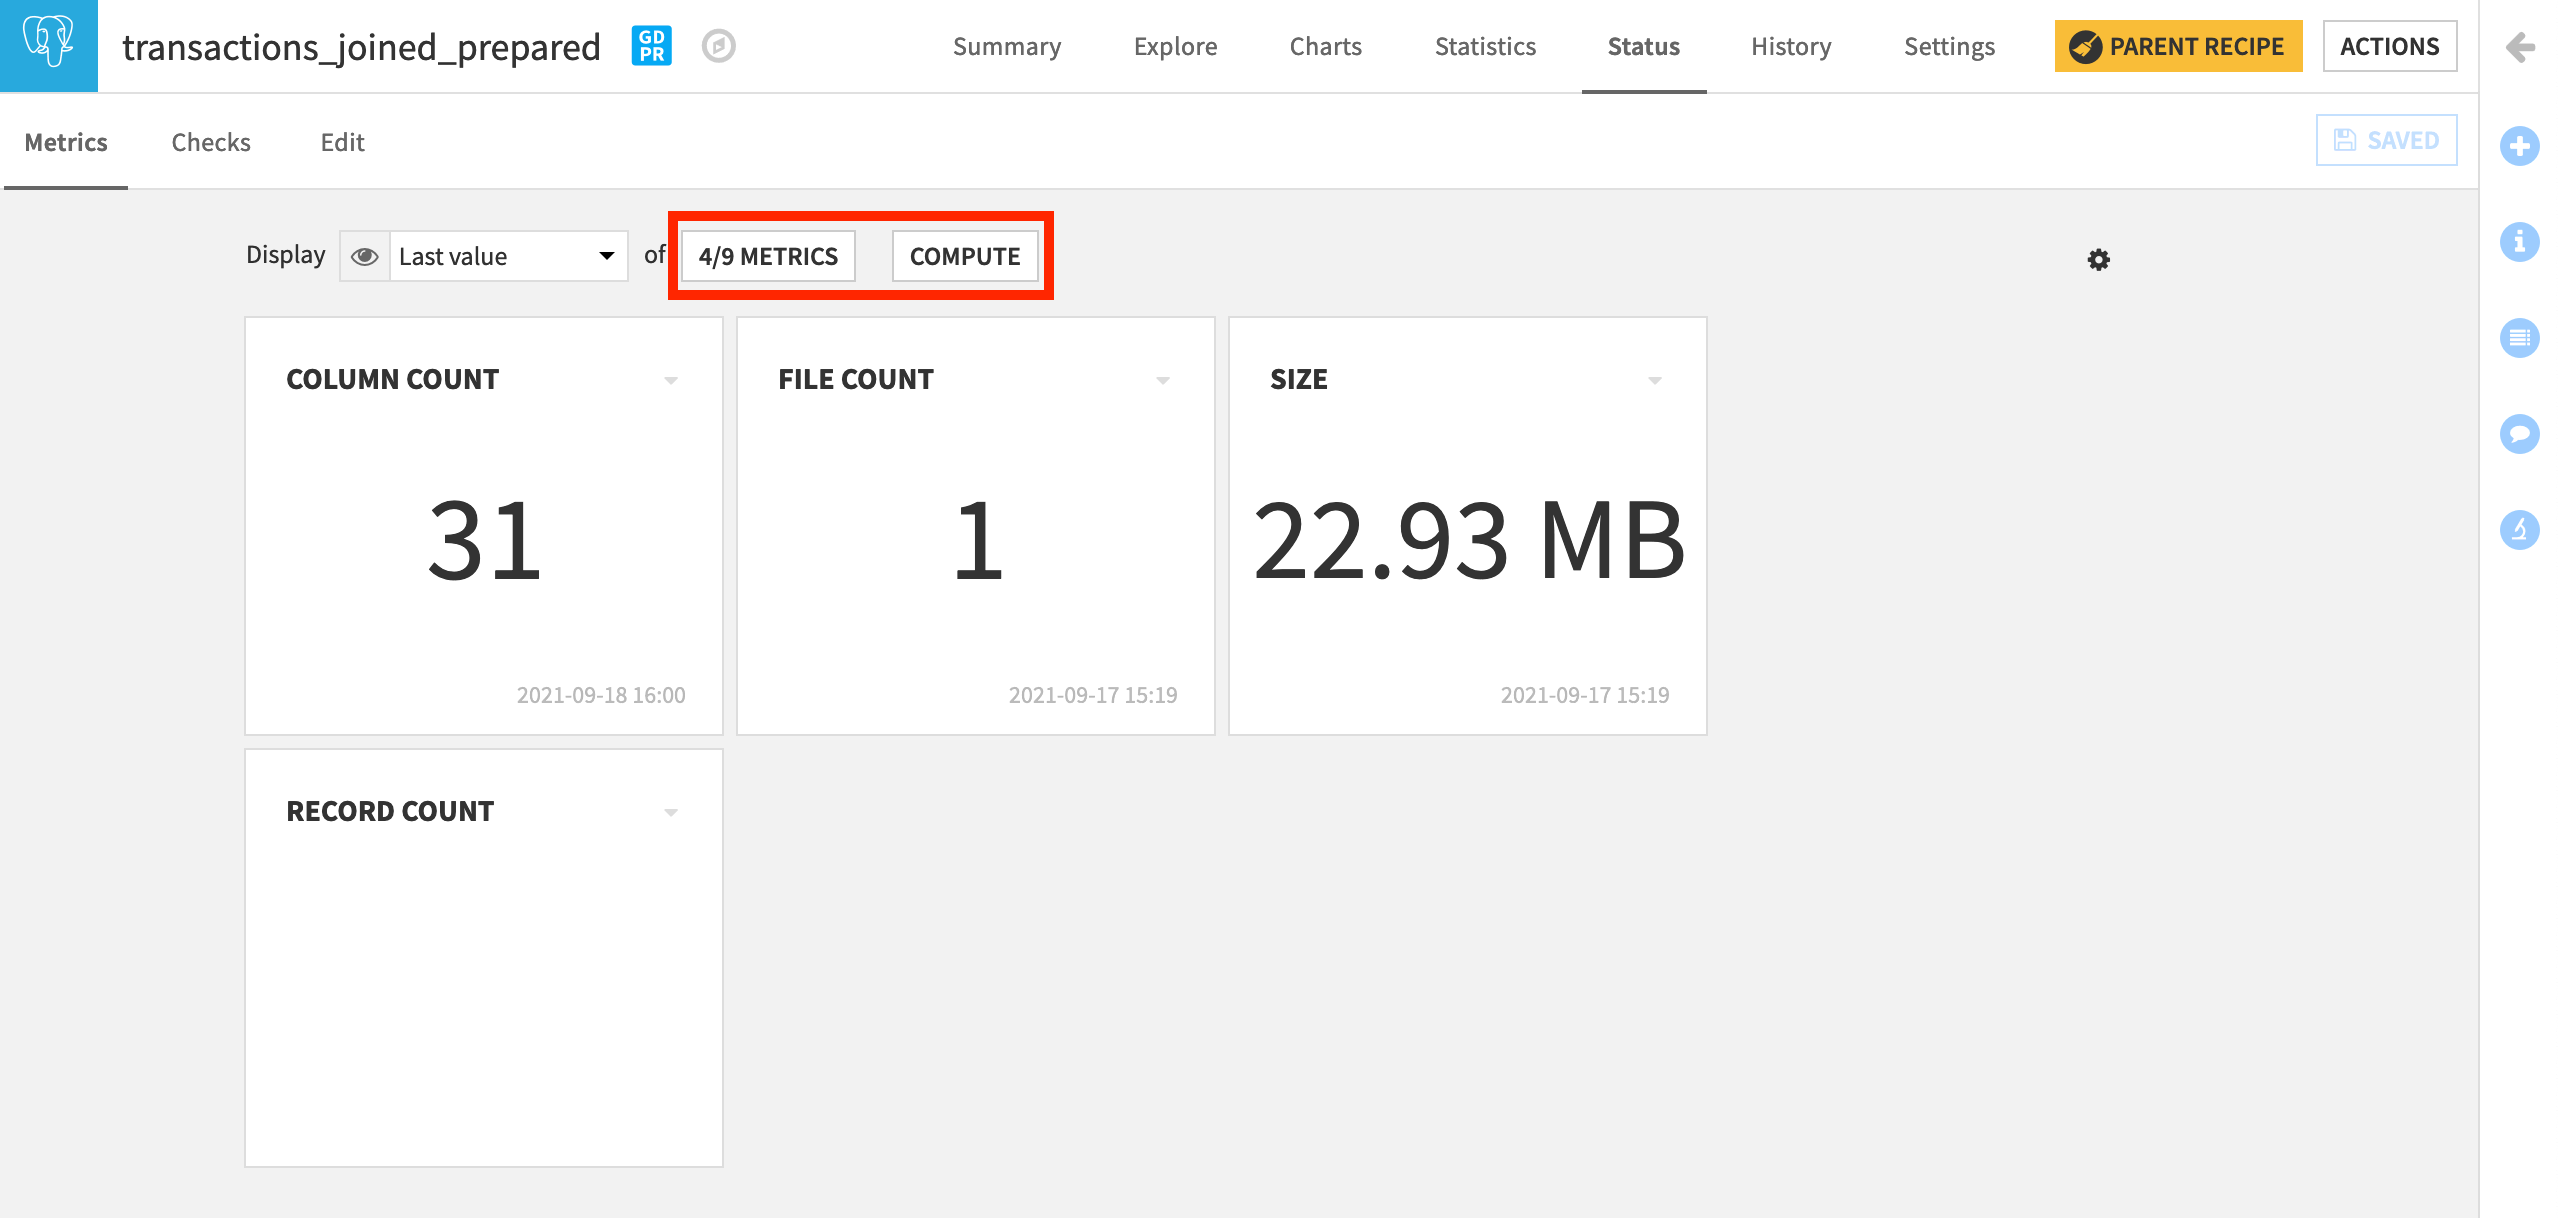
On the Status tab of every dataset in Dataiku DSS, we find a few standard metrics ready to be computed, such as the most recent build date and the column count.
Open transactions_joined_prepared, and navigate to the Status tab.
On the Metrics subtab, we can control which metrics to display and in what format.
Click Compute to calculate all of the displayed metrics if not already done so.
Create Your Own Metrics
Now let’s take further control of our metrics.
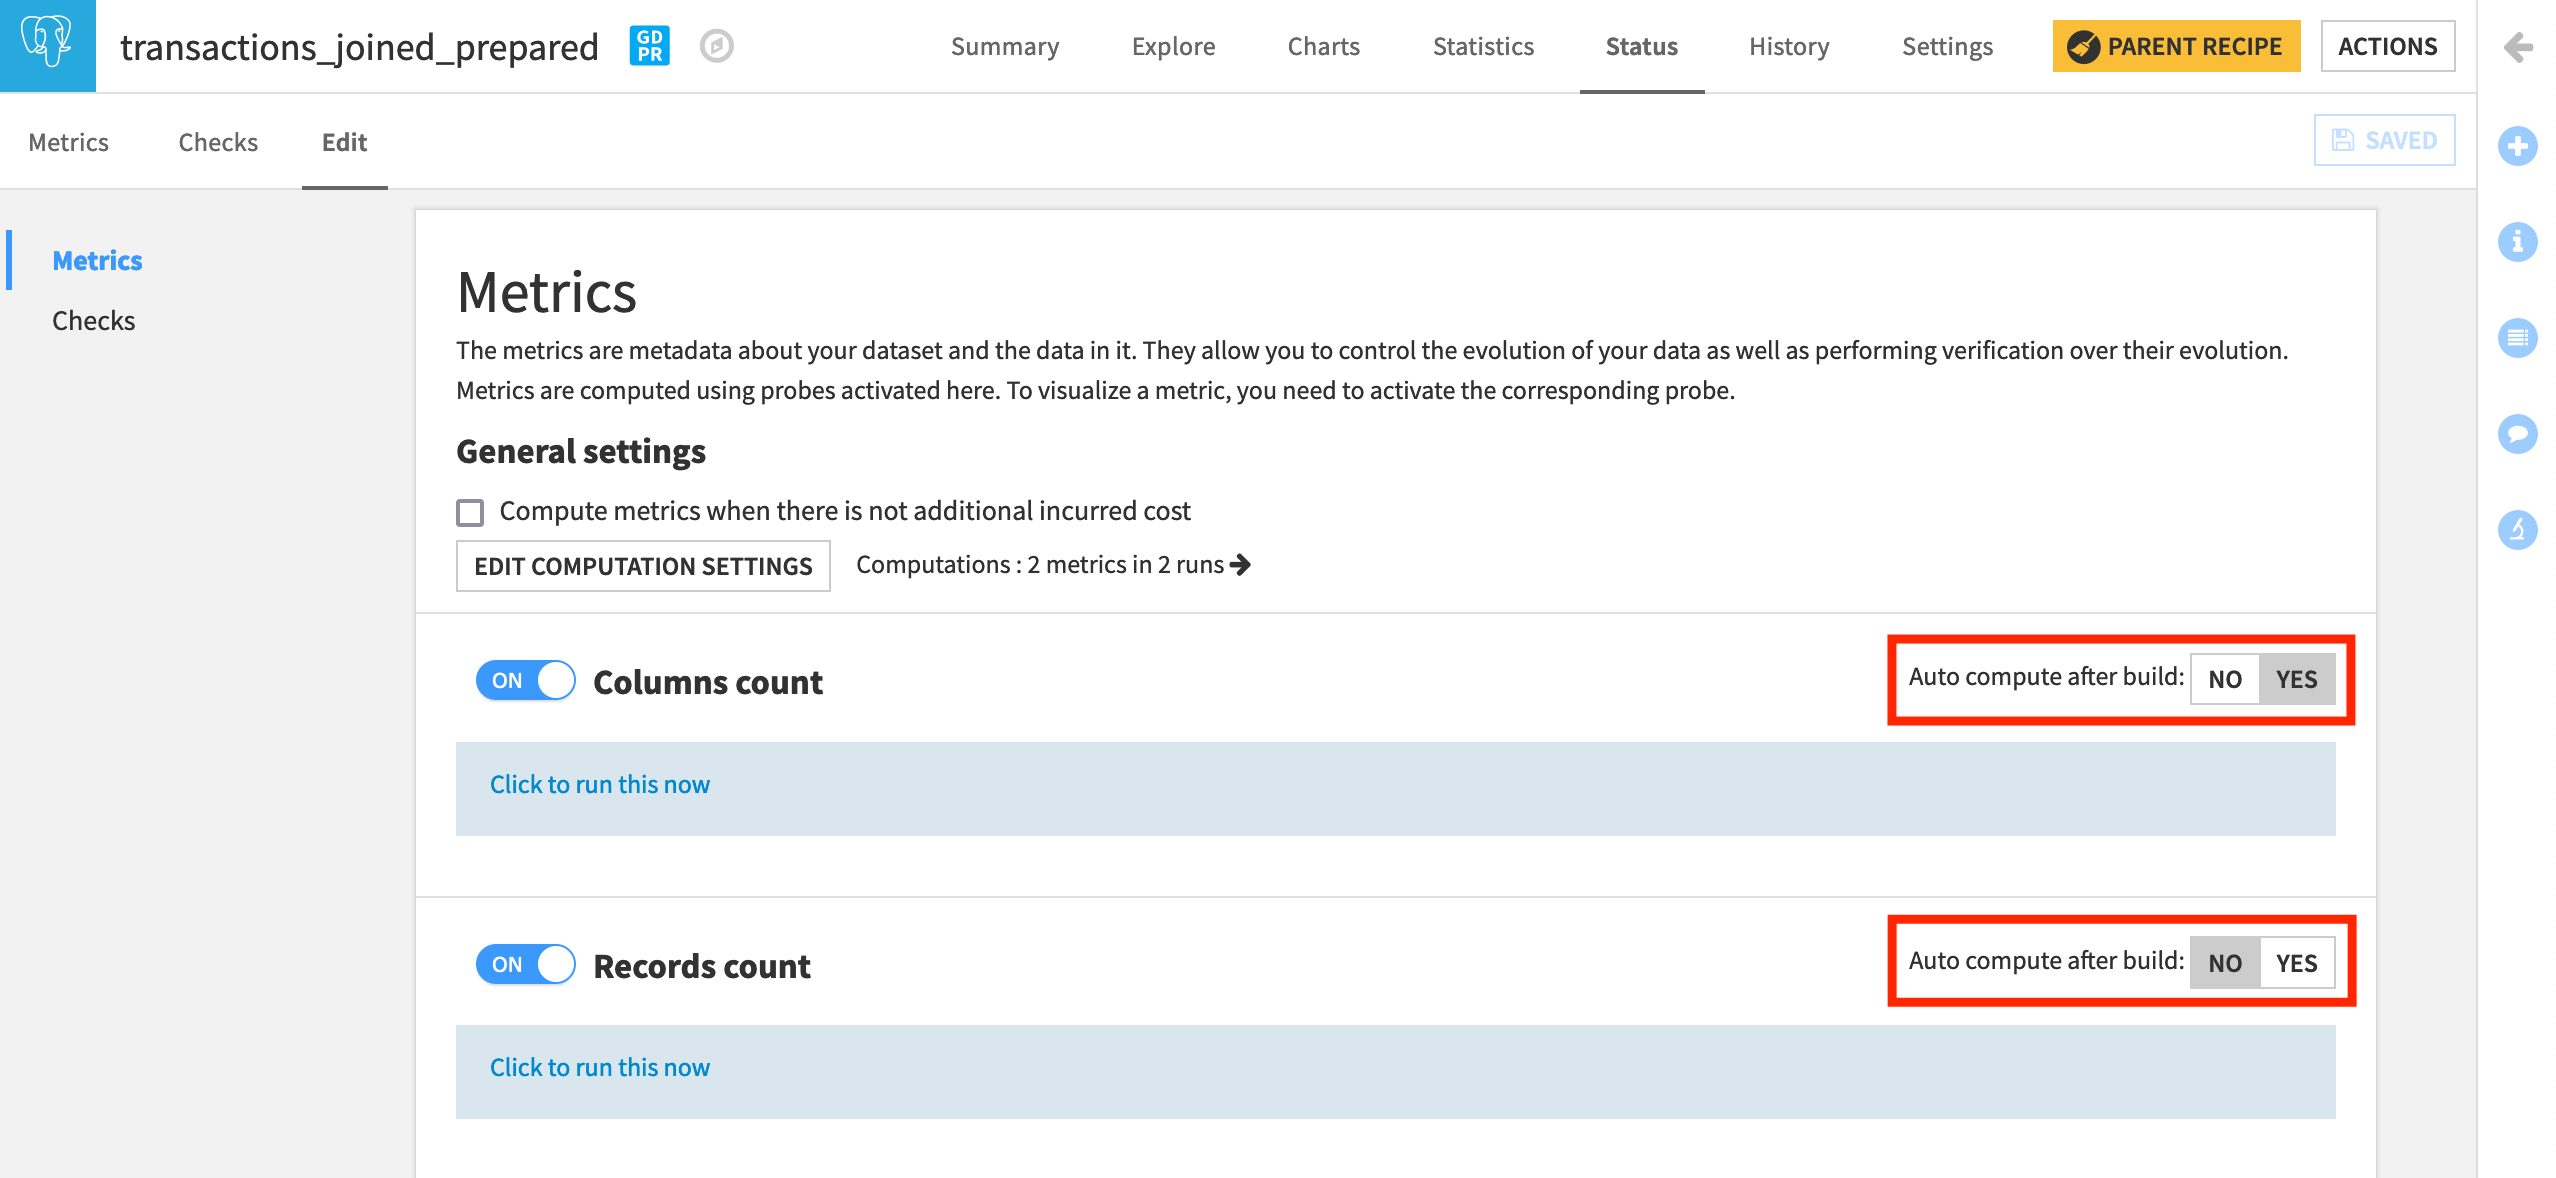
Navigate to the Edit subtab.
We can see that both “Column count” and “Record count” are switched ON. Only “Column count”, however, in this particular case, is set to auto-compute after build.
Now, let’s create a new metric from the available built-in options.
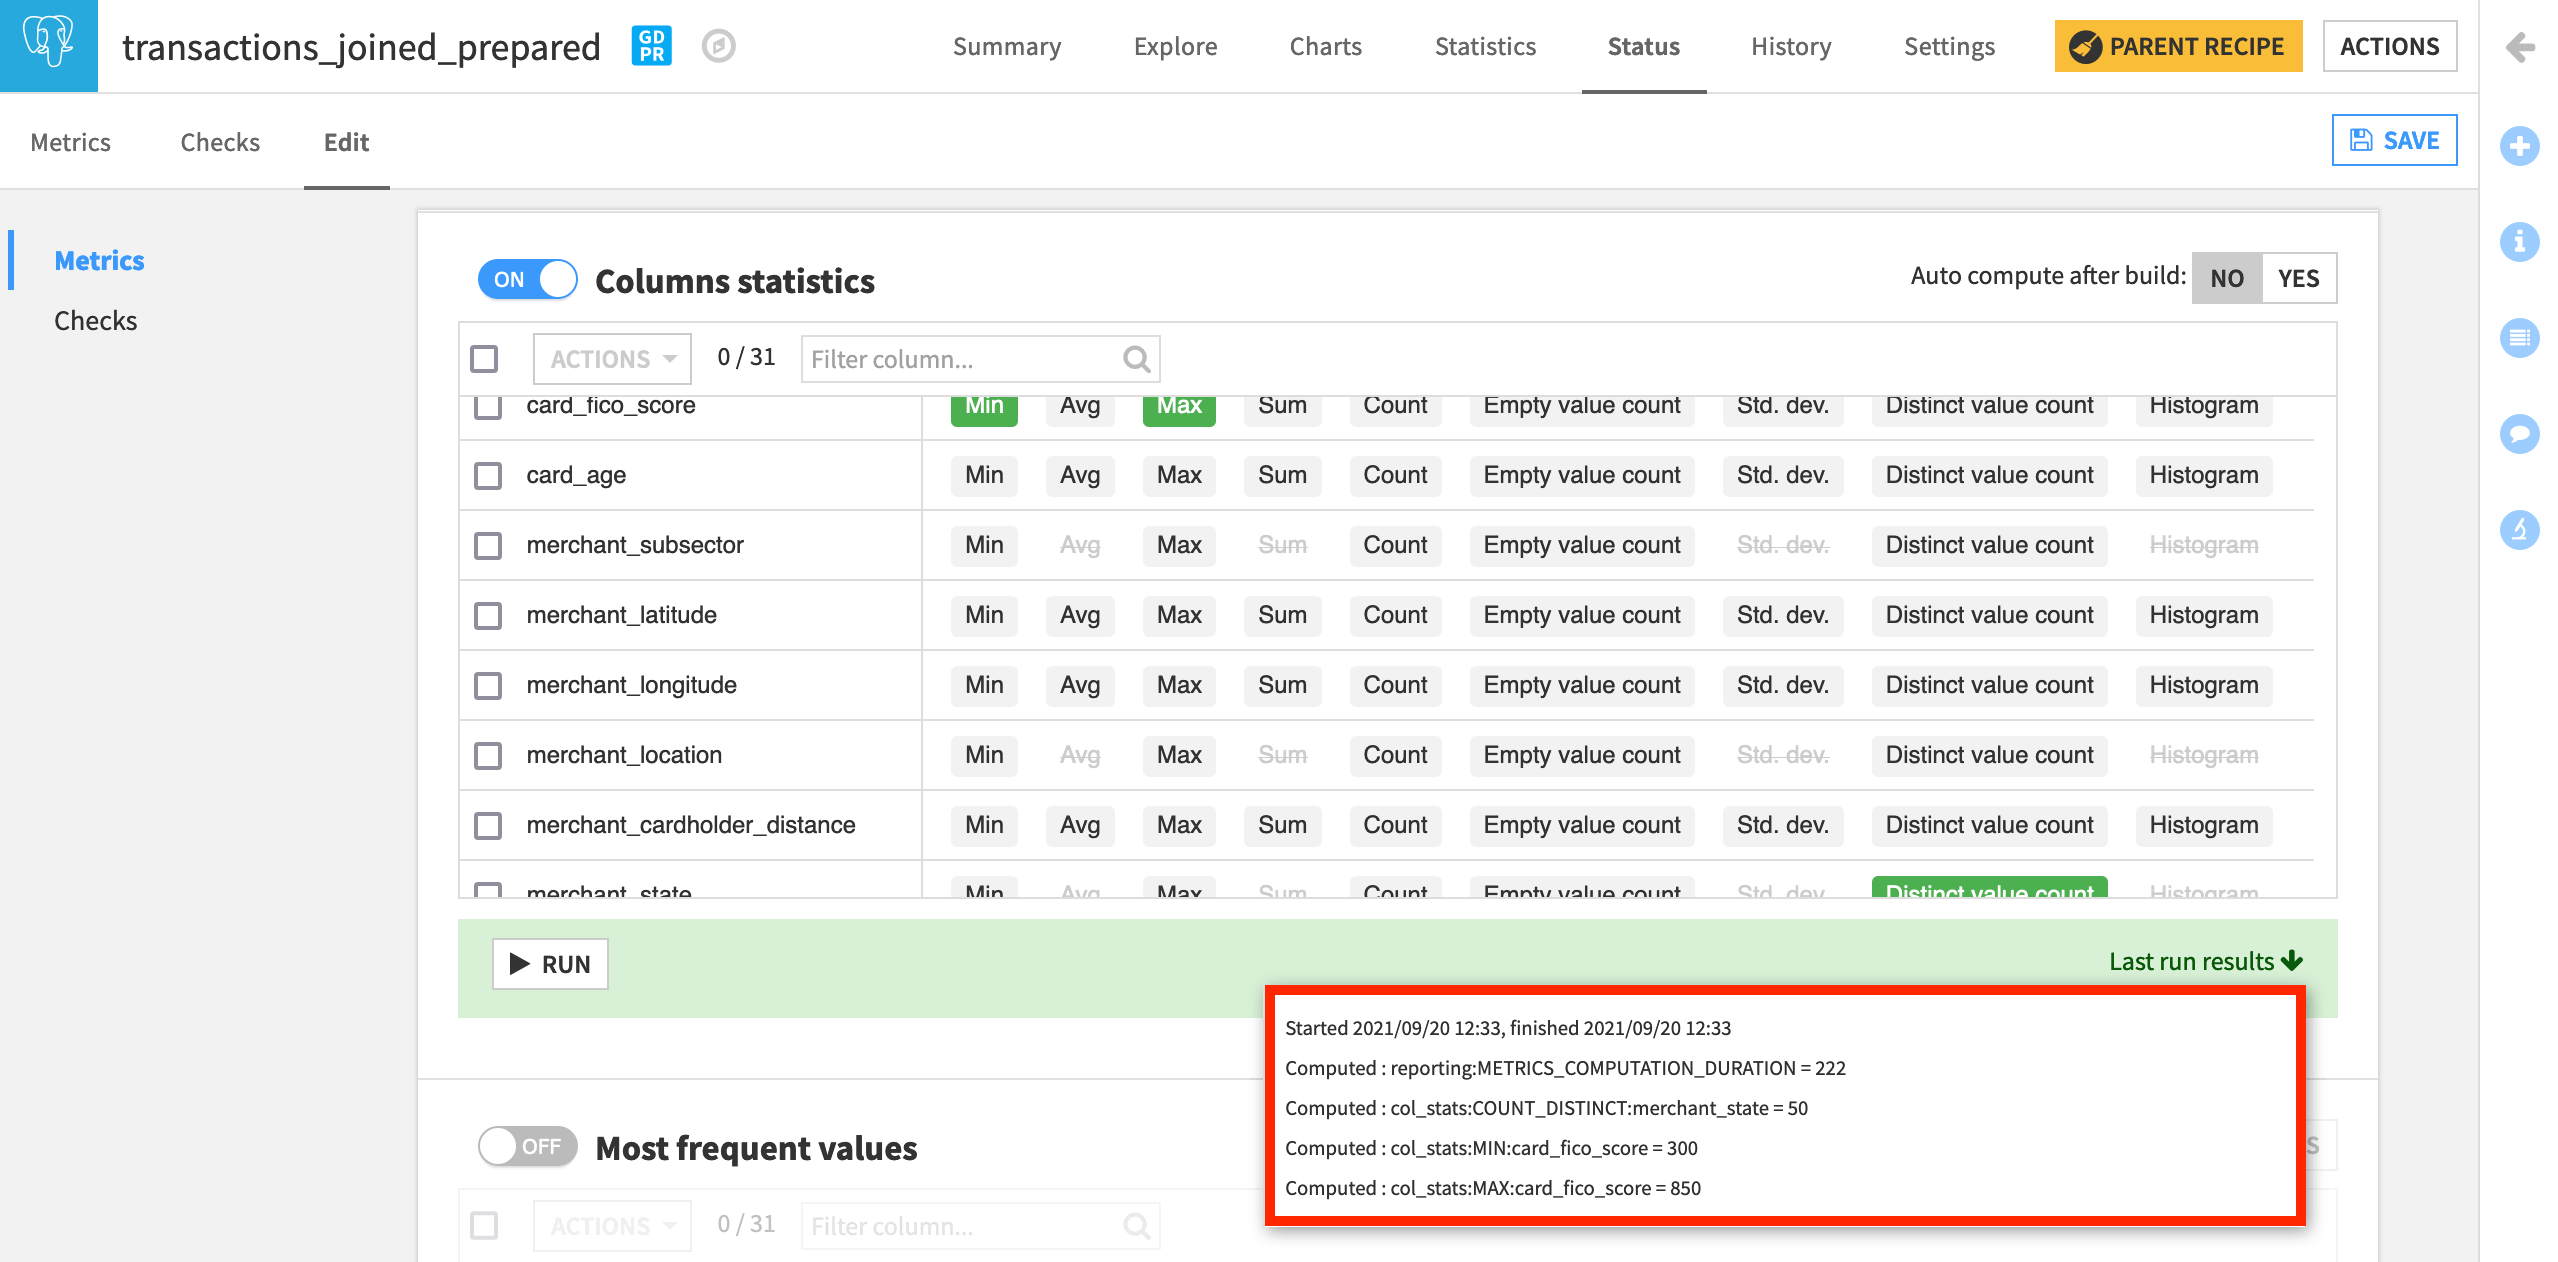
Turn on the Column statistics section. Here we can create metrics out of basic statistics like the minimum, maximum, or count of any column in the dataset.
By definition, FICO scores, a US system of scoring credit worthiness, range from 300 to 850.
With this range in mind, let’s track the Min and Max of card_fico_score.
Also, select the Distinct value count of merchant_state.
From this screen, run the probe to compute the three requested metrics.
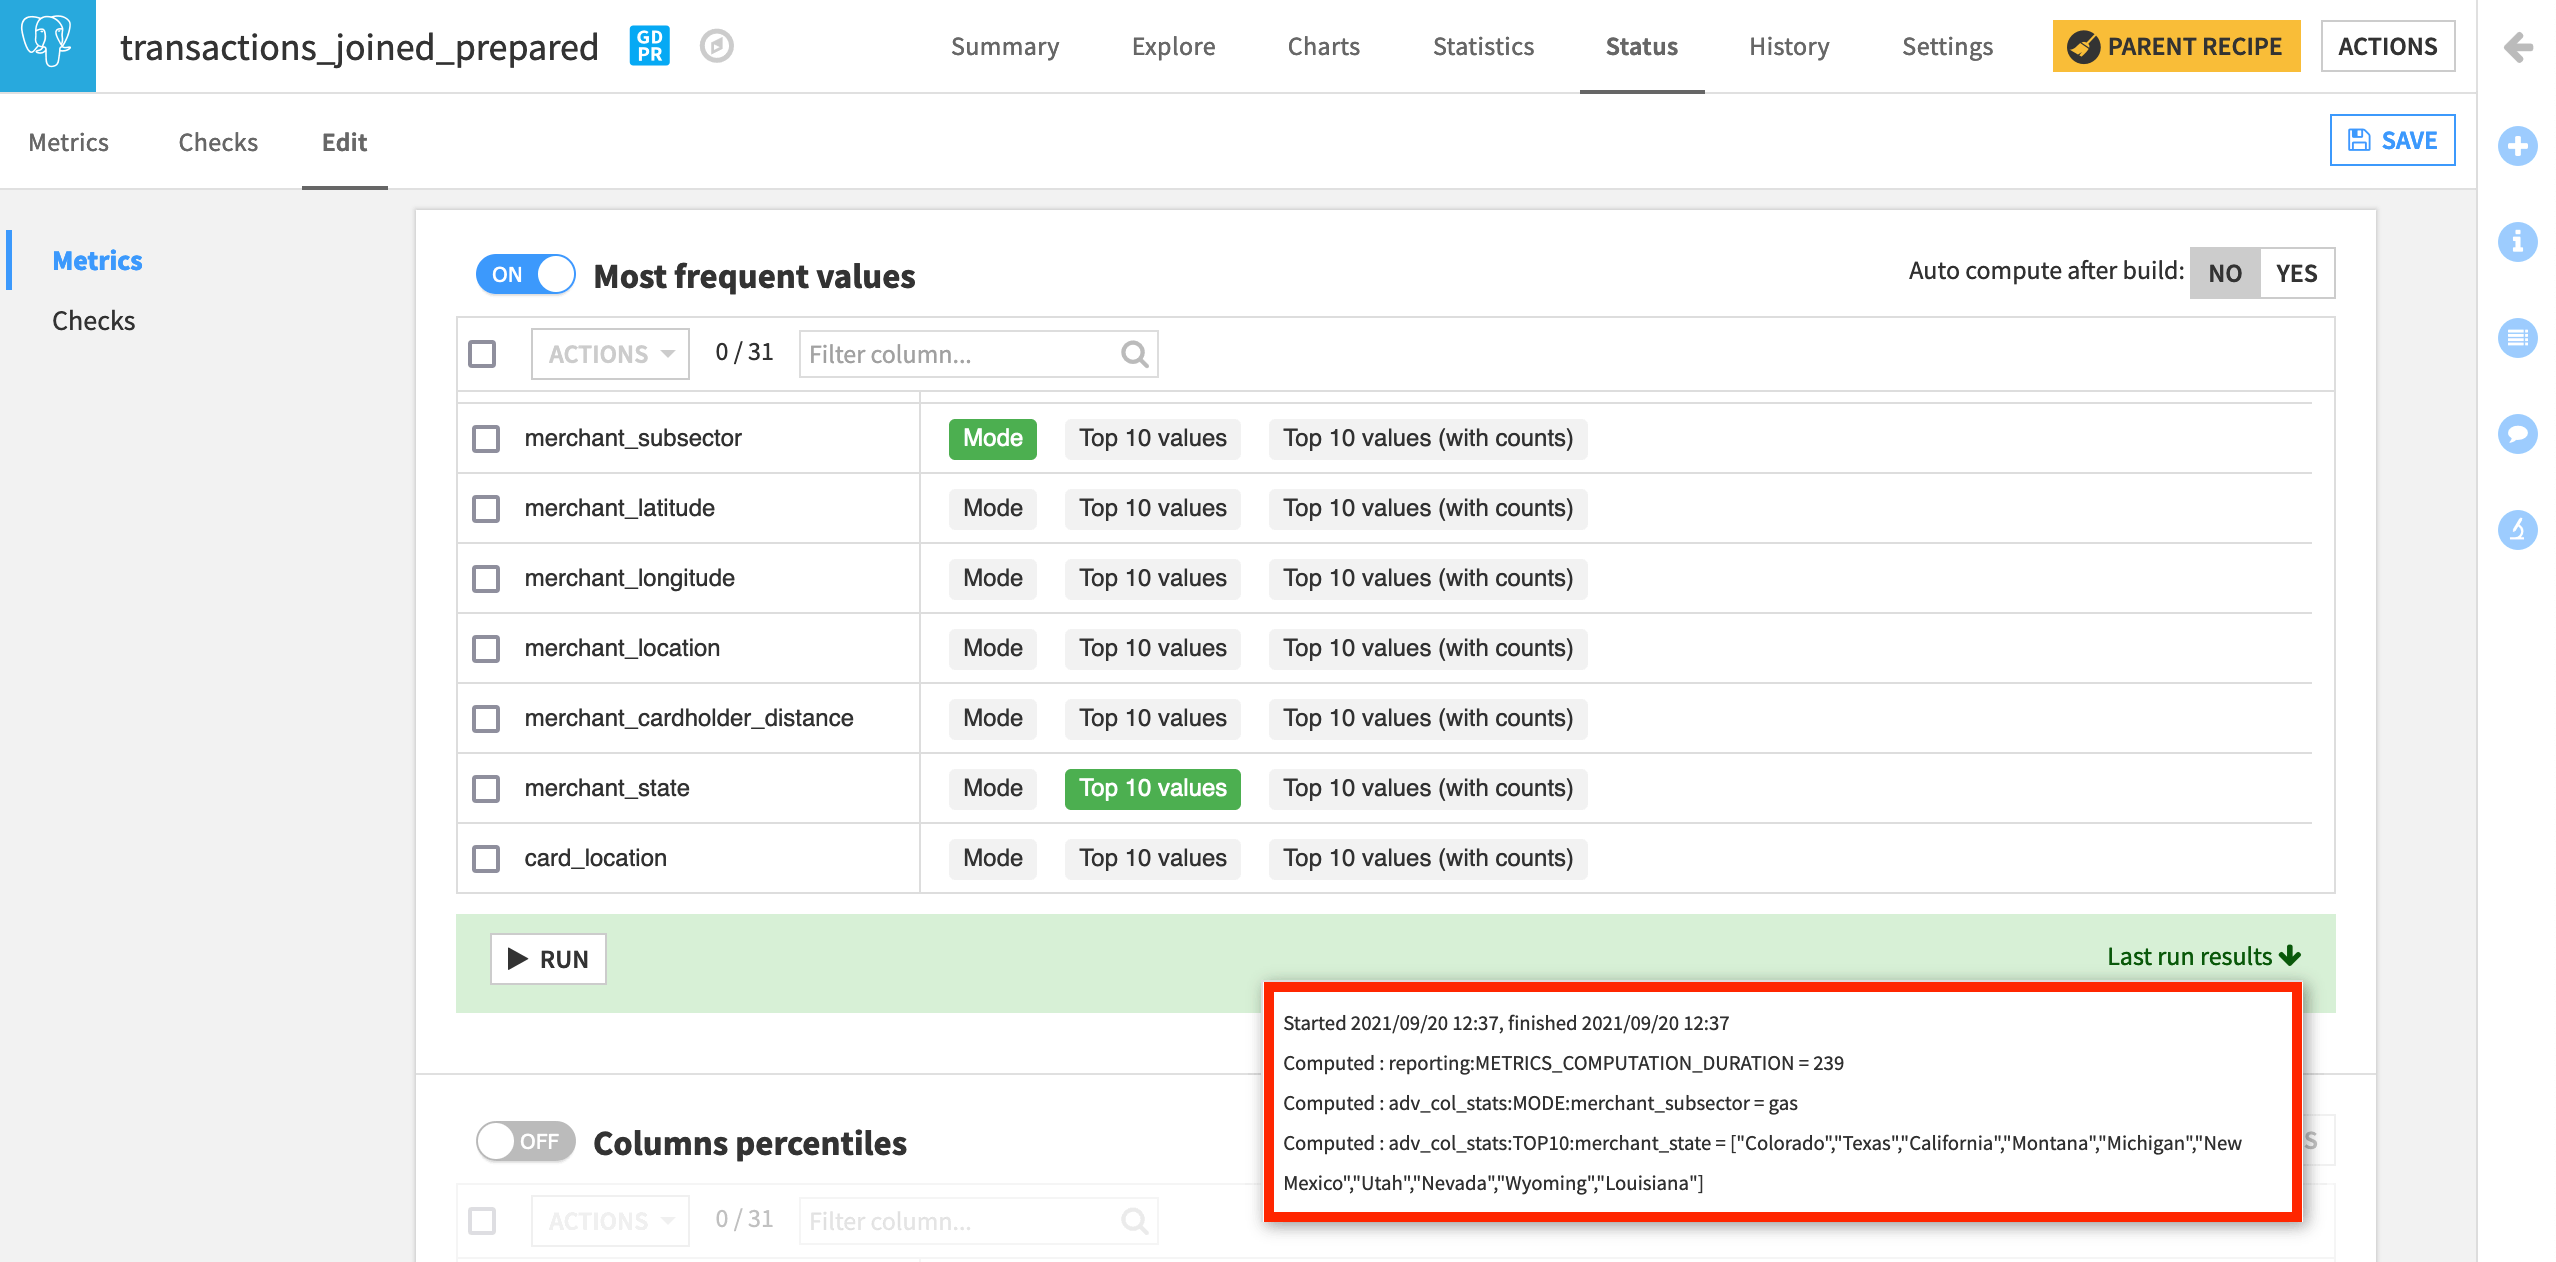
The next section of metrics allows us to compute the most frequent values of a column.
Turn on the section Most frequent values.
Select the Mode of merchant_subsector and the Top 10 values of merchant_state.
Click to run this probe as well and see the last run results.
Note
In addition to these kinds of built-in metrics, we can also define custom metrics with Python, SQL, or plugins. We’ll explore these in another lesson.
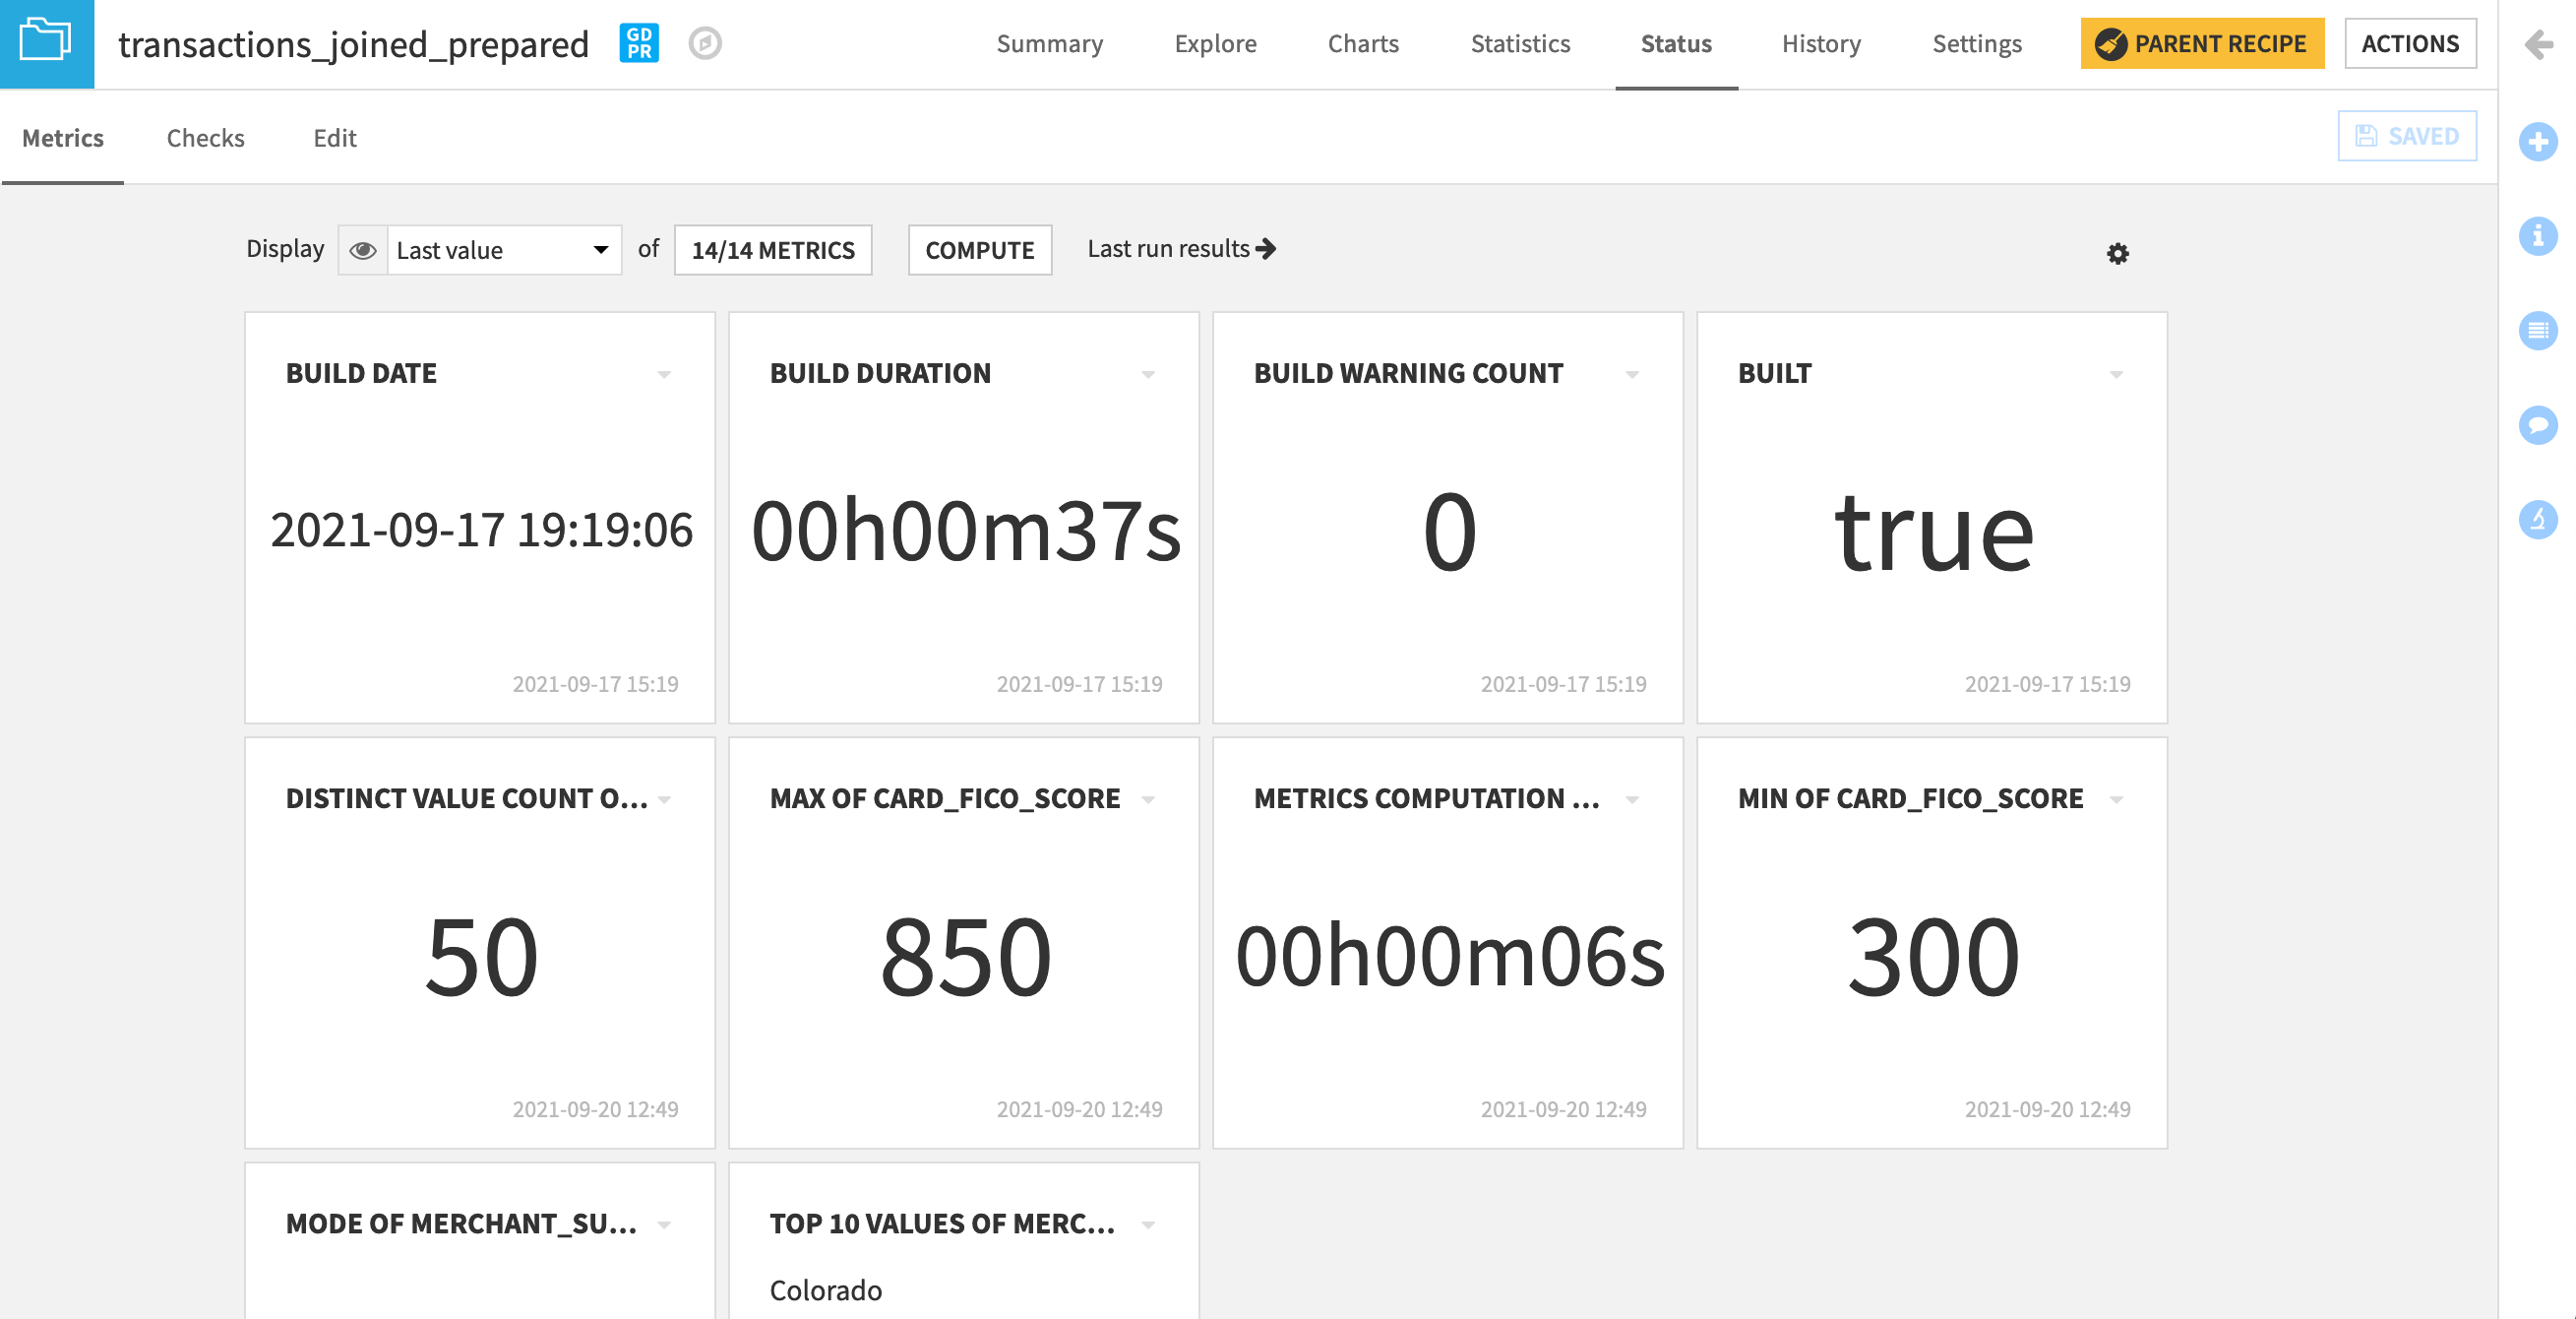
When returning to the Metrics subtab, we find our newly-created metrics as options available to be displayed.
Click on the button showing the number of metrics currently displayed, and Add all.
Click Compute to calculate the metrics if not already done so.
Experiment with different views by changing the Display from “Last value”, to “History”, to “Columns”.
Create Your Own Checks
Now let’s use these metrics to establish checks on the dataset.
Navigate to the Checks subtab.
None exist yet so create one in the Edit tab.
By definition, we know FICO scores range from 300 to 850. If a value is outside of this range, we will assume there must be some kind of data quality problem, and we want a failure notice.
Under “Add a new check”, select Metric value is in a numeric range.
Name it
FICO >= 300.Choose Min of card_fico_score as the metric.
Turn the Minimum ON, and set it to
300.Click Check to see how it will work. It should return “OK”, and the message 300. We could have found the same result in the Analyze tool.
Note
When we check if a metric is in a numeric range, we have the ability to define a hard or soft maximum or minimum, depending on whether we want to trigger an error or a warning.
A value less than the minimum or greater than the maximum value produces an error.
A value less than the soft minimum or greater than the soft maximum produces a warning.
Let’s test this out on the same check.
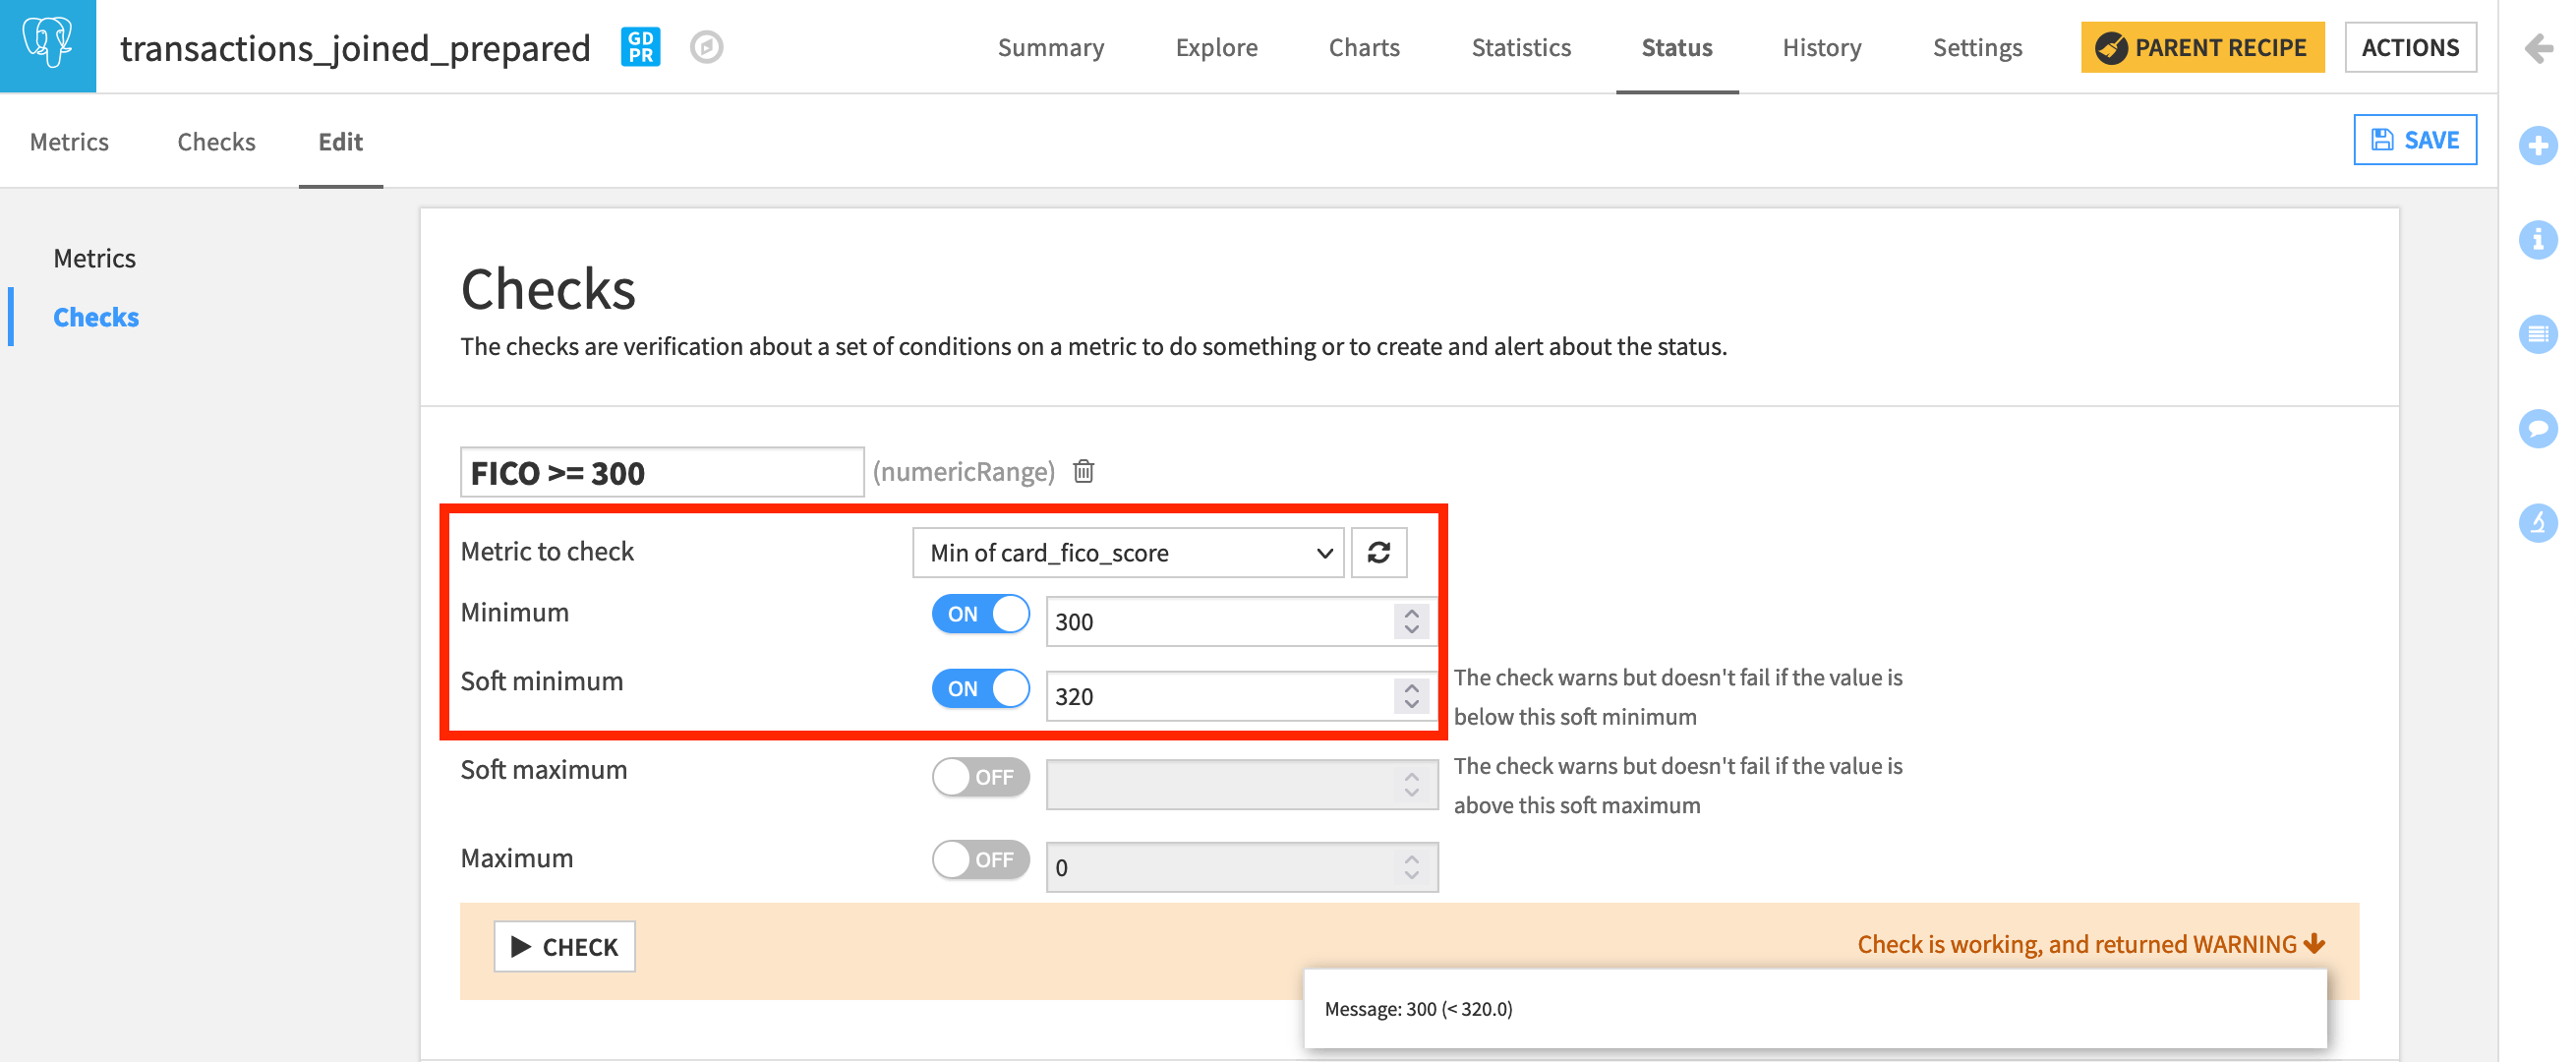
Change the minimum of the “FICO >= 300” check from 300 to
320and run the check. Instead of returning “OK”, it returns an error because we have values in the dataset less than 320.Reset the minimum to
300. Then turn on a soft minimum of320(a very risky credit score). Now the check returns “WARNING”.
We can follow a similar process to check the upper bound.
Under “Add a new check”, select Metric value is in a numeric range.
Name it
FICO <= 850.Choose Max of card_fico_score as the metric.
Set the Maximum to
850.Click Check to confirm it is working as intended.
Assuming that all of these transactions are from the United States, we know that there should not be more than 51 distinct values of merchant_state (including the District of Columbia as a state). We can create a check to monitor this.
Under “Add a new check”, select Metric value is in a numeric range.
Name it
Valid merchant_state.Choose Distinct value count of merchant_state as the metric.
Set the Maximum to
51.After running the check, it should return “OK”.
We can also check if a metric is within a set of categorical values. For example, our domain knowledge might create the expectation that the most frequent merchant_subsector should be “gas”. Let’s make this a check.
Under “Add a new check”, select Metric value is in a set of values.
Name it
'gas' is subsector mode.Choose Mode of merchant_subsector as the metric.
Add
gasas the value.After running the check, it should return “OK”.
After saving the new checks, navigate from the Edit to the Checks tab.
Display all of the newly-created Checks.
Click Compute.
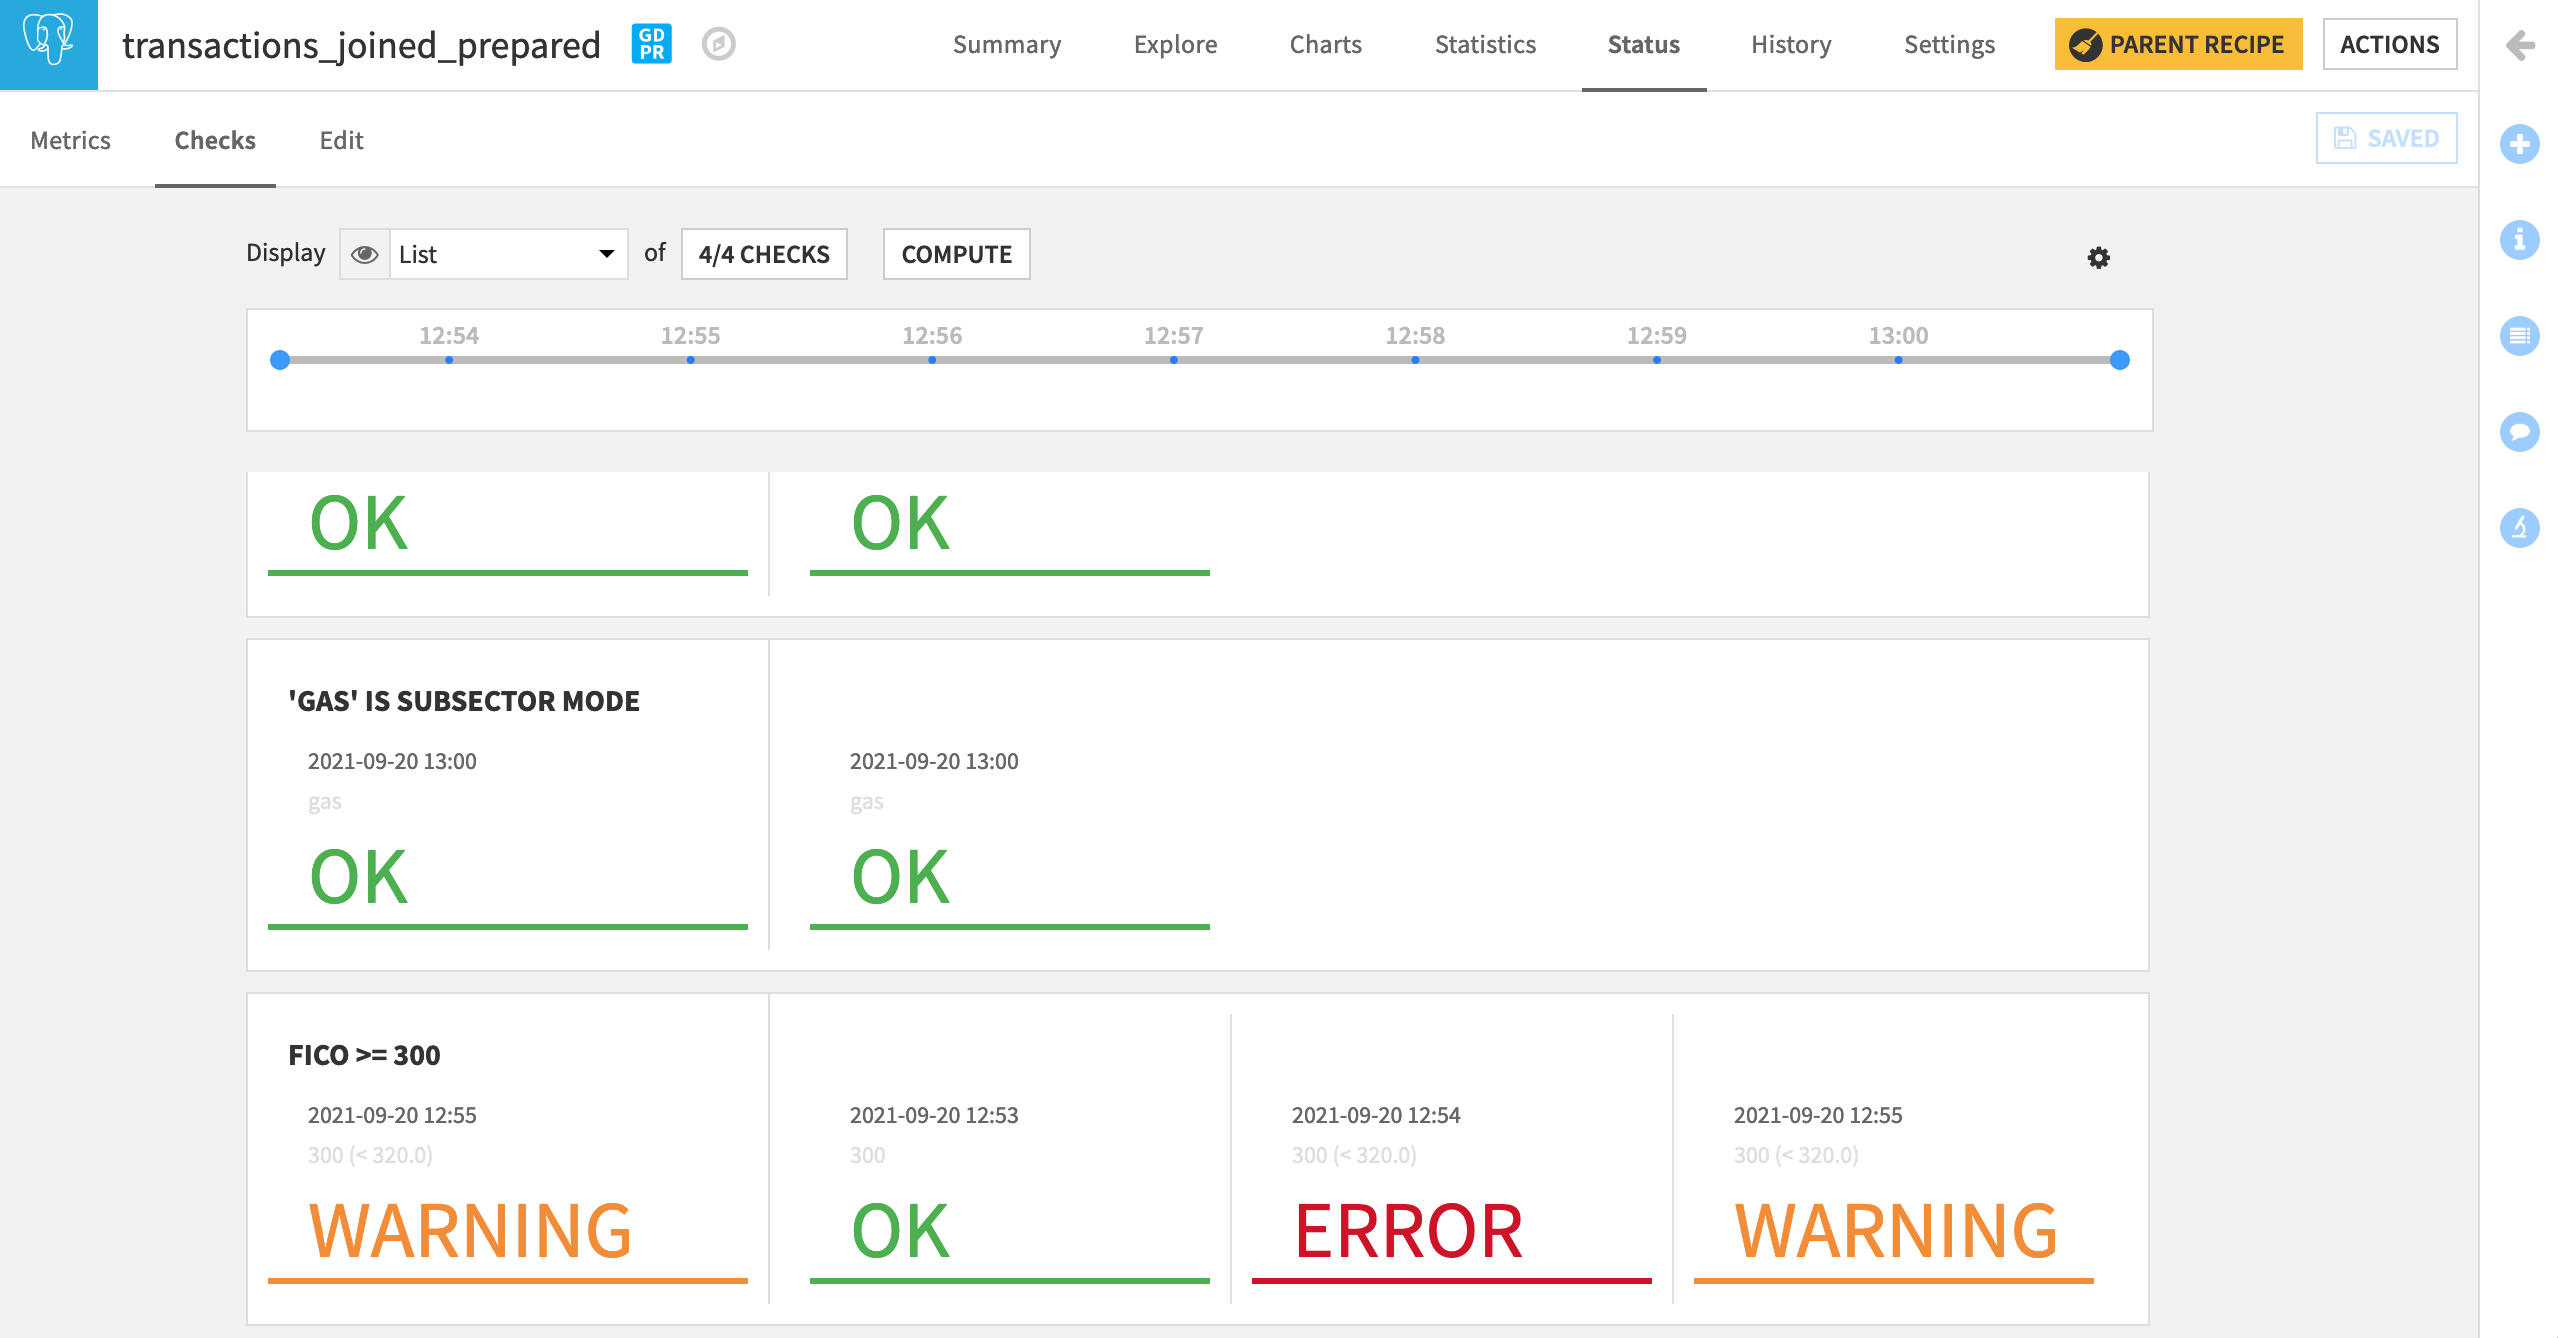
Note
We can also create custom checks with Python or plugins. We’ll see this in another lesson.
Model Metrics & Checks
Datasets are not the only Dataiku DSS object for which we can establish metrics and checks. Models are another object in need of close monitoring.
In the Flow, the green diamond represents the deployed model that predicts whether a credit card transaction will be authorized or not.
Select it, and Retrain it (non-recursively) from the Actions panel.
On opening the deployed model, we can see the active and previous versions. Note how the ROC AUC (or AUC), a common performance metric for classification models, is around 0.75.
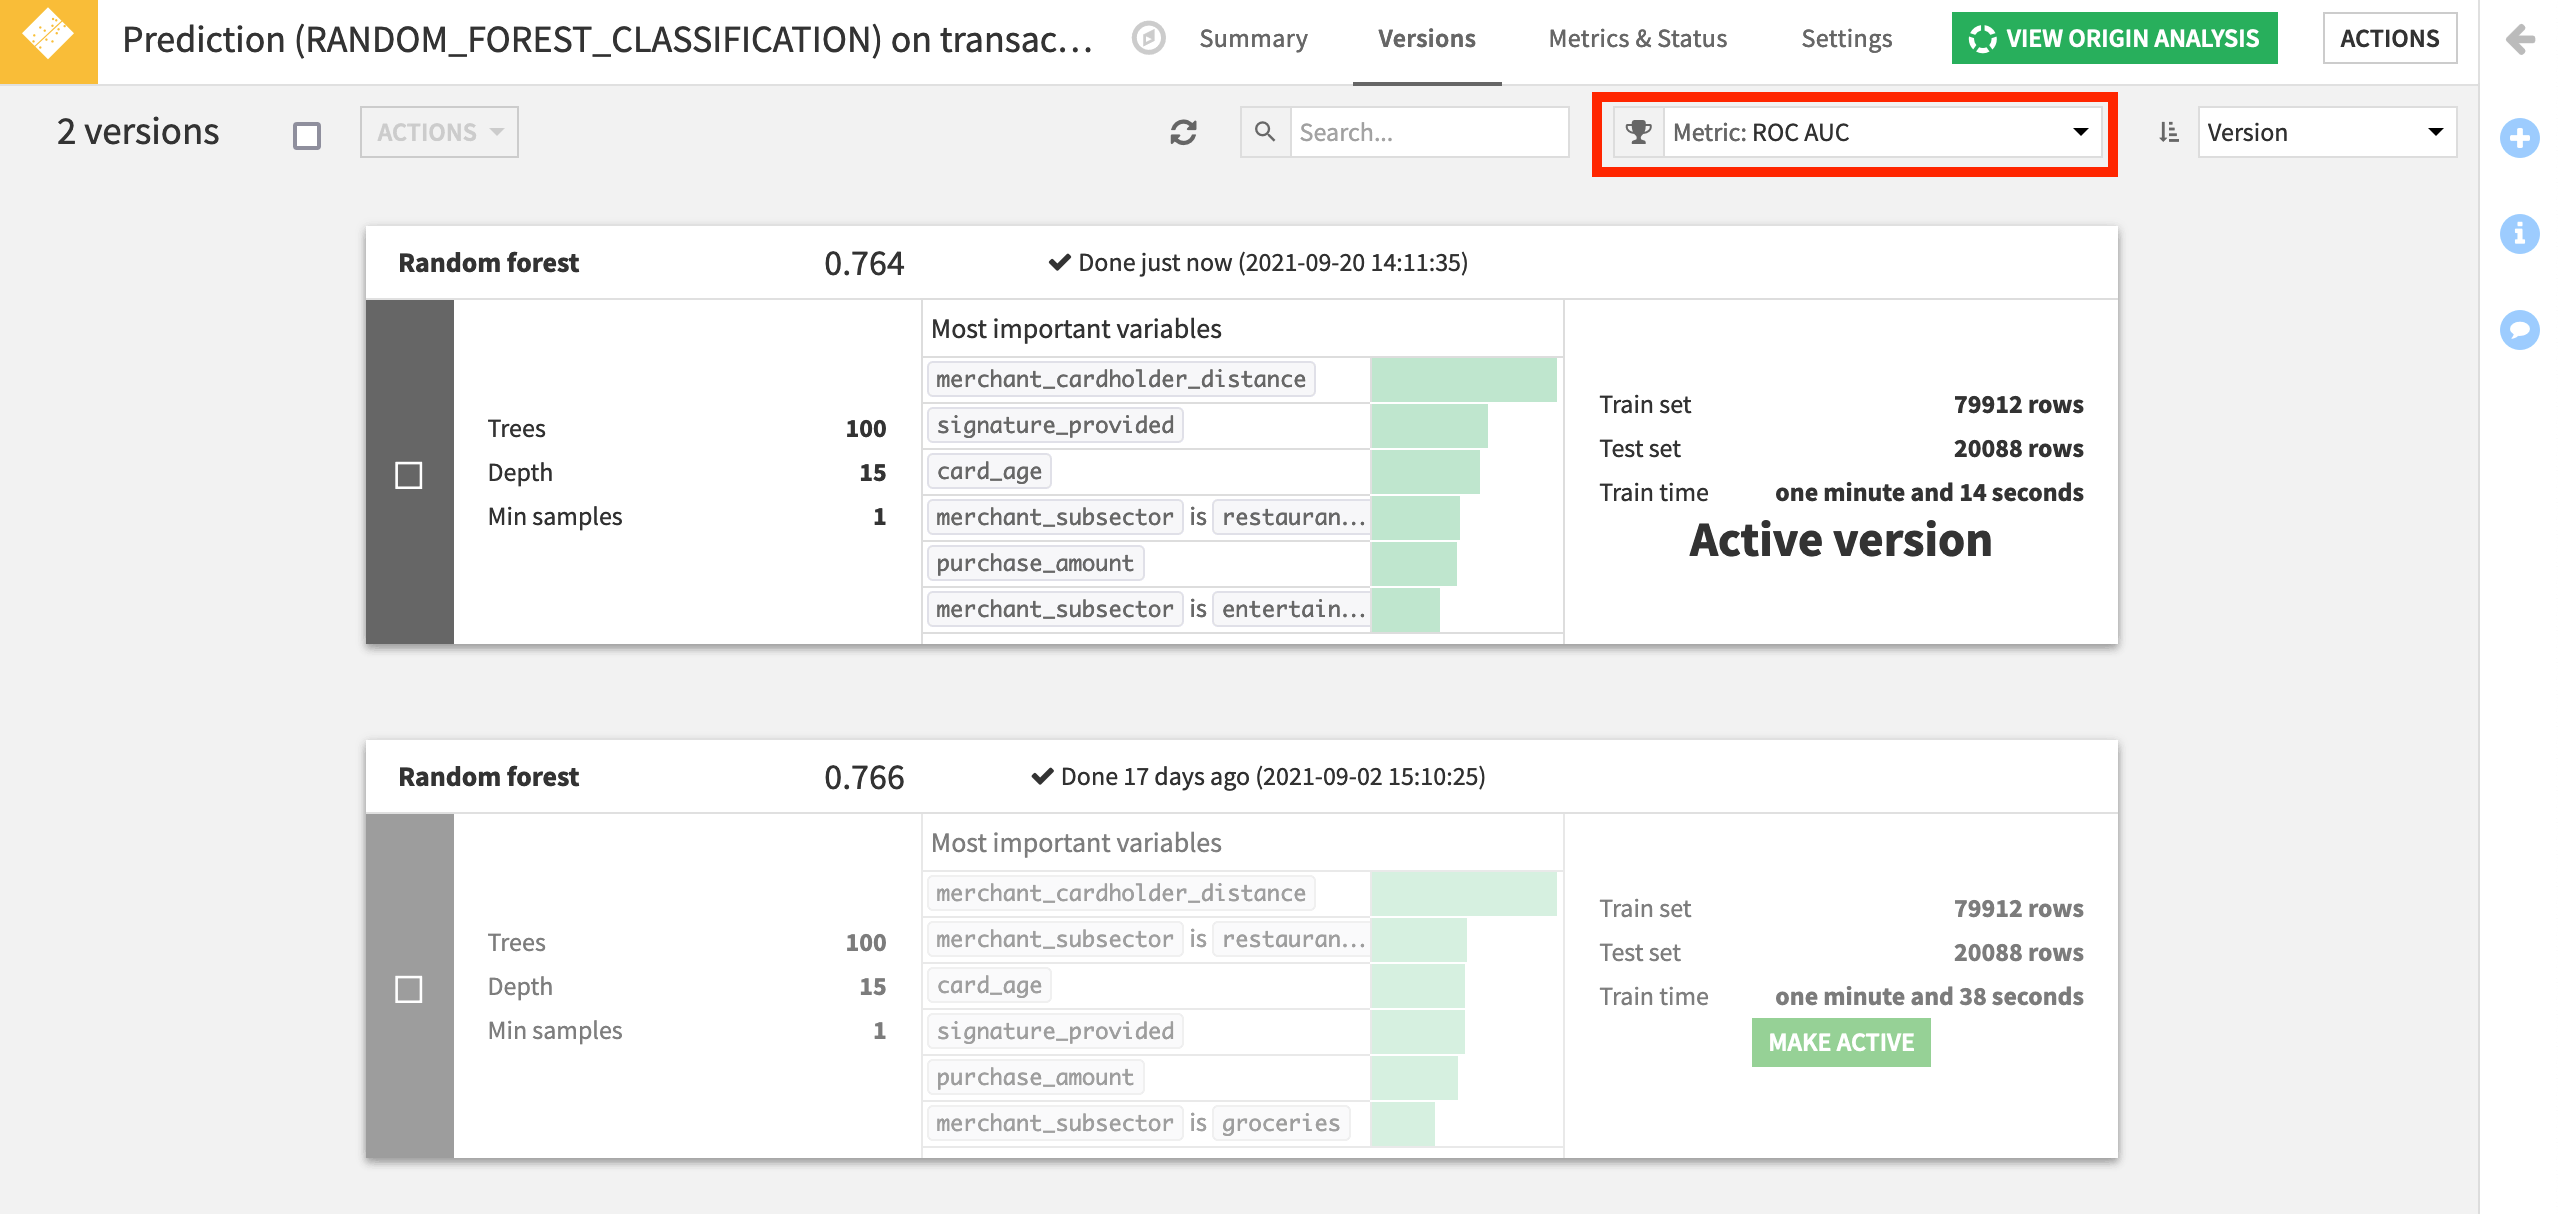
We can track this metric, along with many other common indicators of model performance.
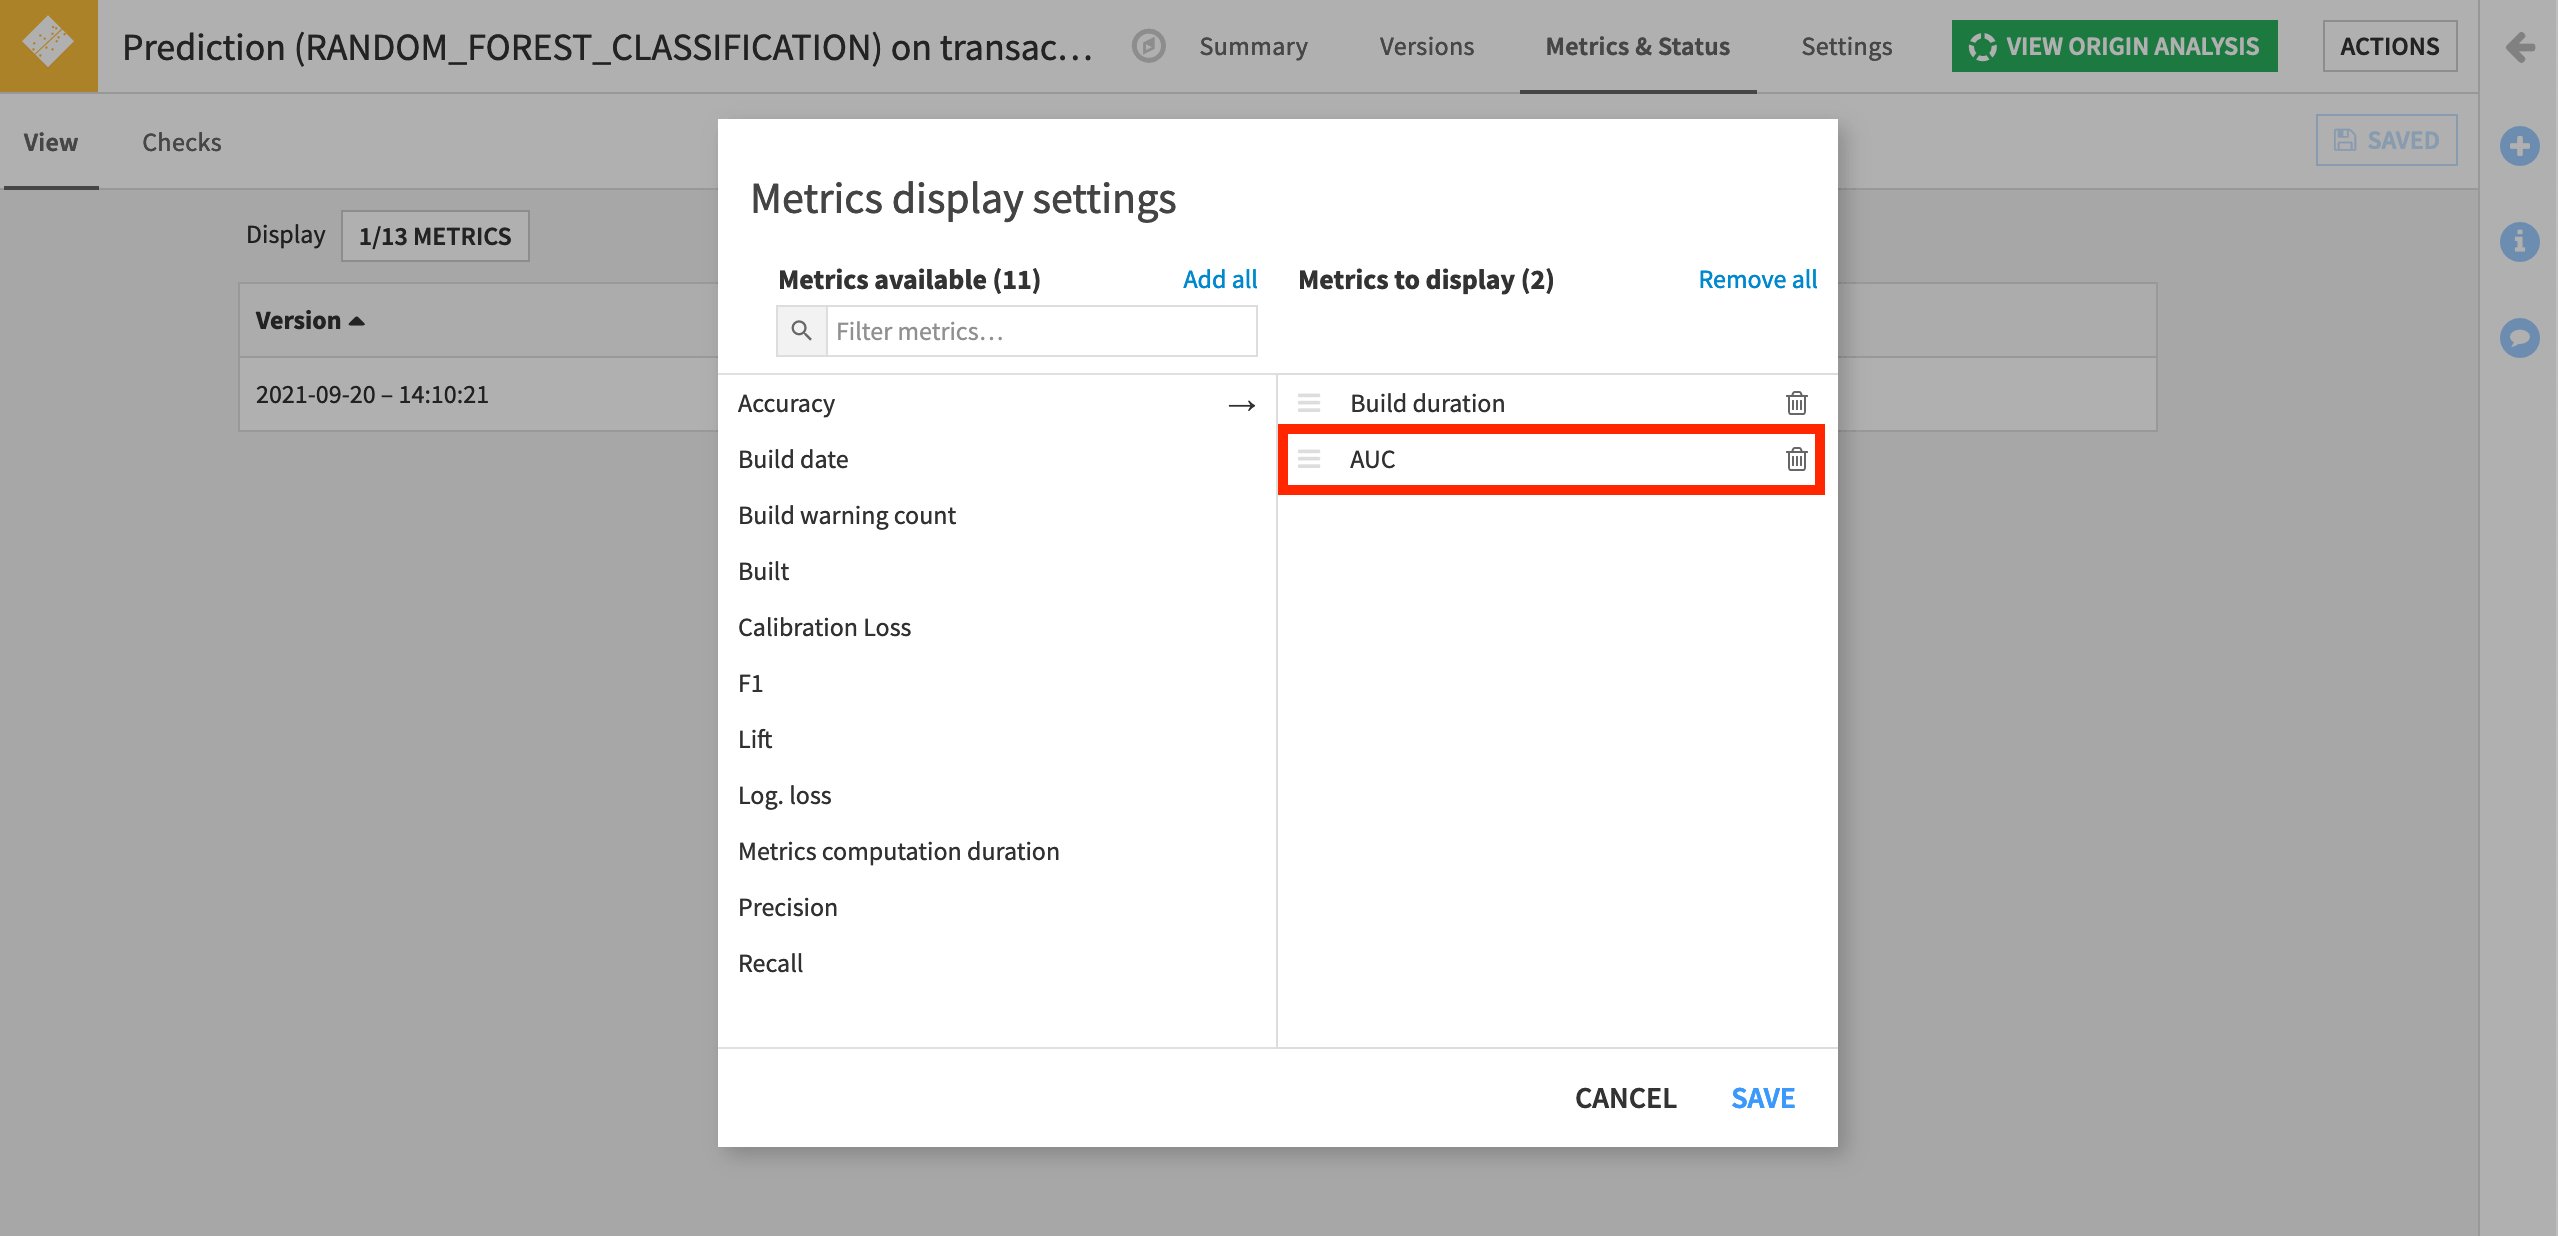
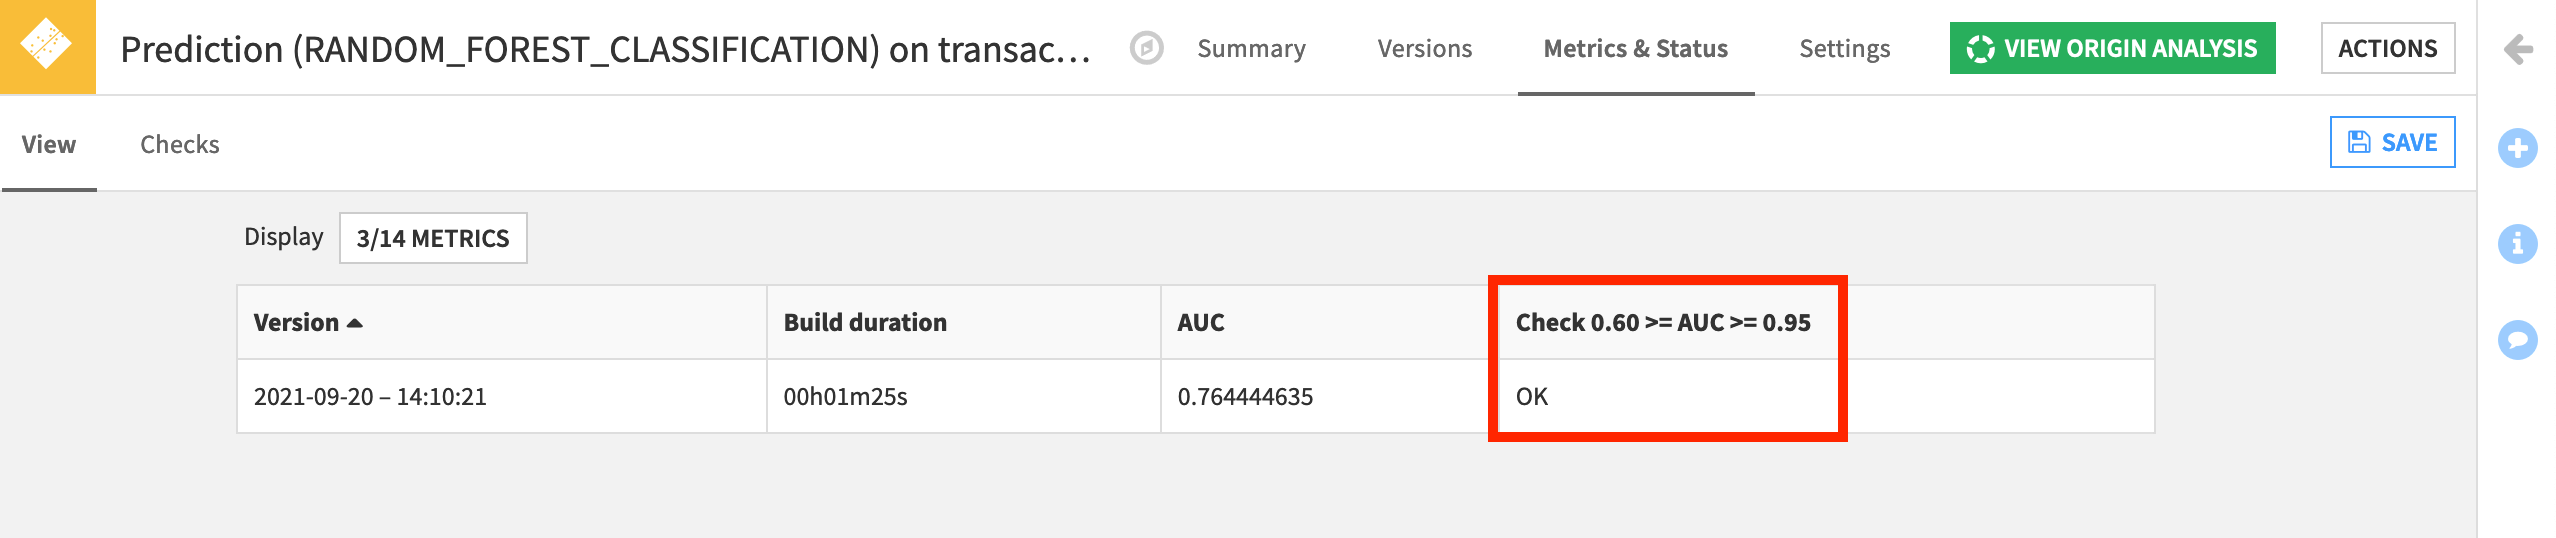
Navigate to the Metrics & Status tab of the deployed model object.
On the View subtab, click on the Display to show the built-in model metrics available.
Add and save AUC to the list of metrics to display. Other kinds of performance metrics, such as accuracy, precision and recall, are also available.
Now let’s create a check to monitor this metric.
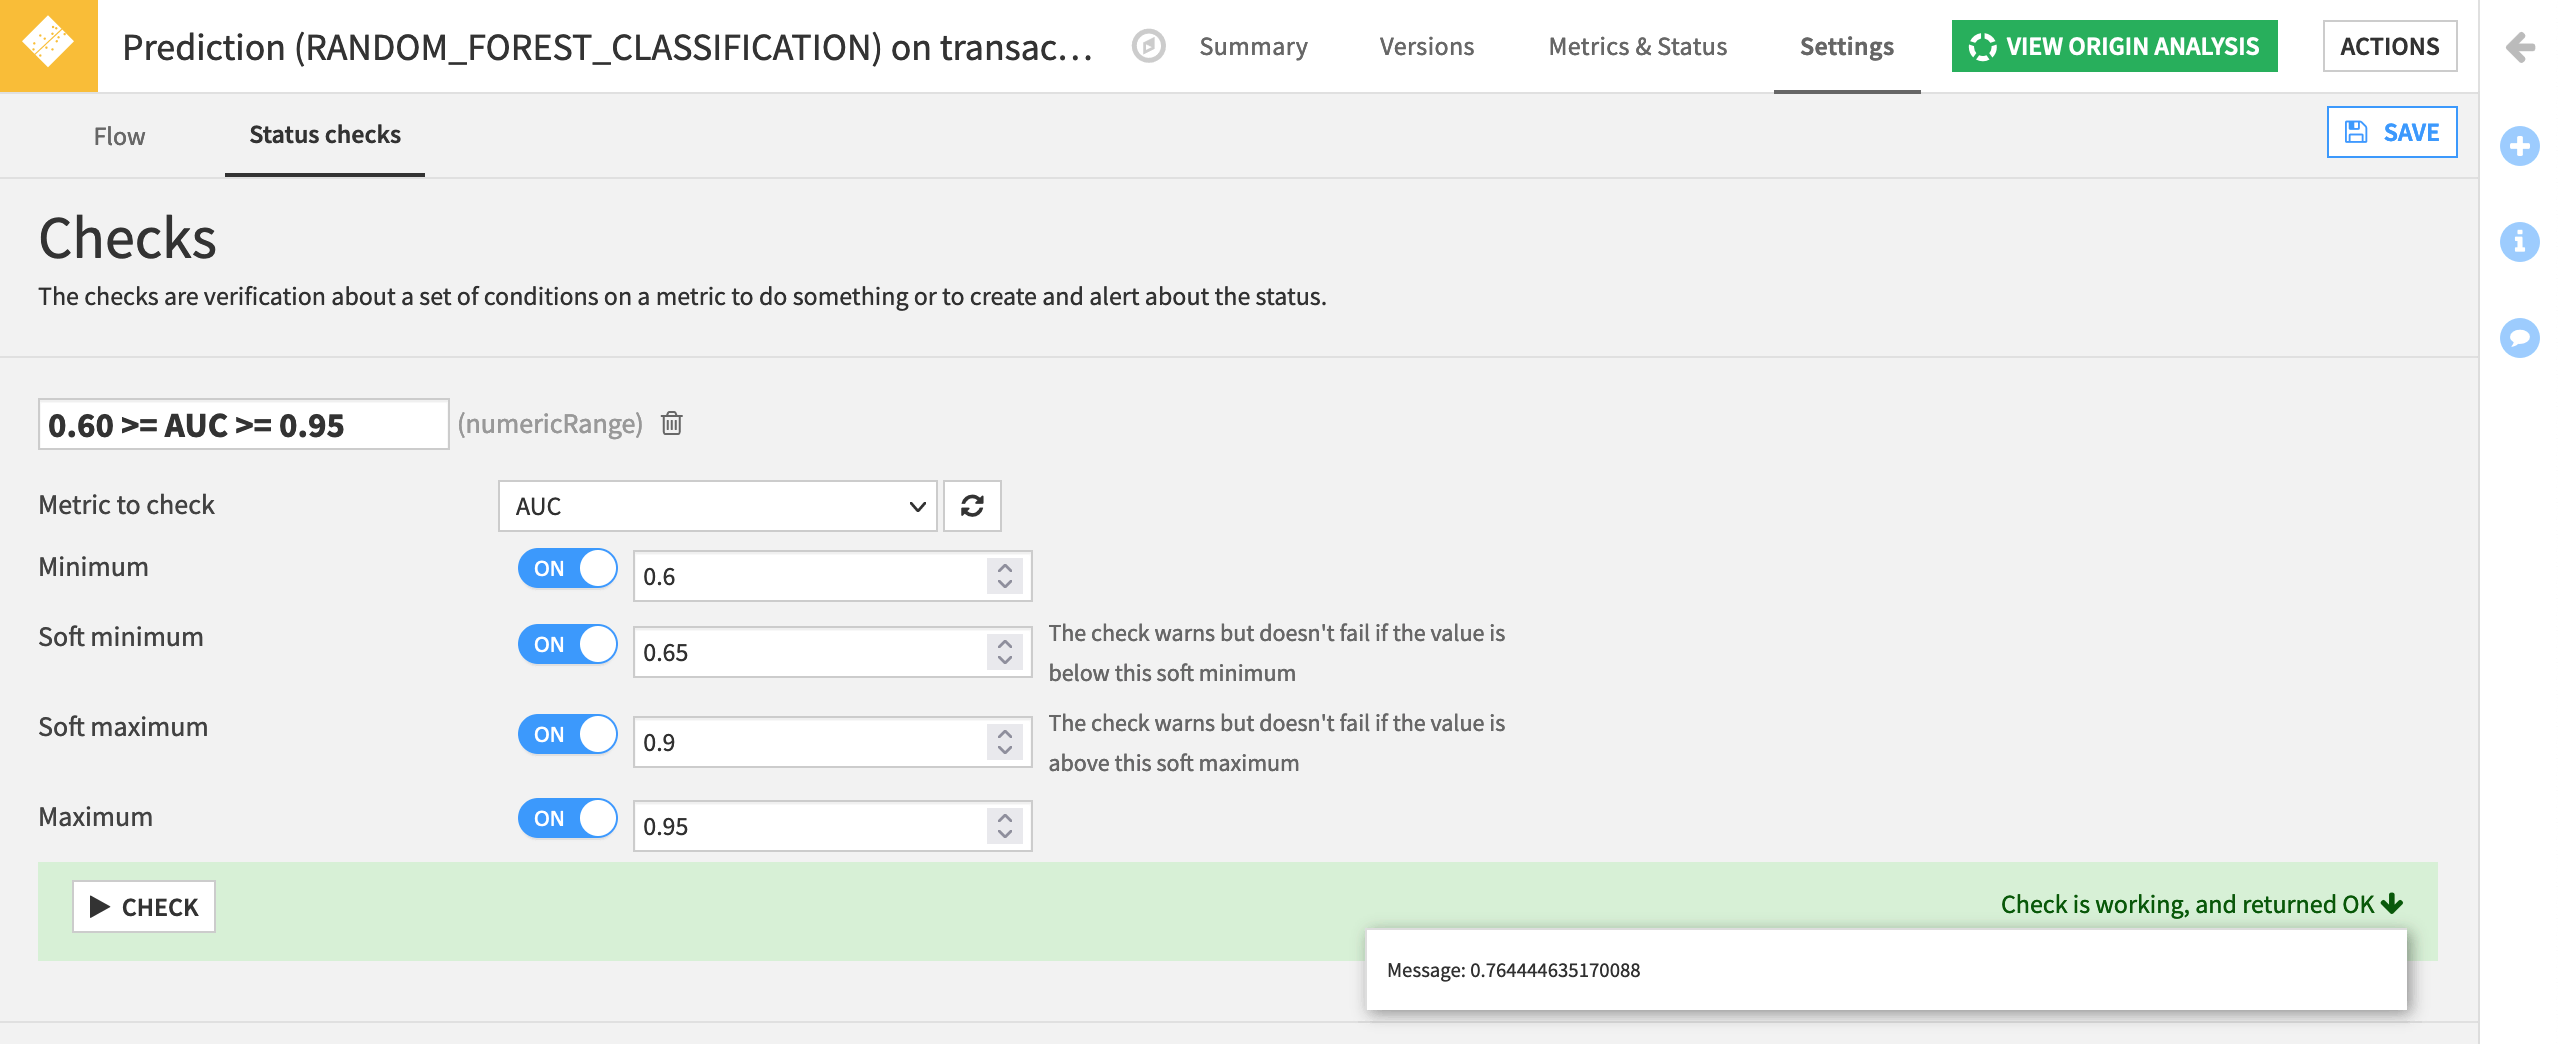
Navigate to the Settings tab.
Under the Status checks subtab, add a new check for Metric value is in a numeric range.
Name it
0.60 >= AUC >= 0.95.Select AUC as the metric to check.
Set a minimum to
0.6and a maximum of0.95to throw an error if the model performance has either degraded or become suspiciously high.Set a soft minimum of
0.65and a soft maximum of0.9to warn us if the performance of the deployed model has decreased or increased.Run the check to see if it is working. Save it.
Note
This AUC range is just an example. For your own use case, an allowable deviation in AUC may be very different.
Return to the Metrics & Status tab and add the new check to the Display.
Hands-On Tutorial: Scenarios (Part 2)
In the section above, we saw how to use built-in metrics and checks to monitor the status of datasets and models in Dataiku DSS.
Now let’s see how to use these metrics and checks inside of a scenario to automate workflows.
Create a Scenario
Let’s create our first scenario.
From the Jobs menu, navigate to the Scenarios panel, and create a new scenario.
Ensure “Sequence of steps” is selected, and name it
My Scenario.
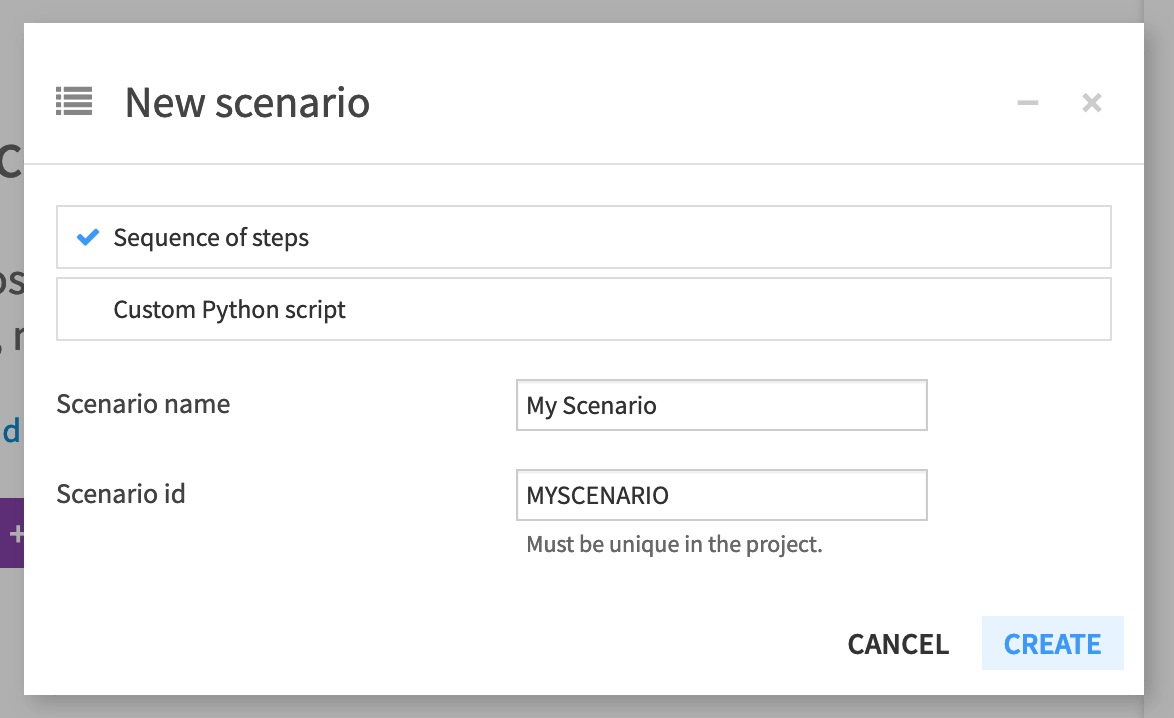
Note
We’ll see the Custom Python scenario in the next part of the tutorial.
A scenario has two required components:
triggers that activate a scenario and cause it to run, and
steps, or actions, that a scenario takes when it runs.
An optional third component of a scenario is a reporter. For more information, please see the product documentation on reporters.
Add a Trigger
Dataiku DSS allows us to create many kinds of triggers to activate a scenario. These triggers can be based on:
a change in time,
a change in a dataset,
a change in the result of a SQL query,
or custom code.
Scenario Notes for Dataiku Online Users
Tip
Orbit subscribers of Dataiku Online should note that only time-based triggers are available.
Free trial users of Dataiku Online will not be able to automatically run scenarios with a trigger. When asked to do so below, they will need to manually run the scenario.
Let’s start with the simplest kind of trigger.
Within the Triggers panel of the Settings tab, click the Add Trigger dropdown button.
Add a Time-based trigger.
Instead of the default “Time-based”, name it
Every 3 min.Change “Repeat every” to 3 minutes.
Make sure its activity status is marked as ON.
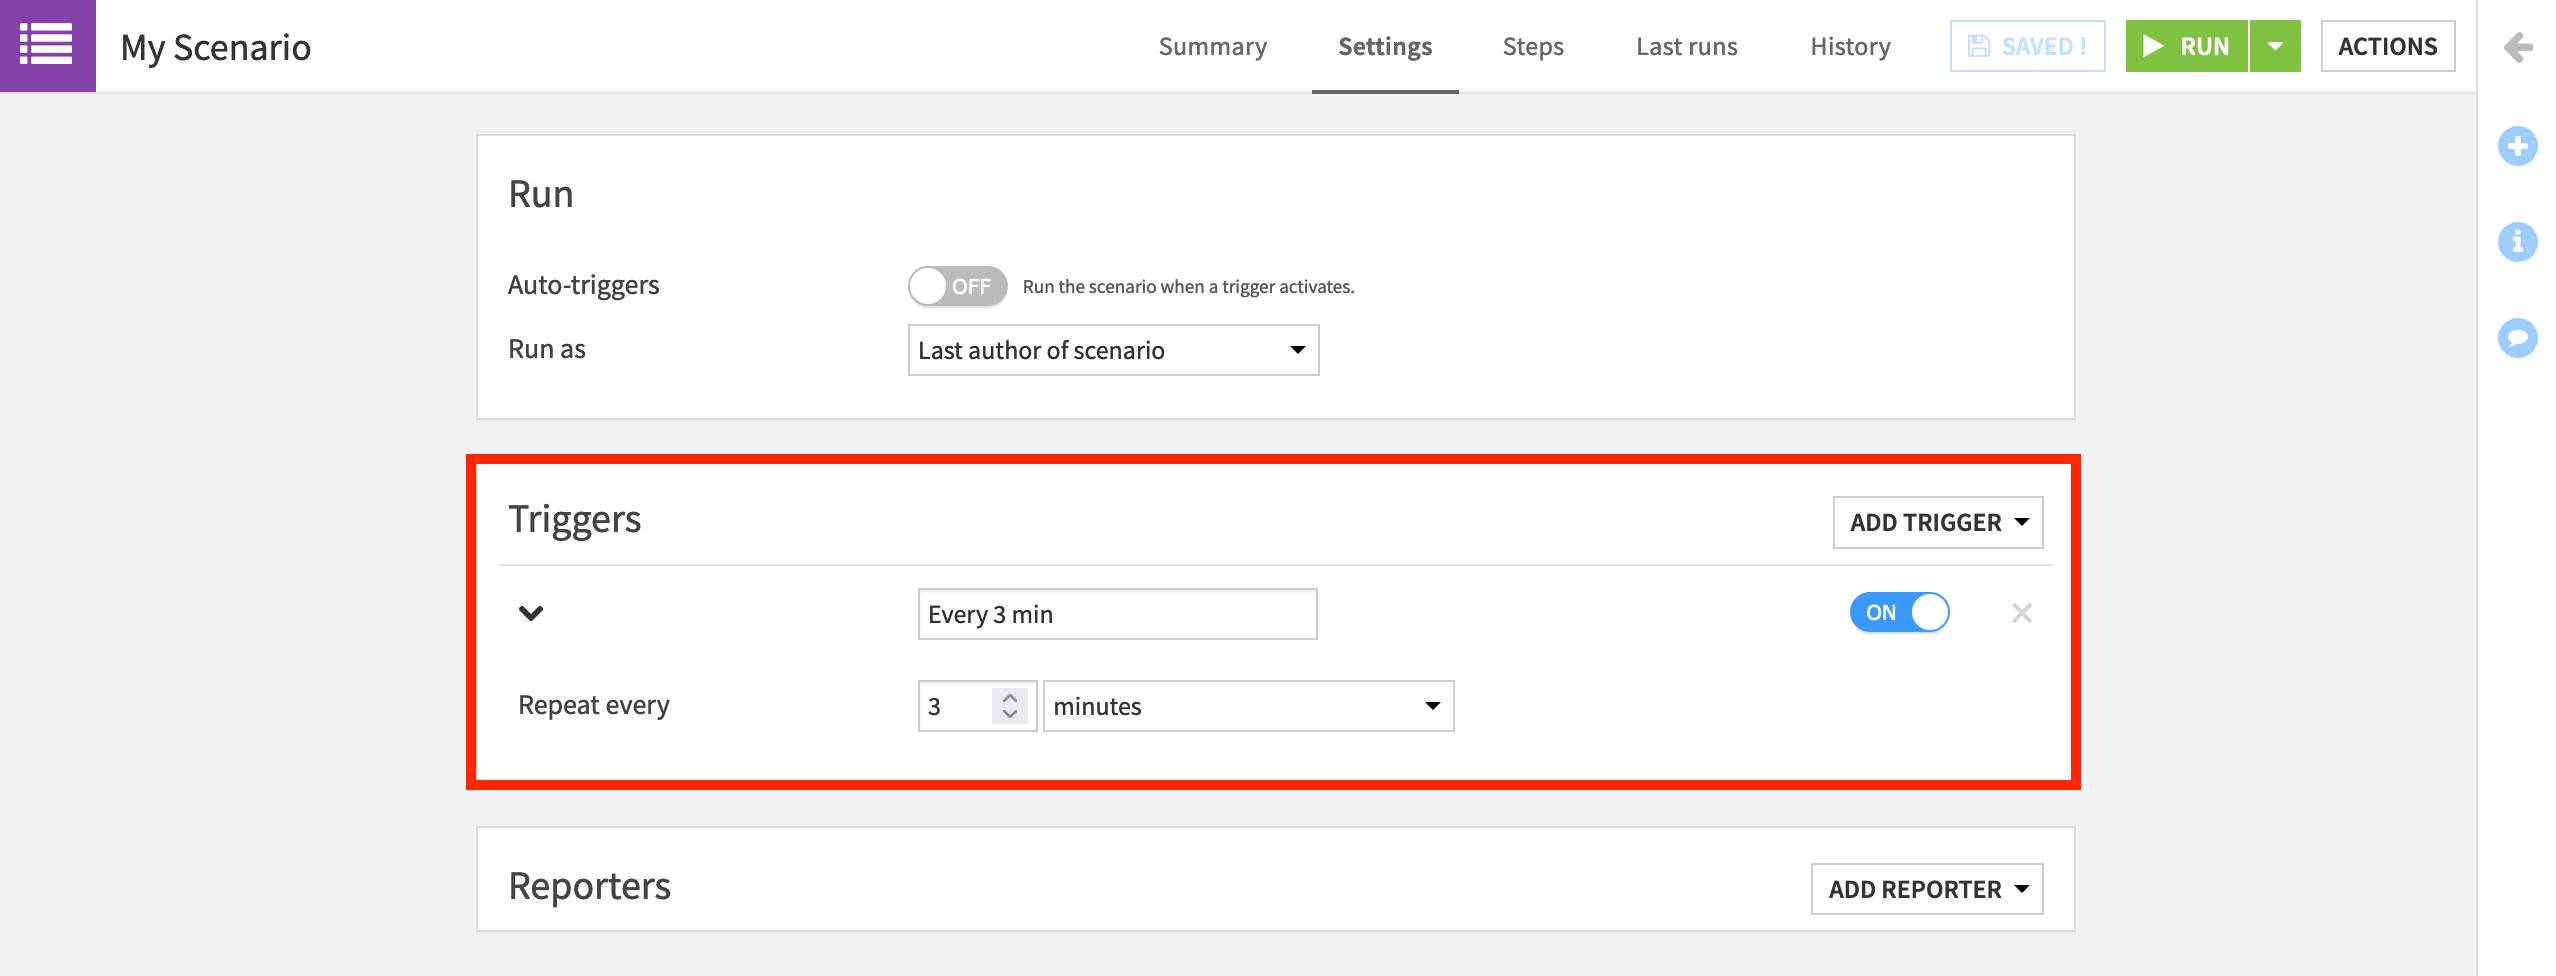
Note
For many use cases, it would be unusual to have a scenario run this frequently. This short duration is only to let us see the scenario running in a short amount of time.
Add Steps
Now that we have a trigger in place, we need to provide the steps that the scenario will take when a trigger is activated. In a somewhat contrived example, let’s demonstrate how to rebuild datasets, compute metrics, and set project variables in a scenario.
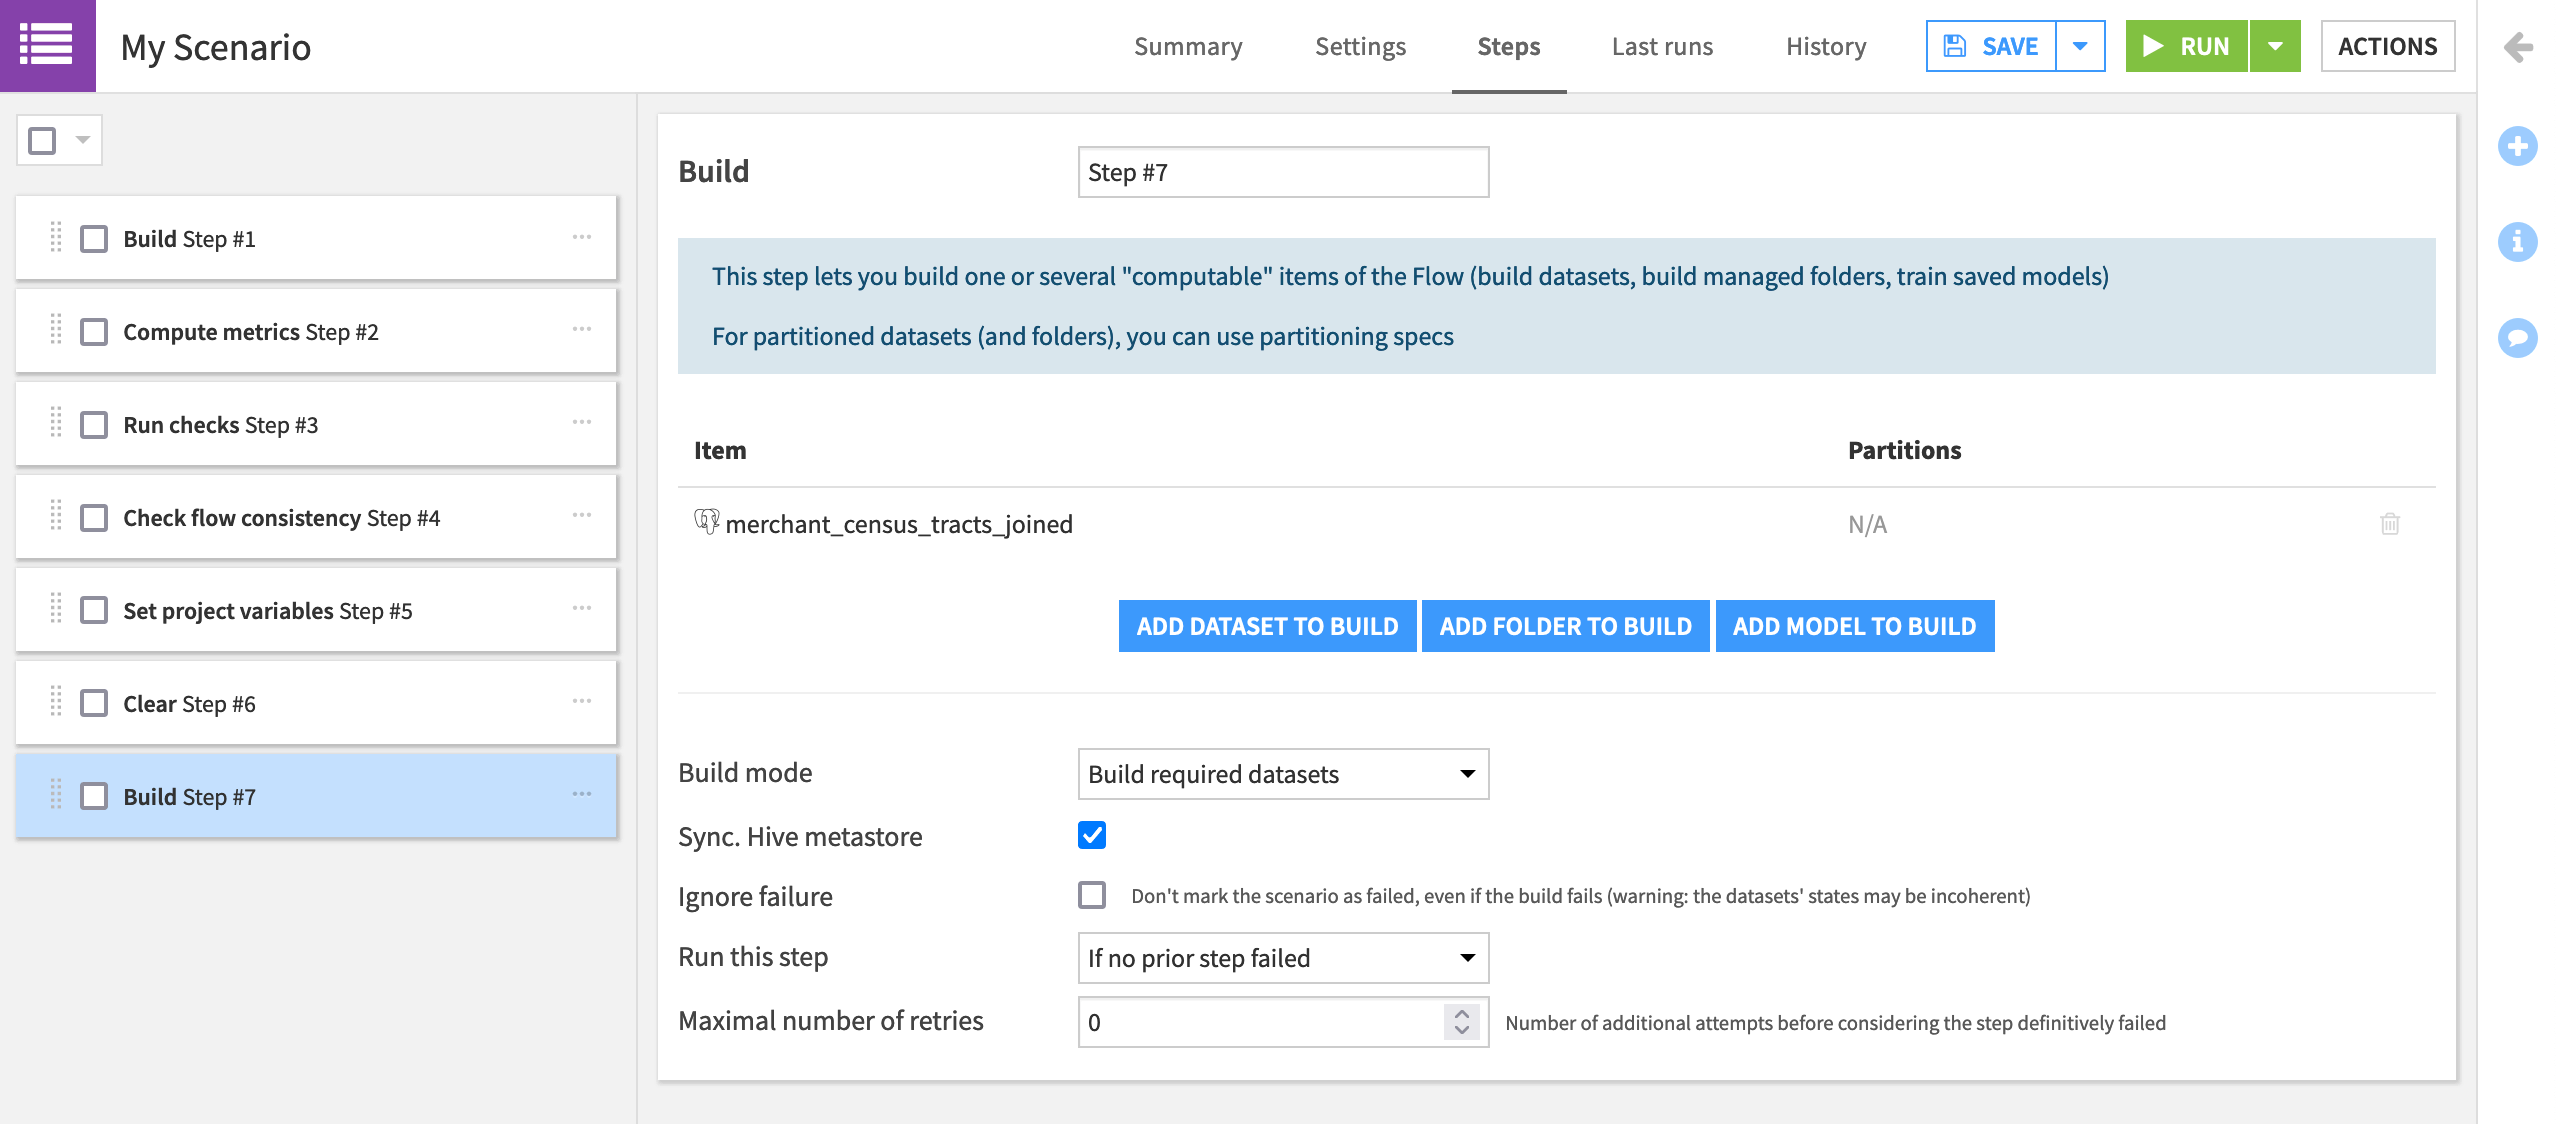
Navigate to the Steps tab.
From the Add Step dropdown, first add a Build / Train step. Add transactions_joined_prepared as the dataset to build.
Note that this step has Build required datasets as the Build mode. Accordingly, because we won’t have “new” data in this tutorial, datasets upstream to transactions_joined_prepared will never be out of date, and this step will only build transactions_joined_prepared.
Note
To learn more about building strategies in Dataiku DSS, see the course Flow Views & Actions.
Add the step Compute metrics. Choose transactions_joined_prepared as the dataset to compute.
Earlier we manually computed metrics like the minimum and maximum of card_fico_score. Now the scenario will execute this computation whenever triggered.
Add the step Run checks. Choose transactions_joined_prepared as the dataset to check.
Checks we created, such as whether the minimum of card_fico_score is greater than or equal to 300, will be recomputed.
Add the step Check project consistency.
As our data has not changed, we know that the schema consistency check is going to run smoothly, but in a production use case, it can help detect when the schema of an input dataset has changed.
Add the step Set project variables. The current state_name variable is “Delaware”. Reset it to another state as shown below. You can imagine changing the value of the variable if some condition is met.
{
    "state_name": "Rhode Island"
}
Add a Clear step. Choose transactions_by_merchant_id as the dataset to clear.
This is the output dataset to the Group recipe which uses the state_name variable.
Add one more Build / Train step. Choose merchants_census_tracts_joined as the dataset to build.
With a new state_name variable and an empty transactions_by_merchant_id dataset, this section of the Flow will get rebuilt from the Group recipe.
After saving, we could click the green Run button to manually trigger the scenario. This is important to test out scenario runs, but let’s see the triggers in action!
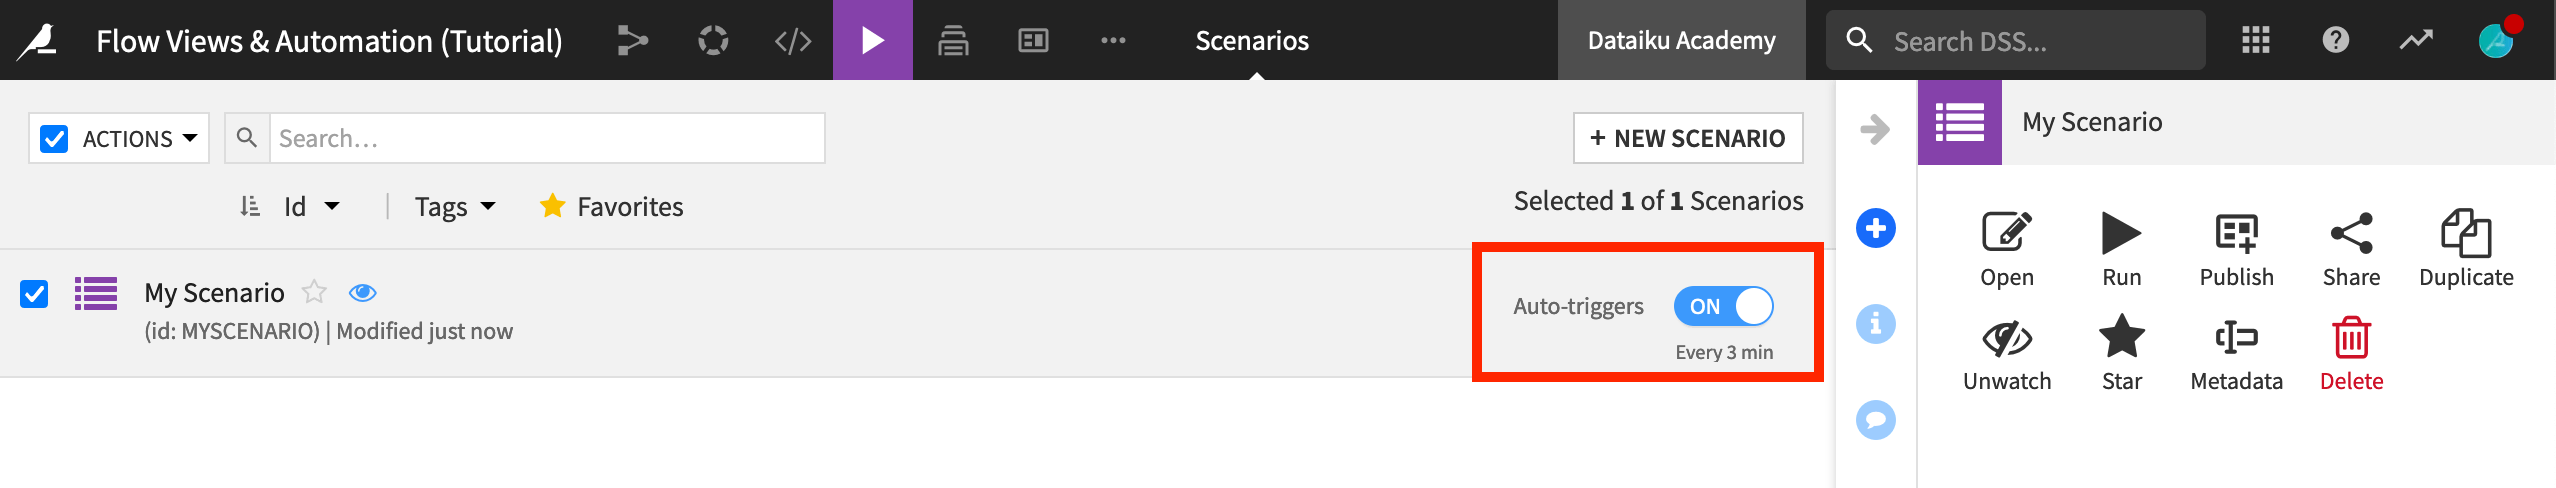
Navigate to the Scenario panel in the Jobs menu where all scenarios for the project are listed.
Turn the “Auto-triggers” switch to “ON” to have Dataiku DSS start monitoring the triggers of the scenario.
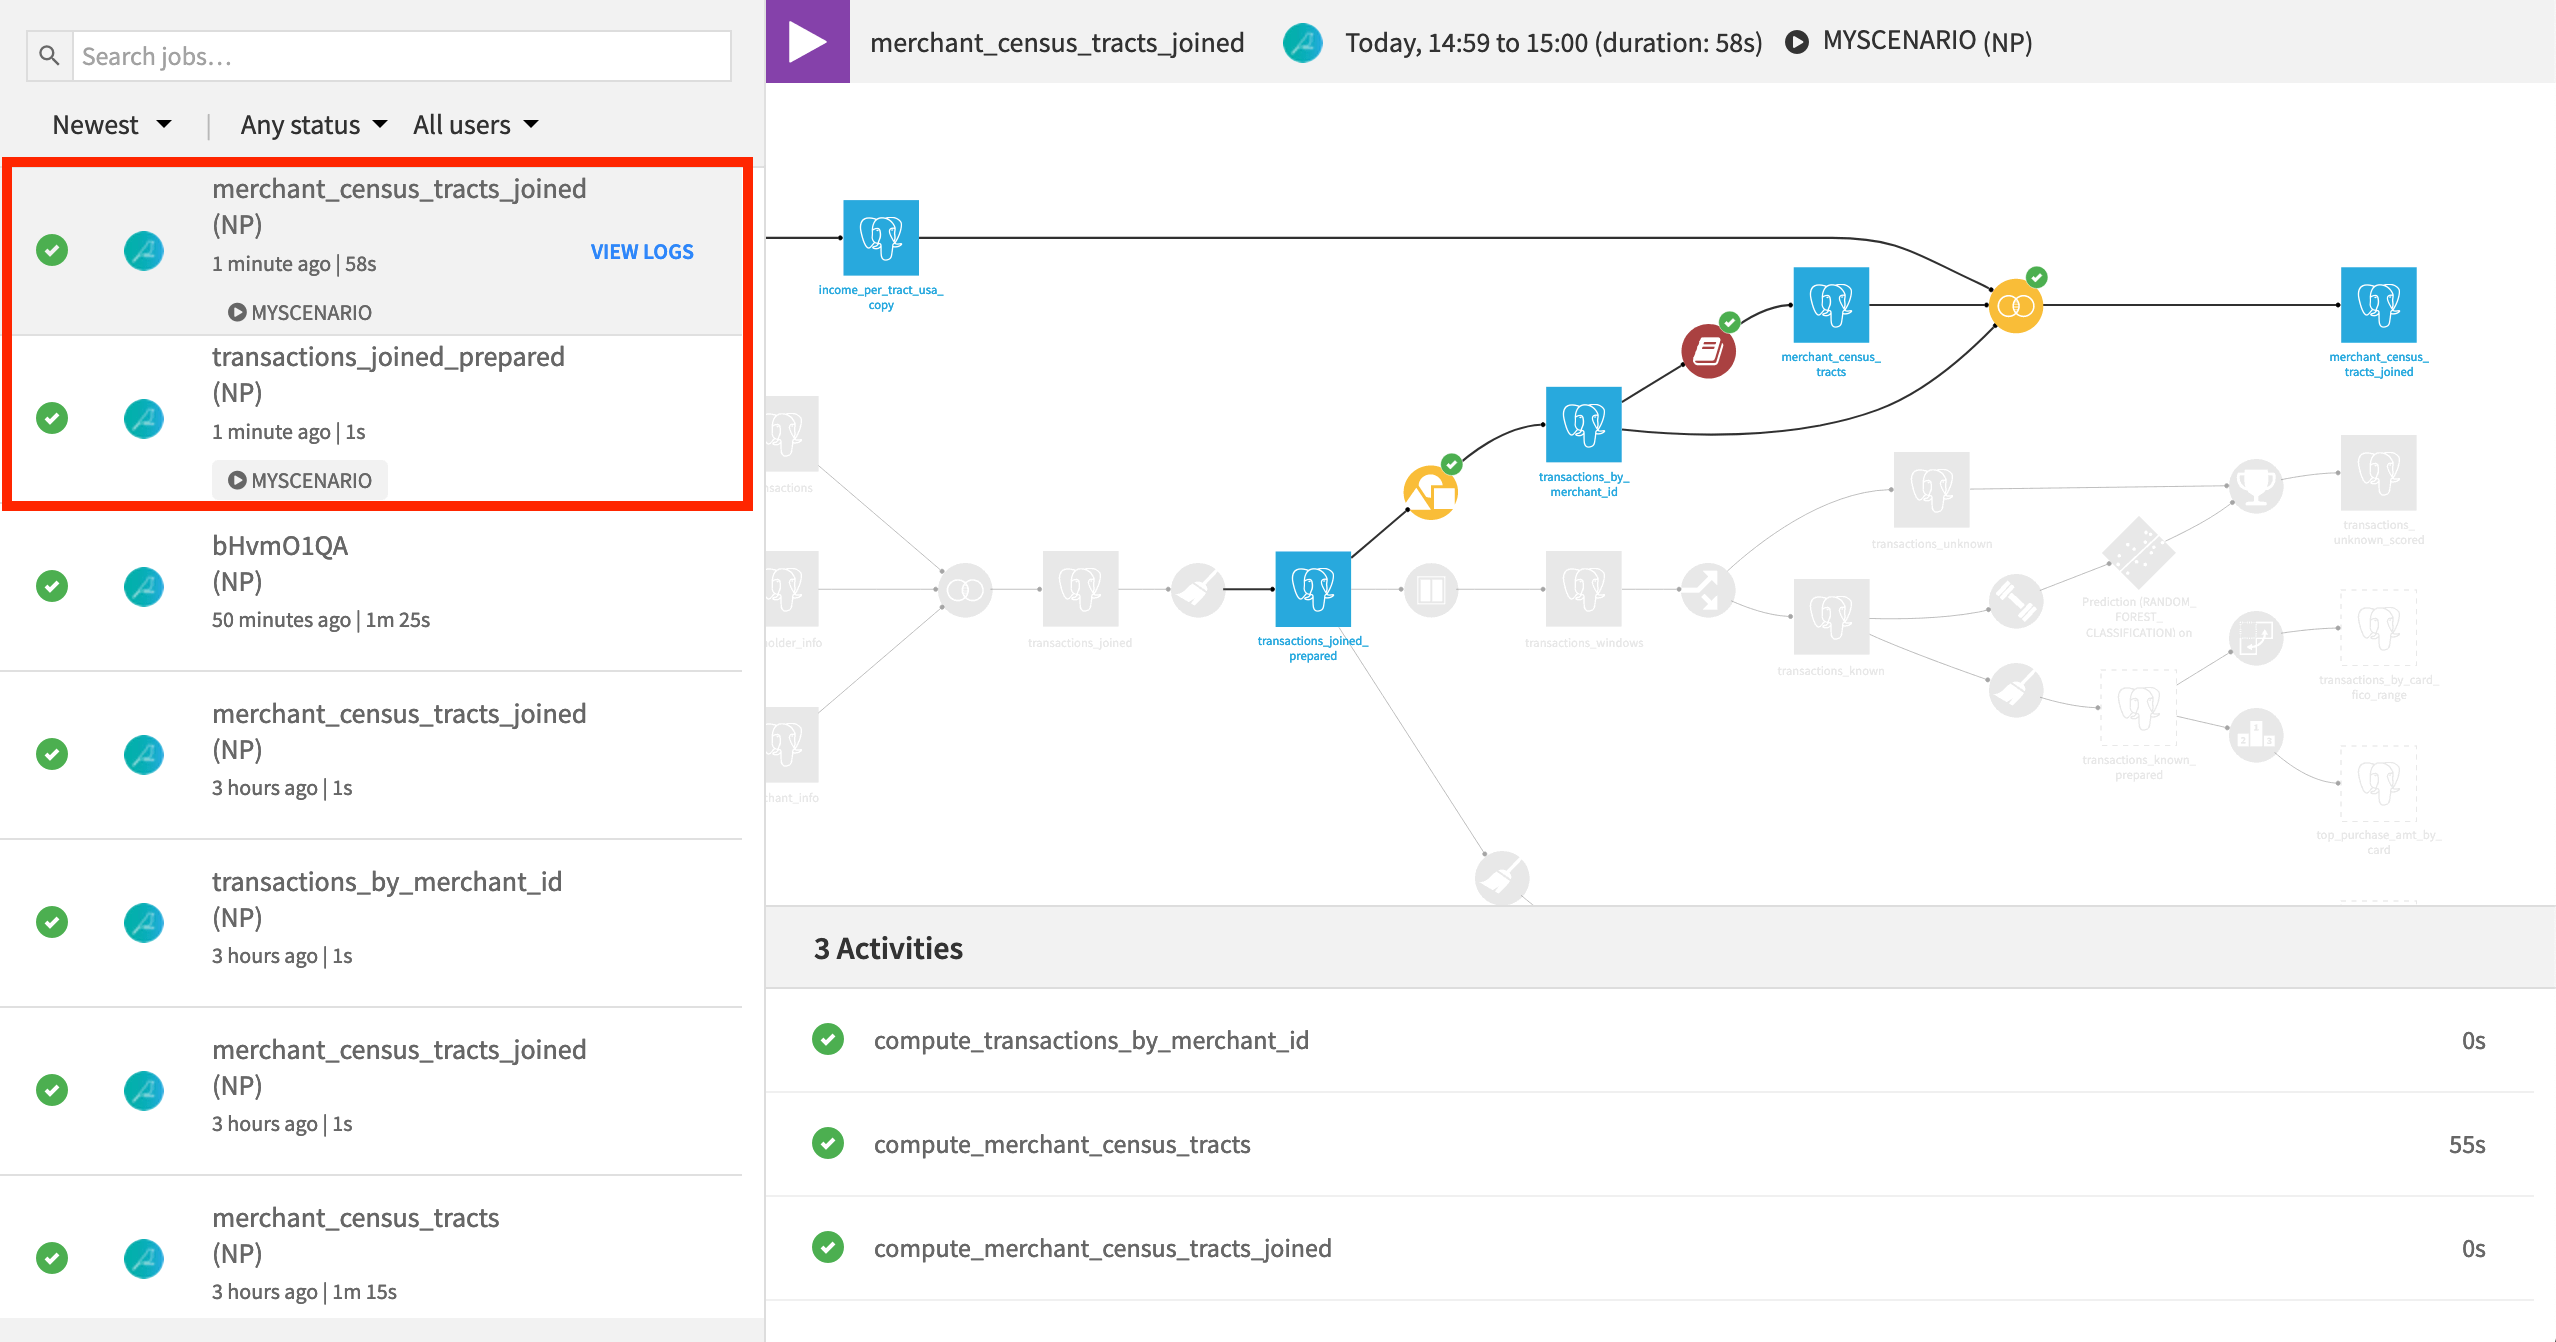
Once the scenario starts running, check its progress in the Jobs page. Jobs attached to a scenario have a label including the name of the scenario. We can see that this scenario creates two jobs.
Recall that we chose “Build required datasets” for the build mode instead of an option like “Build only this dataset” or “Force rebuild”. Accordingly, there is “nothing to do” for building transactions_joined_prepared as there is no new data.
Rebuilding merchants_census_tracts_joined, however, does require activity because one of the datasets it depends on has been cleared.
Hint
Check the merchants_census_tracts_joined dataset again. Has the merchant_state column updated from “Delaware” to the new variable?
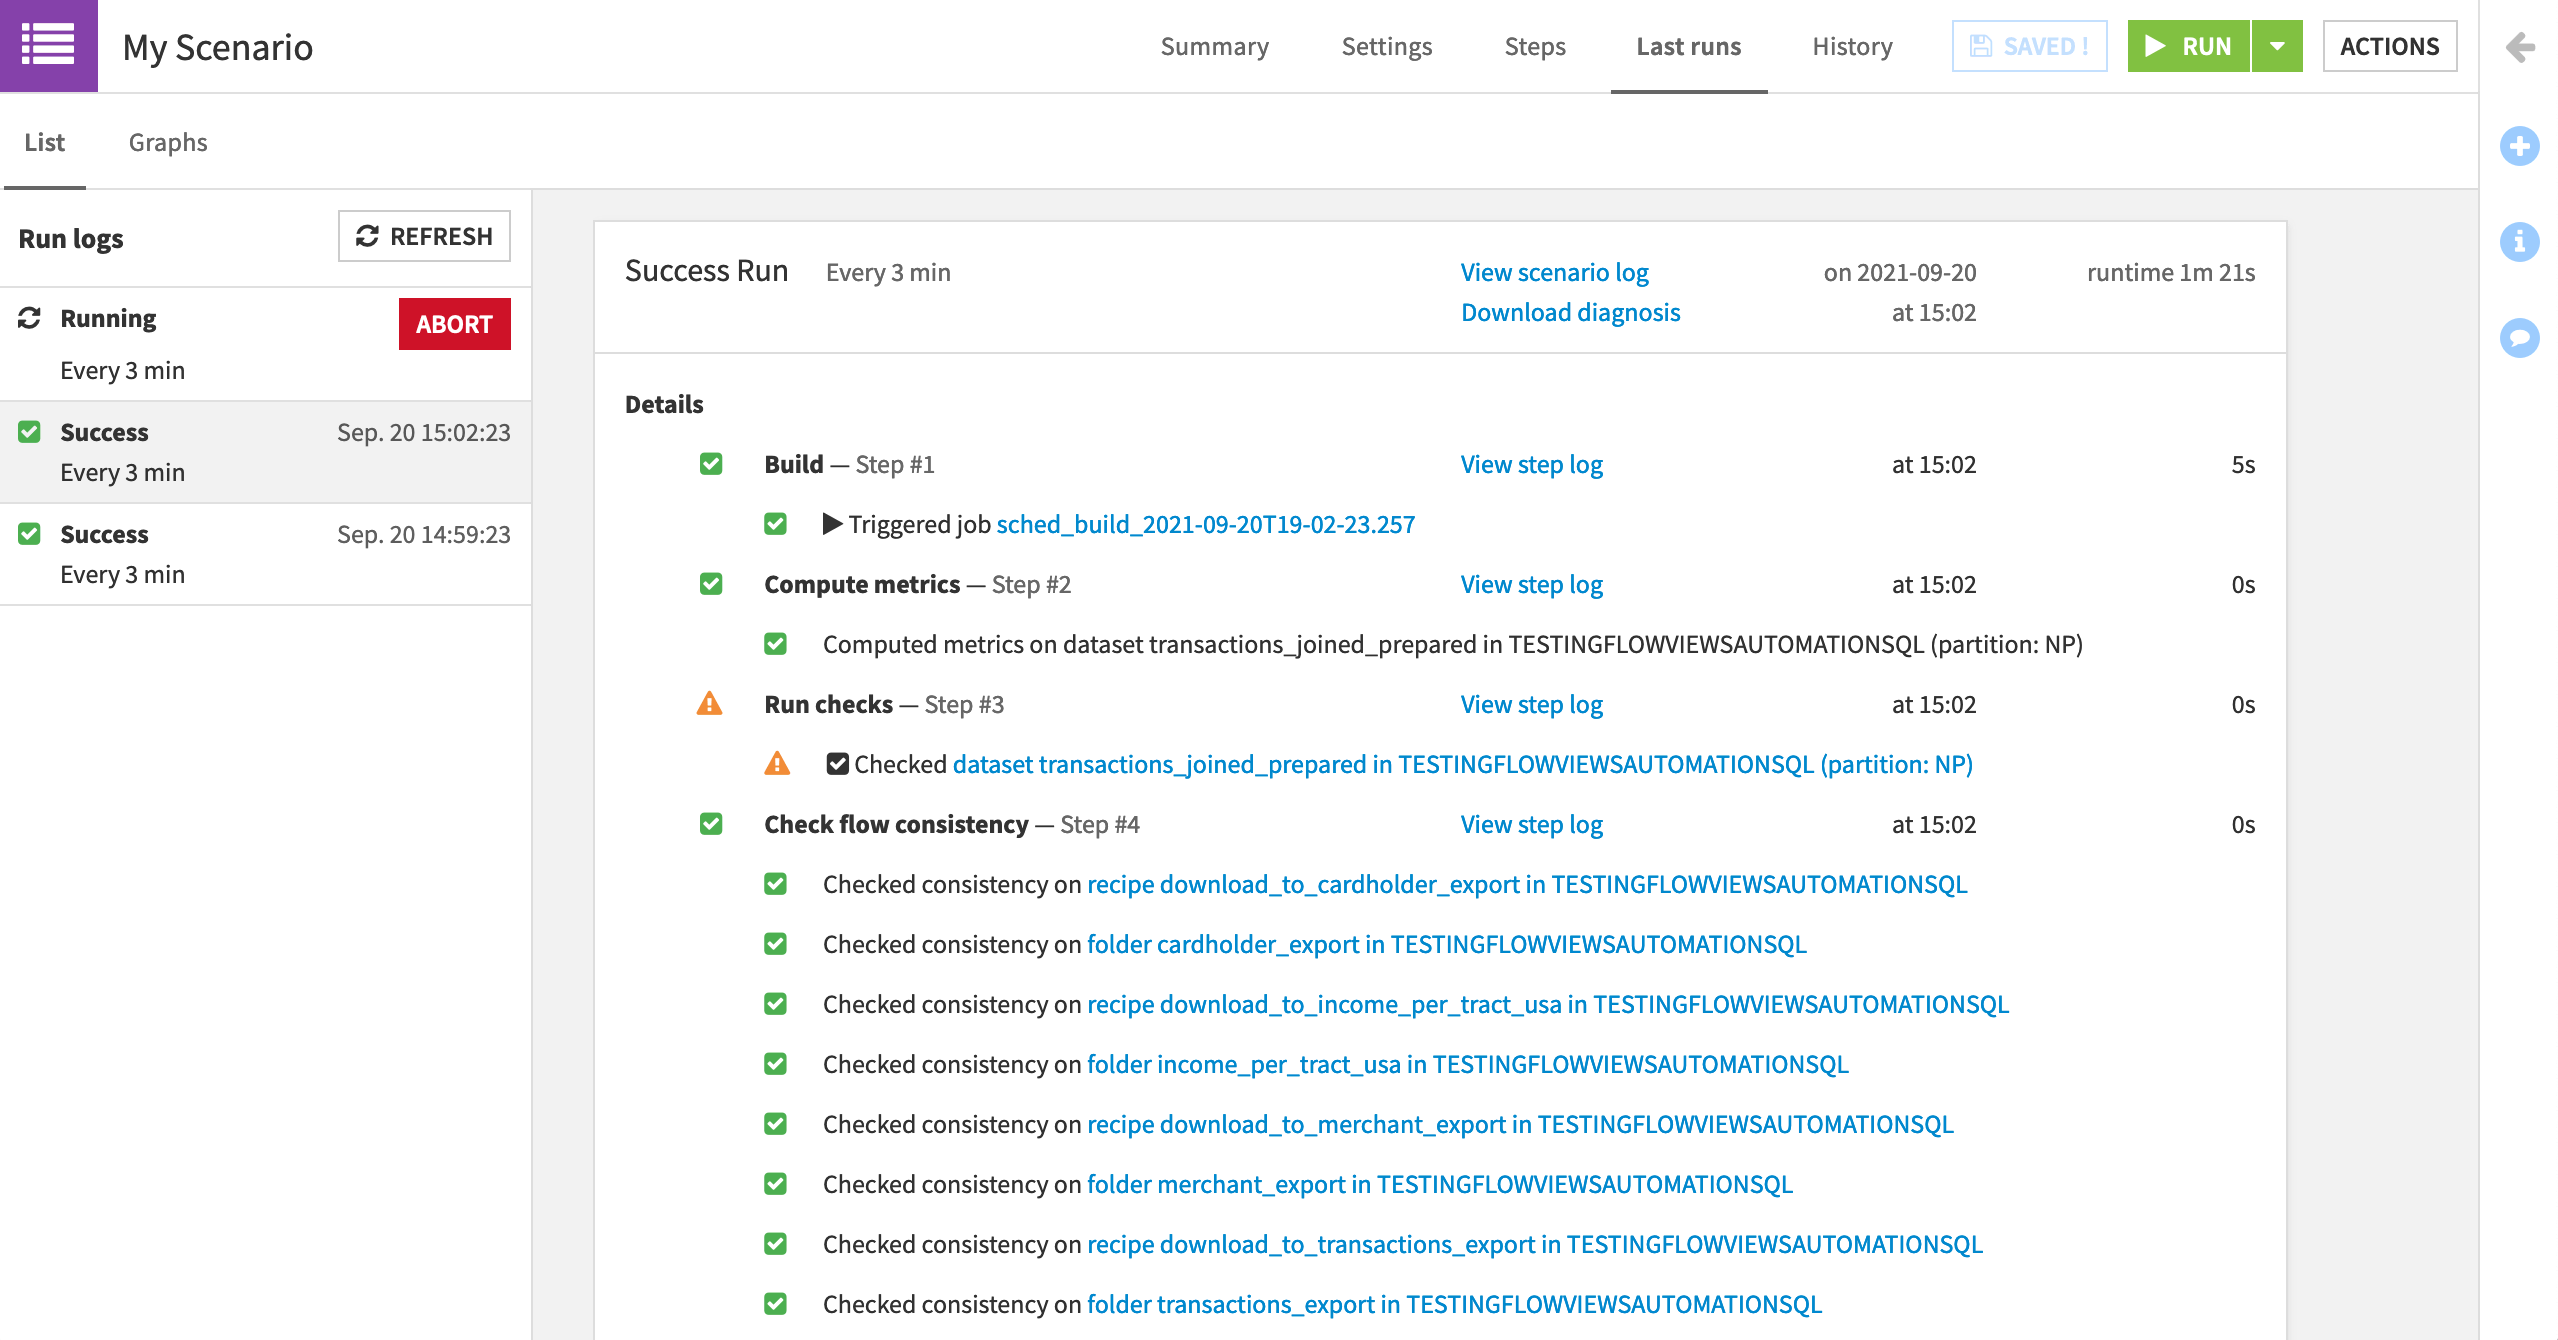
We can keep tabs on the progress through the Last runs tab of the scenario.
Click to open the scenario.
Navigate to the Last runs tab.
Once you have seen a few runs, turn off the scenario from the main Scenarios page.
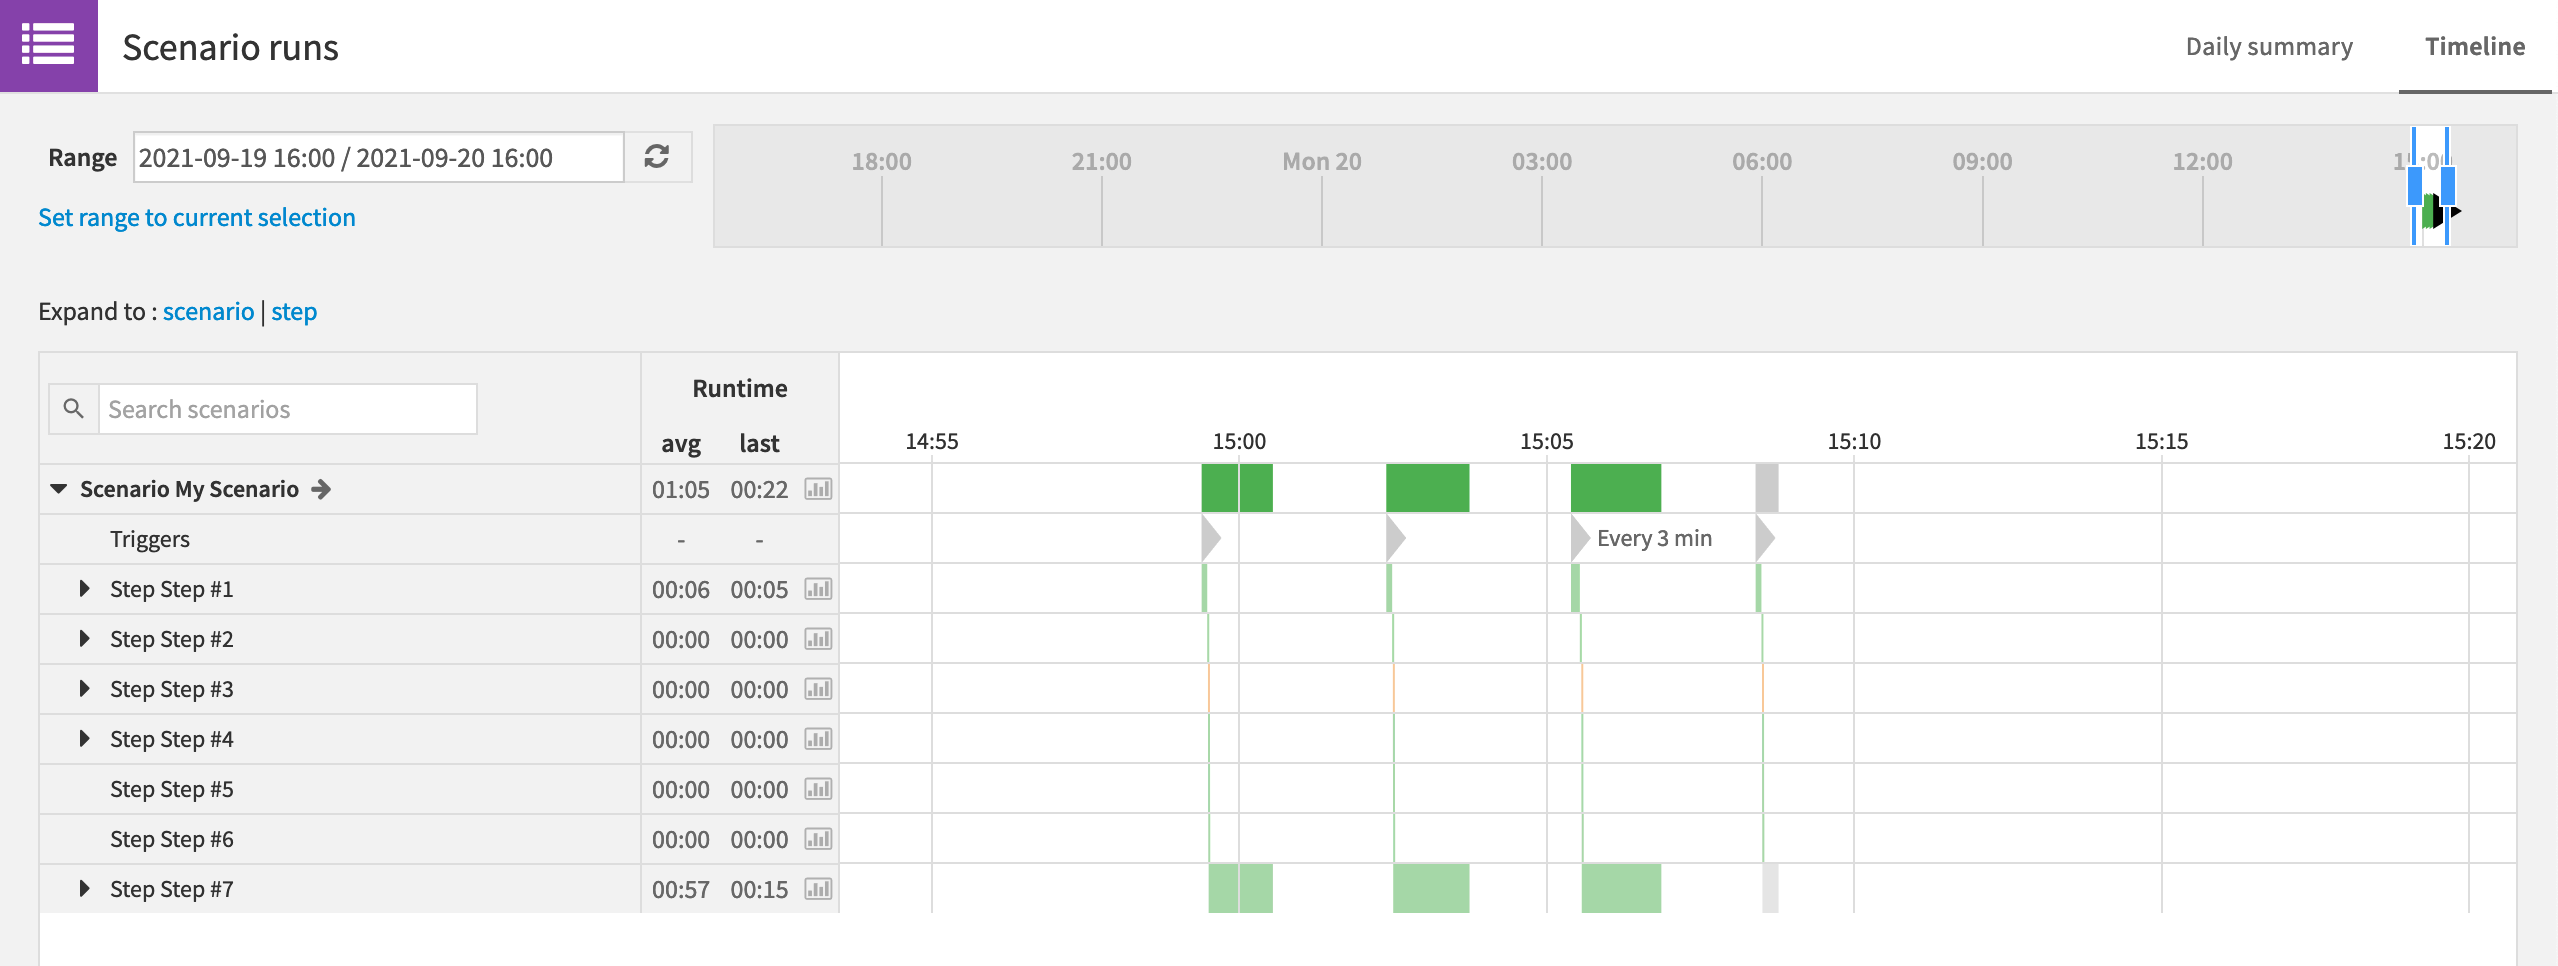
Note
If we have multiple scenarios, the Automation Monitoring panel in the Jobs menu provides similar information for all scenario activities coming from the project. This feature is not available to free edition users.
Hands-On Tutorial: Custom Metrics, Checks & Scenarios (Part 3)
In the sections above, we saw how to use built-in metrics, checks, and scenarios to automate workflows in Dataiku DSS.
The built-in options cover a wide range of common actions. However, for certain objectives, you may need greater flexibility than what is possible with the built-in tools. In these cases, you can customize all of these components with your own code.
Create a Custom Metric
In addition to the built-in probes, we can also create our own:
Python probes,
SQL query probes (where applicable), or
a custom probe from a plugin.
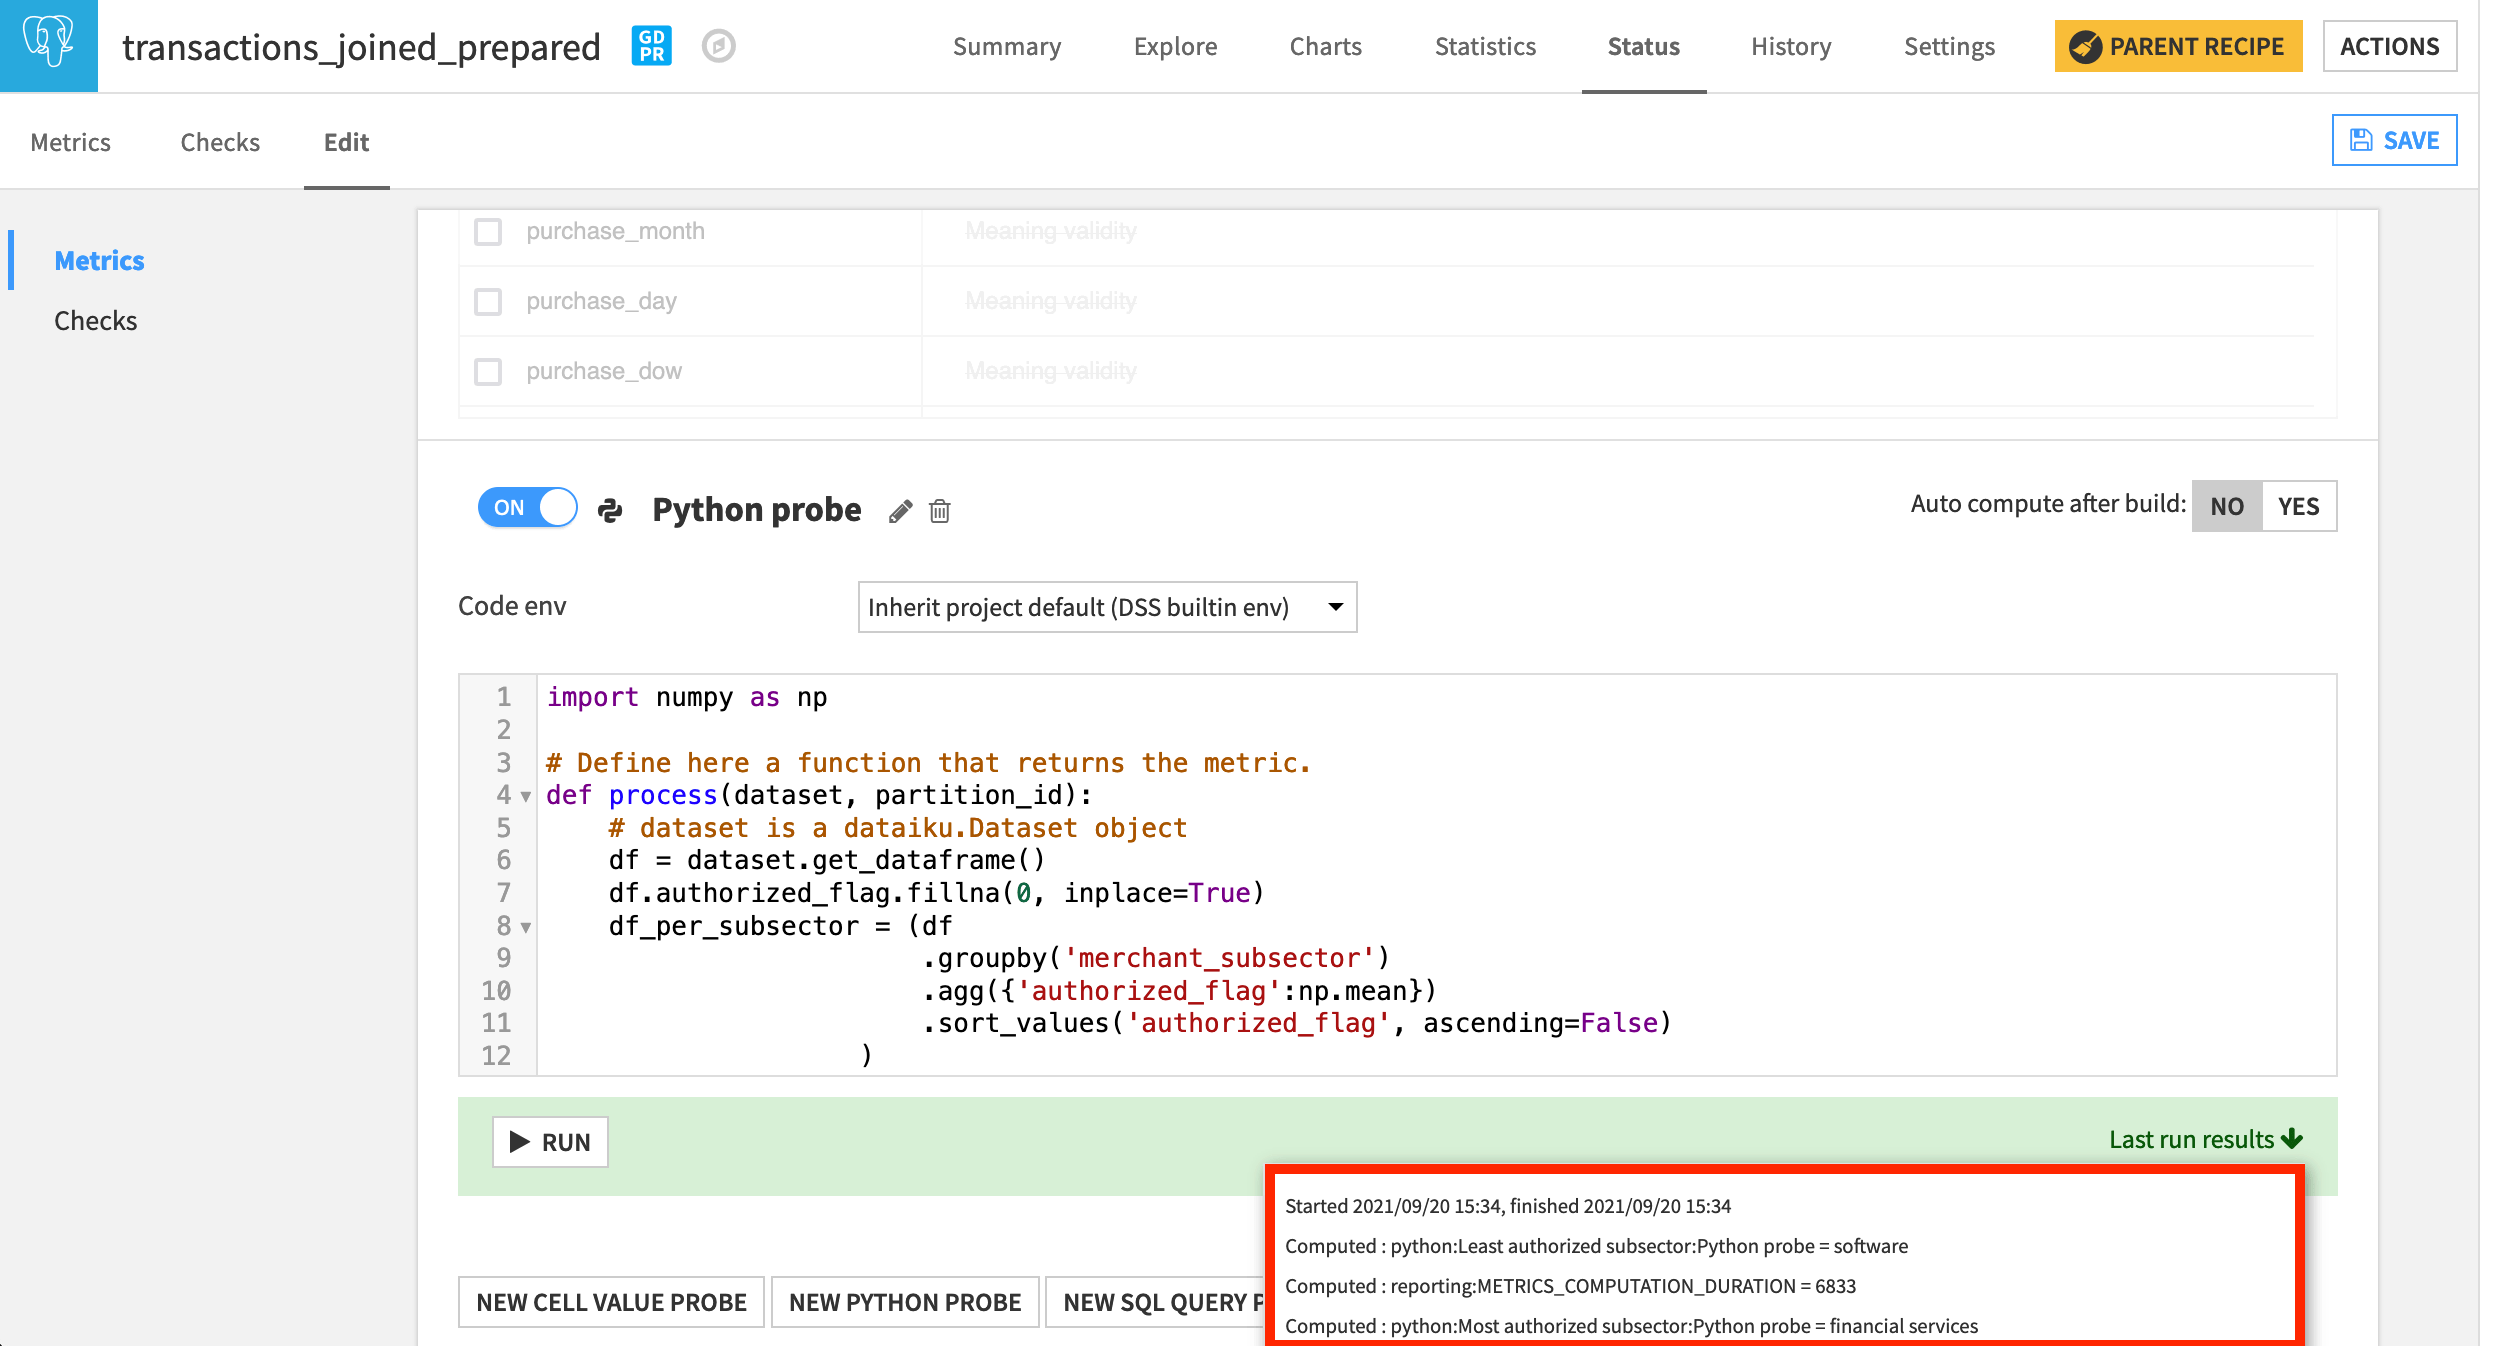
For example, we may want a metric to track the most and least authorized merchant subsectors. Let’s achieve this with a Python probe.
In the Status tab of the transactions_joined_prepared dataset, navigate to the Edit subtab.
At the bottom of the Metrics panel, create a New Python Probe.
Turn it on, and replace the starter code with the following snippet.
Note
In this tutorial, we’ll just copy and paste code snippets for the purposes of demonstration, but in a real situation, you’d want to test it interactively in a code notebook.
import numpy as np

# Define here a function that returns the metric.
def process(dataset, partition_id):
    # dataset is a dataiku.Dataset object
    df = dataset.get_dataframe()
    df.authorized_flag.fillna(0, inplace=True)
    df_per_subsector = (df
                        .groupby('merchant_subsector')
                        .agg({'authorized_flag':np.mean})
                        .sort_values('authorized_flag', ascending=False)
                    )

    most_authorized_subsector = df_per_subsector.index[0]
    least_authorized_subsector = df_per_subsector.index[-1]
    return {'Most authorized subsector' : most_authorized_subsector,
            'Least authorized subsector' : least_authorized_subsector}
Run the probe. The most authorized subsector should be “financial services”, and the least should be “software”.
Create a Custom Check
The same kind of flexibility code brings to custom metrics can also be brought to custom checks.
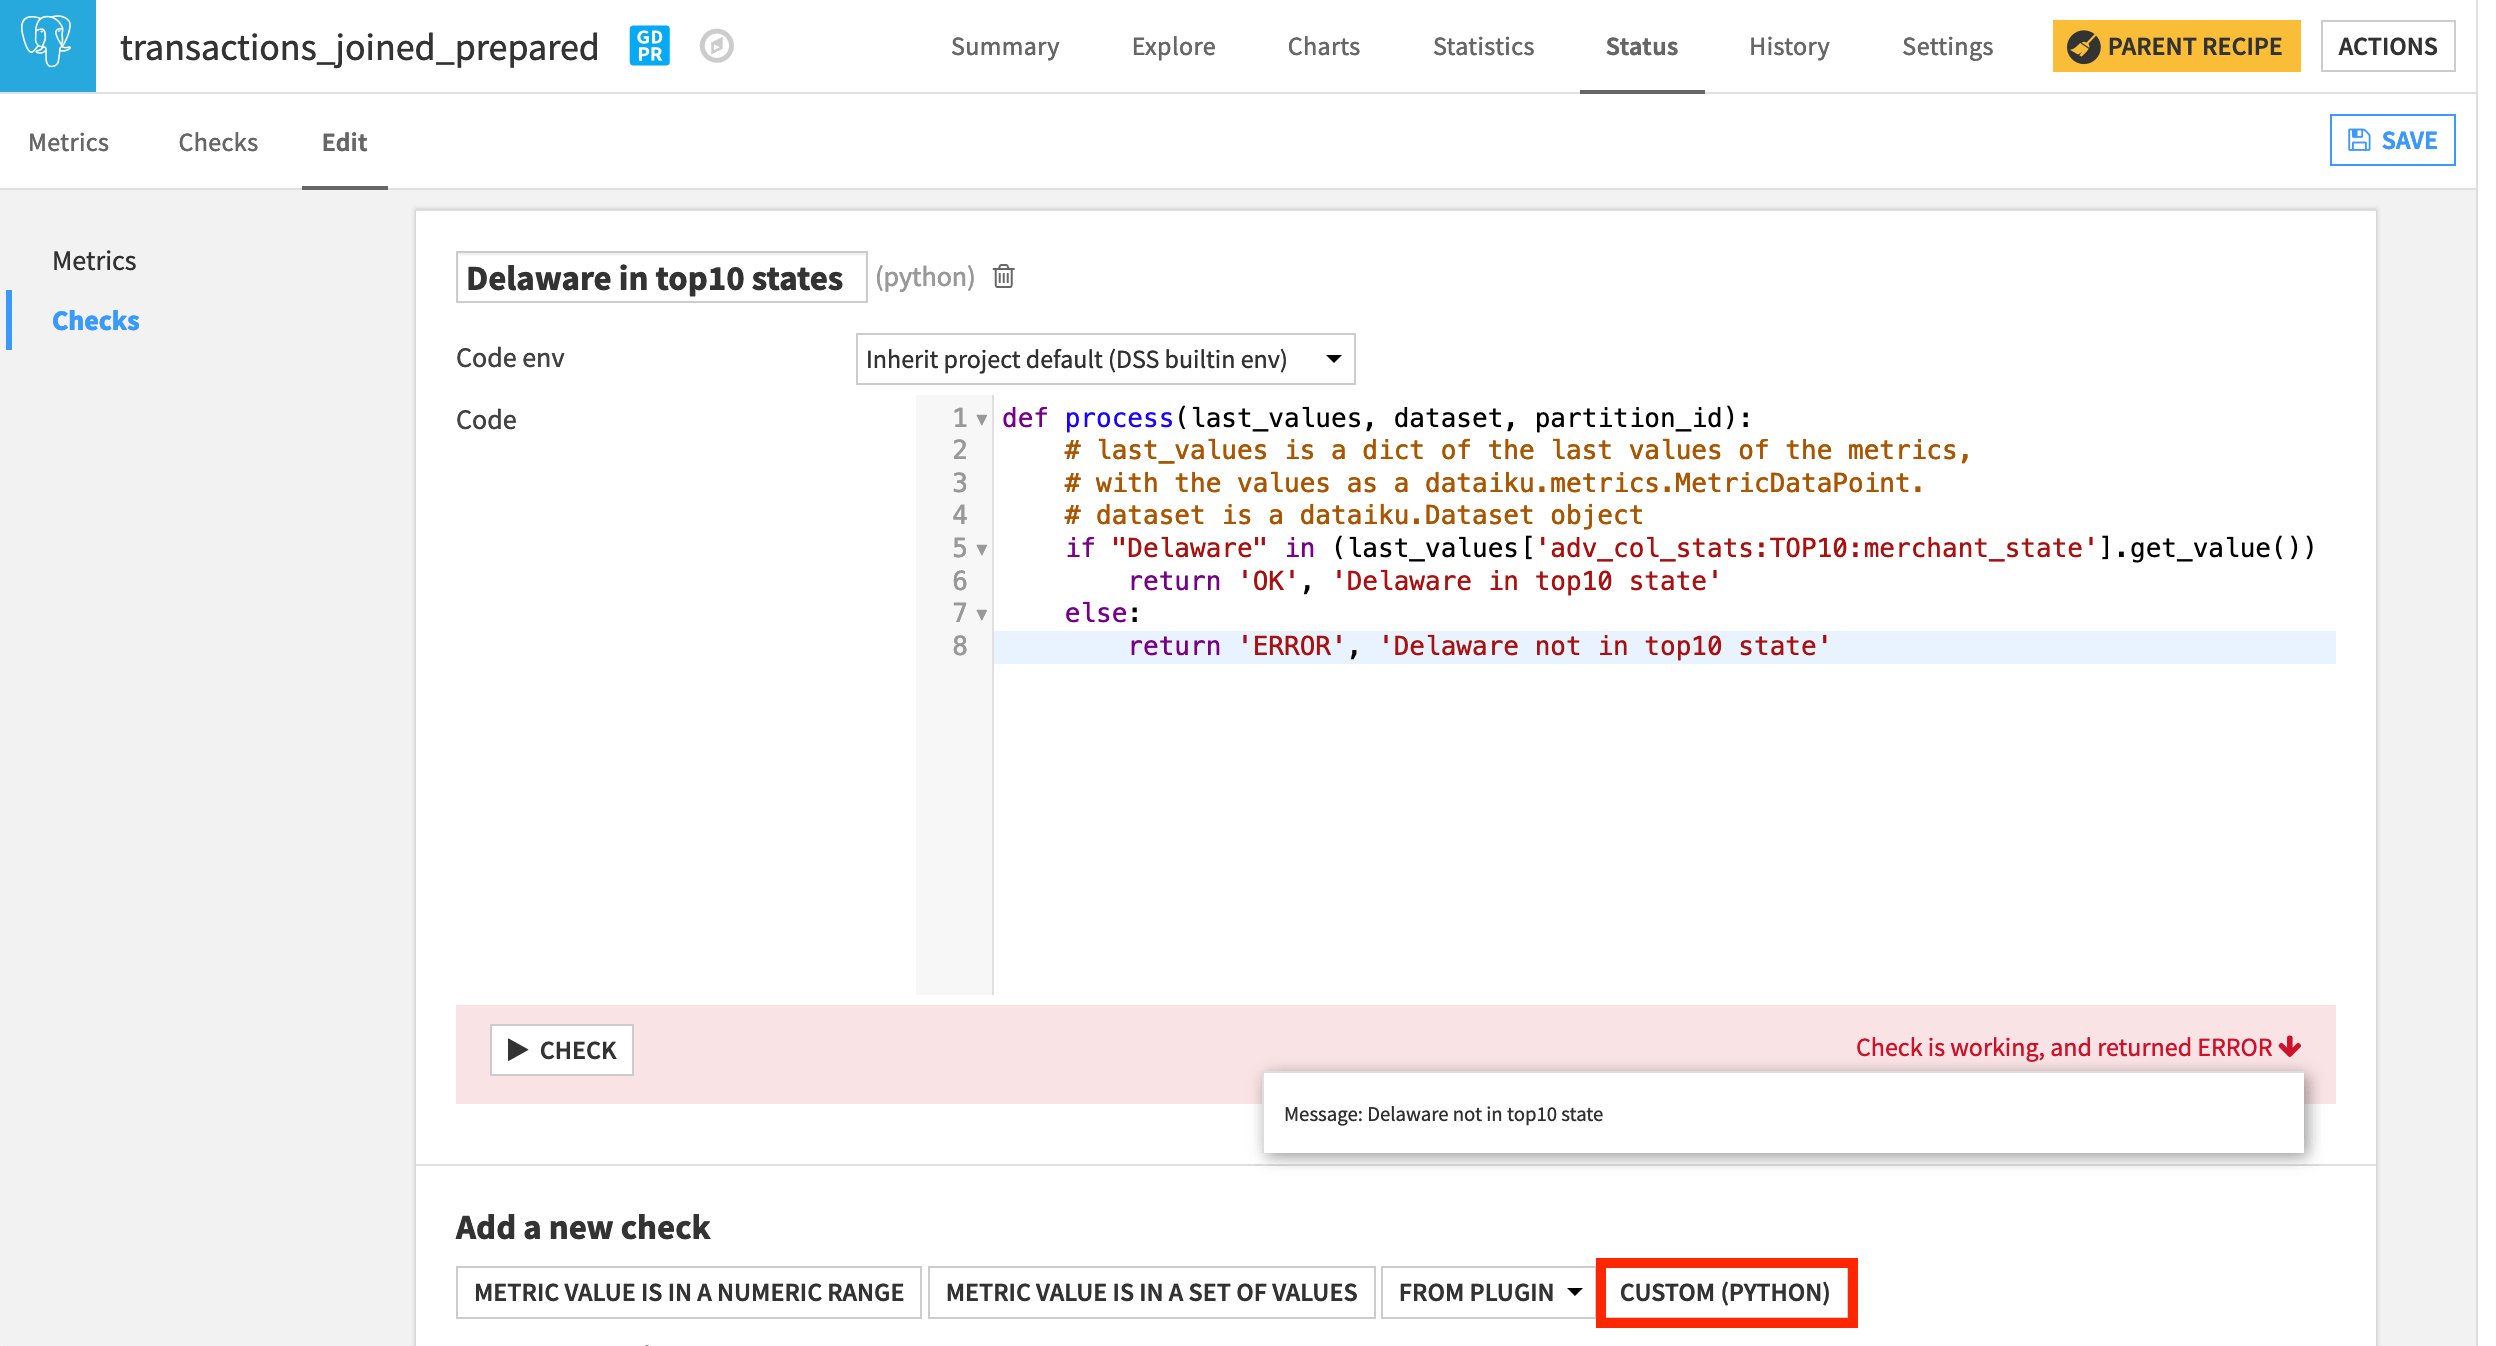
In another section, we added a metric to report the top ten most frequent states found in the data. We can use this built-in metric in a custom check to verify if a specific state is in that group.
Navigate from the Metrics panel to the Checks panel of the Edit subtab.
At the bottom of the screen, choose a new Custom (Python) check.
Name it
Delaware in top10 states.Replace the starter code with the following snippet.
def process(last_values, dataset, partition_id):
    # last_values is a dict of the last values of the metrics,
    # with the values as a dataiku.metrics.MetricDataPoint.
    # dataset is a dataiku.Dataset object
    if "Delaware" in (last_values['adv_col_stats:TOP10:merchant_state'].get_value()) :
        return 'OK', 'Delaware in top10 state'
    else:
        return 'ERROR', 'Delaware not in top10 state'
Running the check should return an error. Using the Analyze tool in the Explore tab, we could verify this to be true.
Create a Custom Scenario
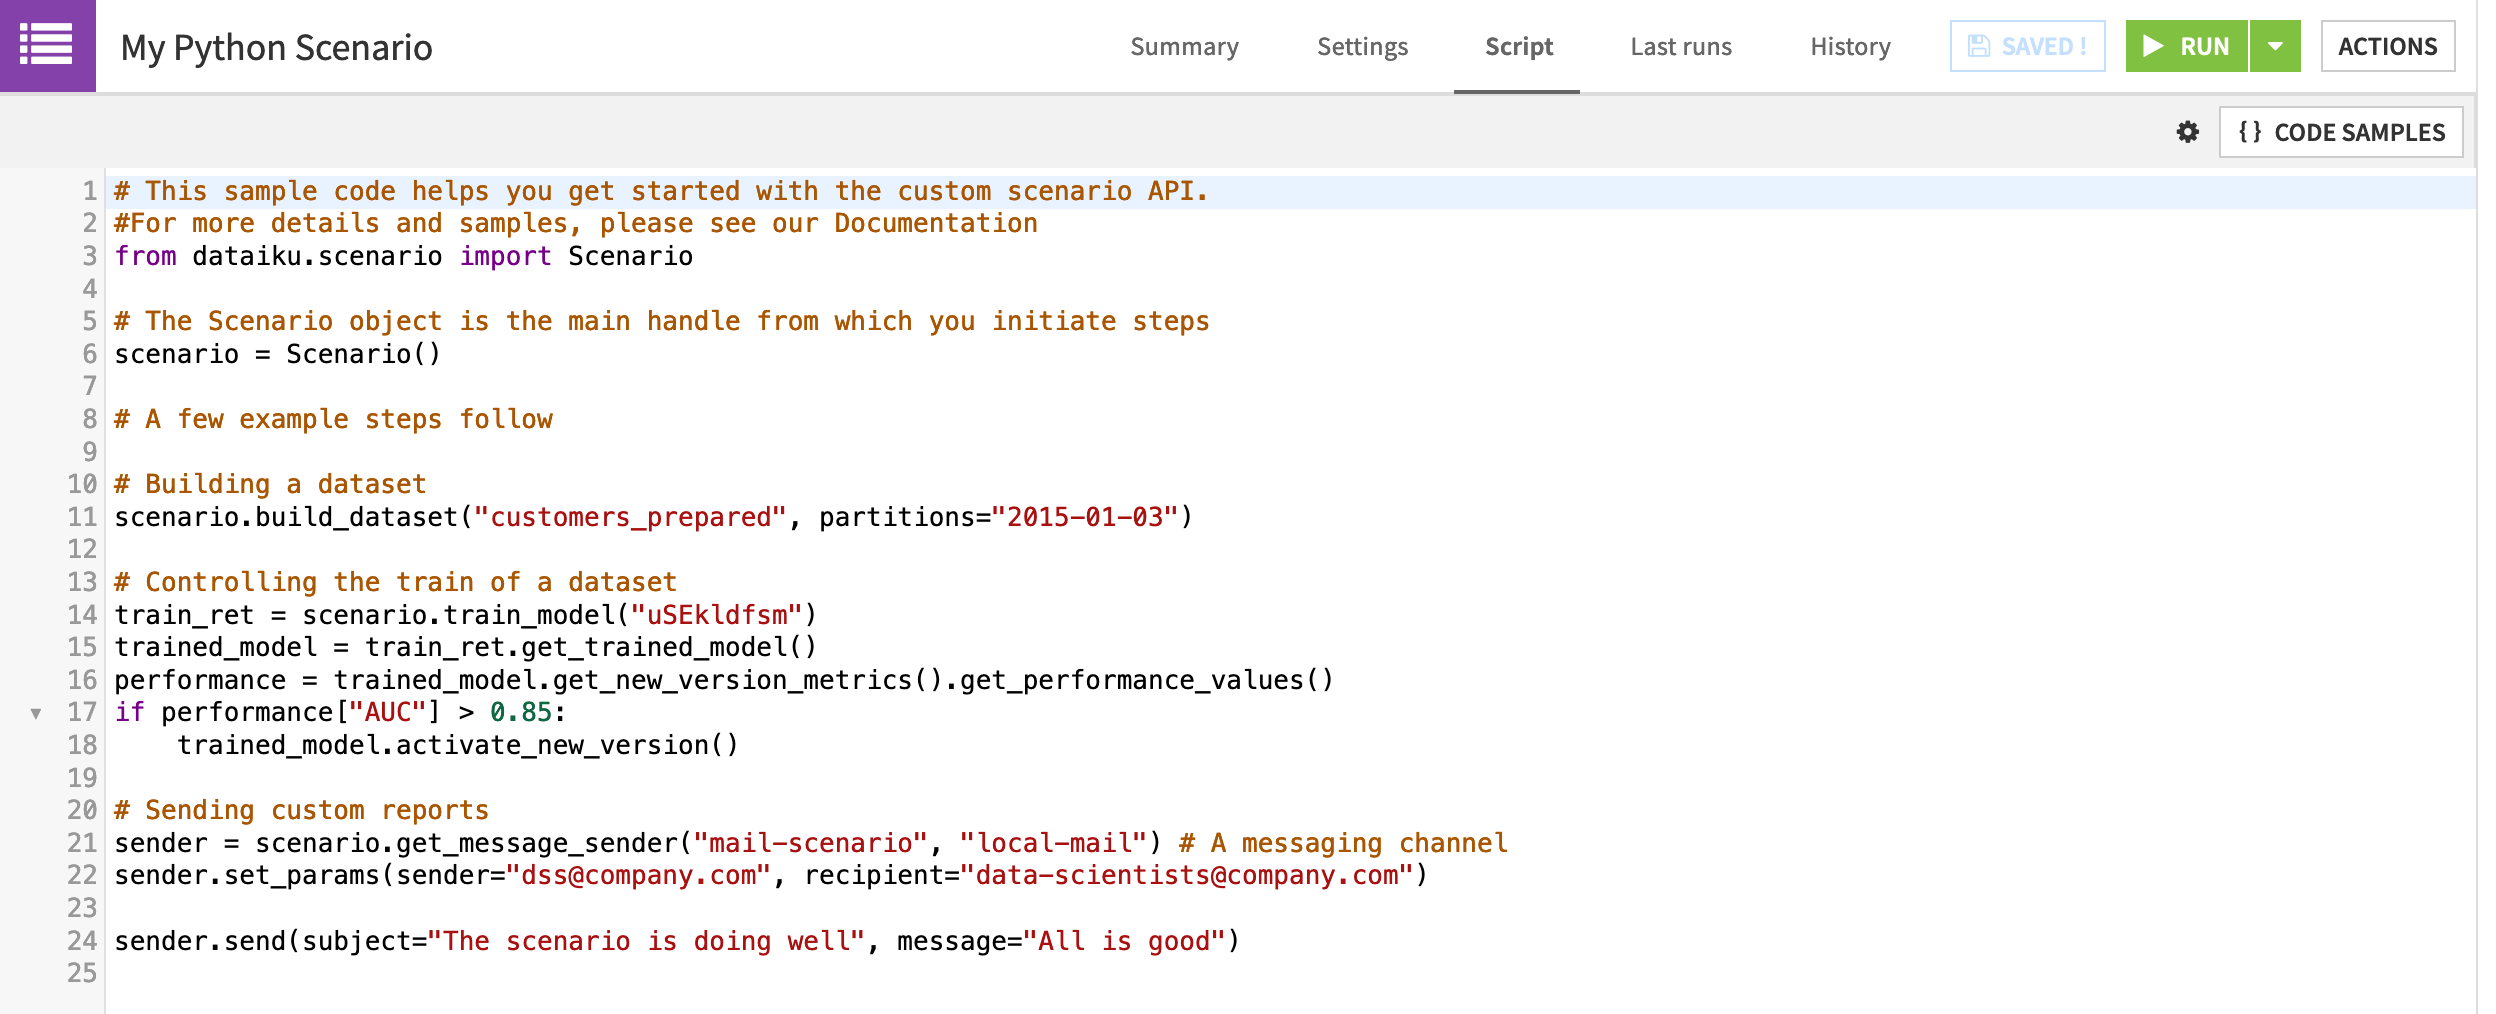
In Dataiku DSS, we can introduce custom code to a scenario in two ways. We can create a custom Python scenario where a Python Script tab with starter code replaces the usual Steps tab.
Alternatively, we can add custom steps (SQL, Python, plugin) to a standard step-based scenario. We’ll focus on this option.
Create a new step-based scenario.
Name it
My Custom Scenario.
Create a Custom Trigger
Dataiku DSS provides a large amount of flexibility with built-in triggers. For example, just in terms of time-based triggers, we can trigger a scenario once every few minutes, once per day, once per month, or on specific days of the week.
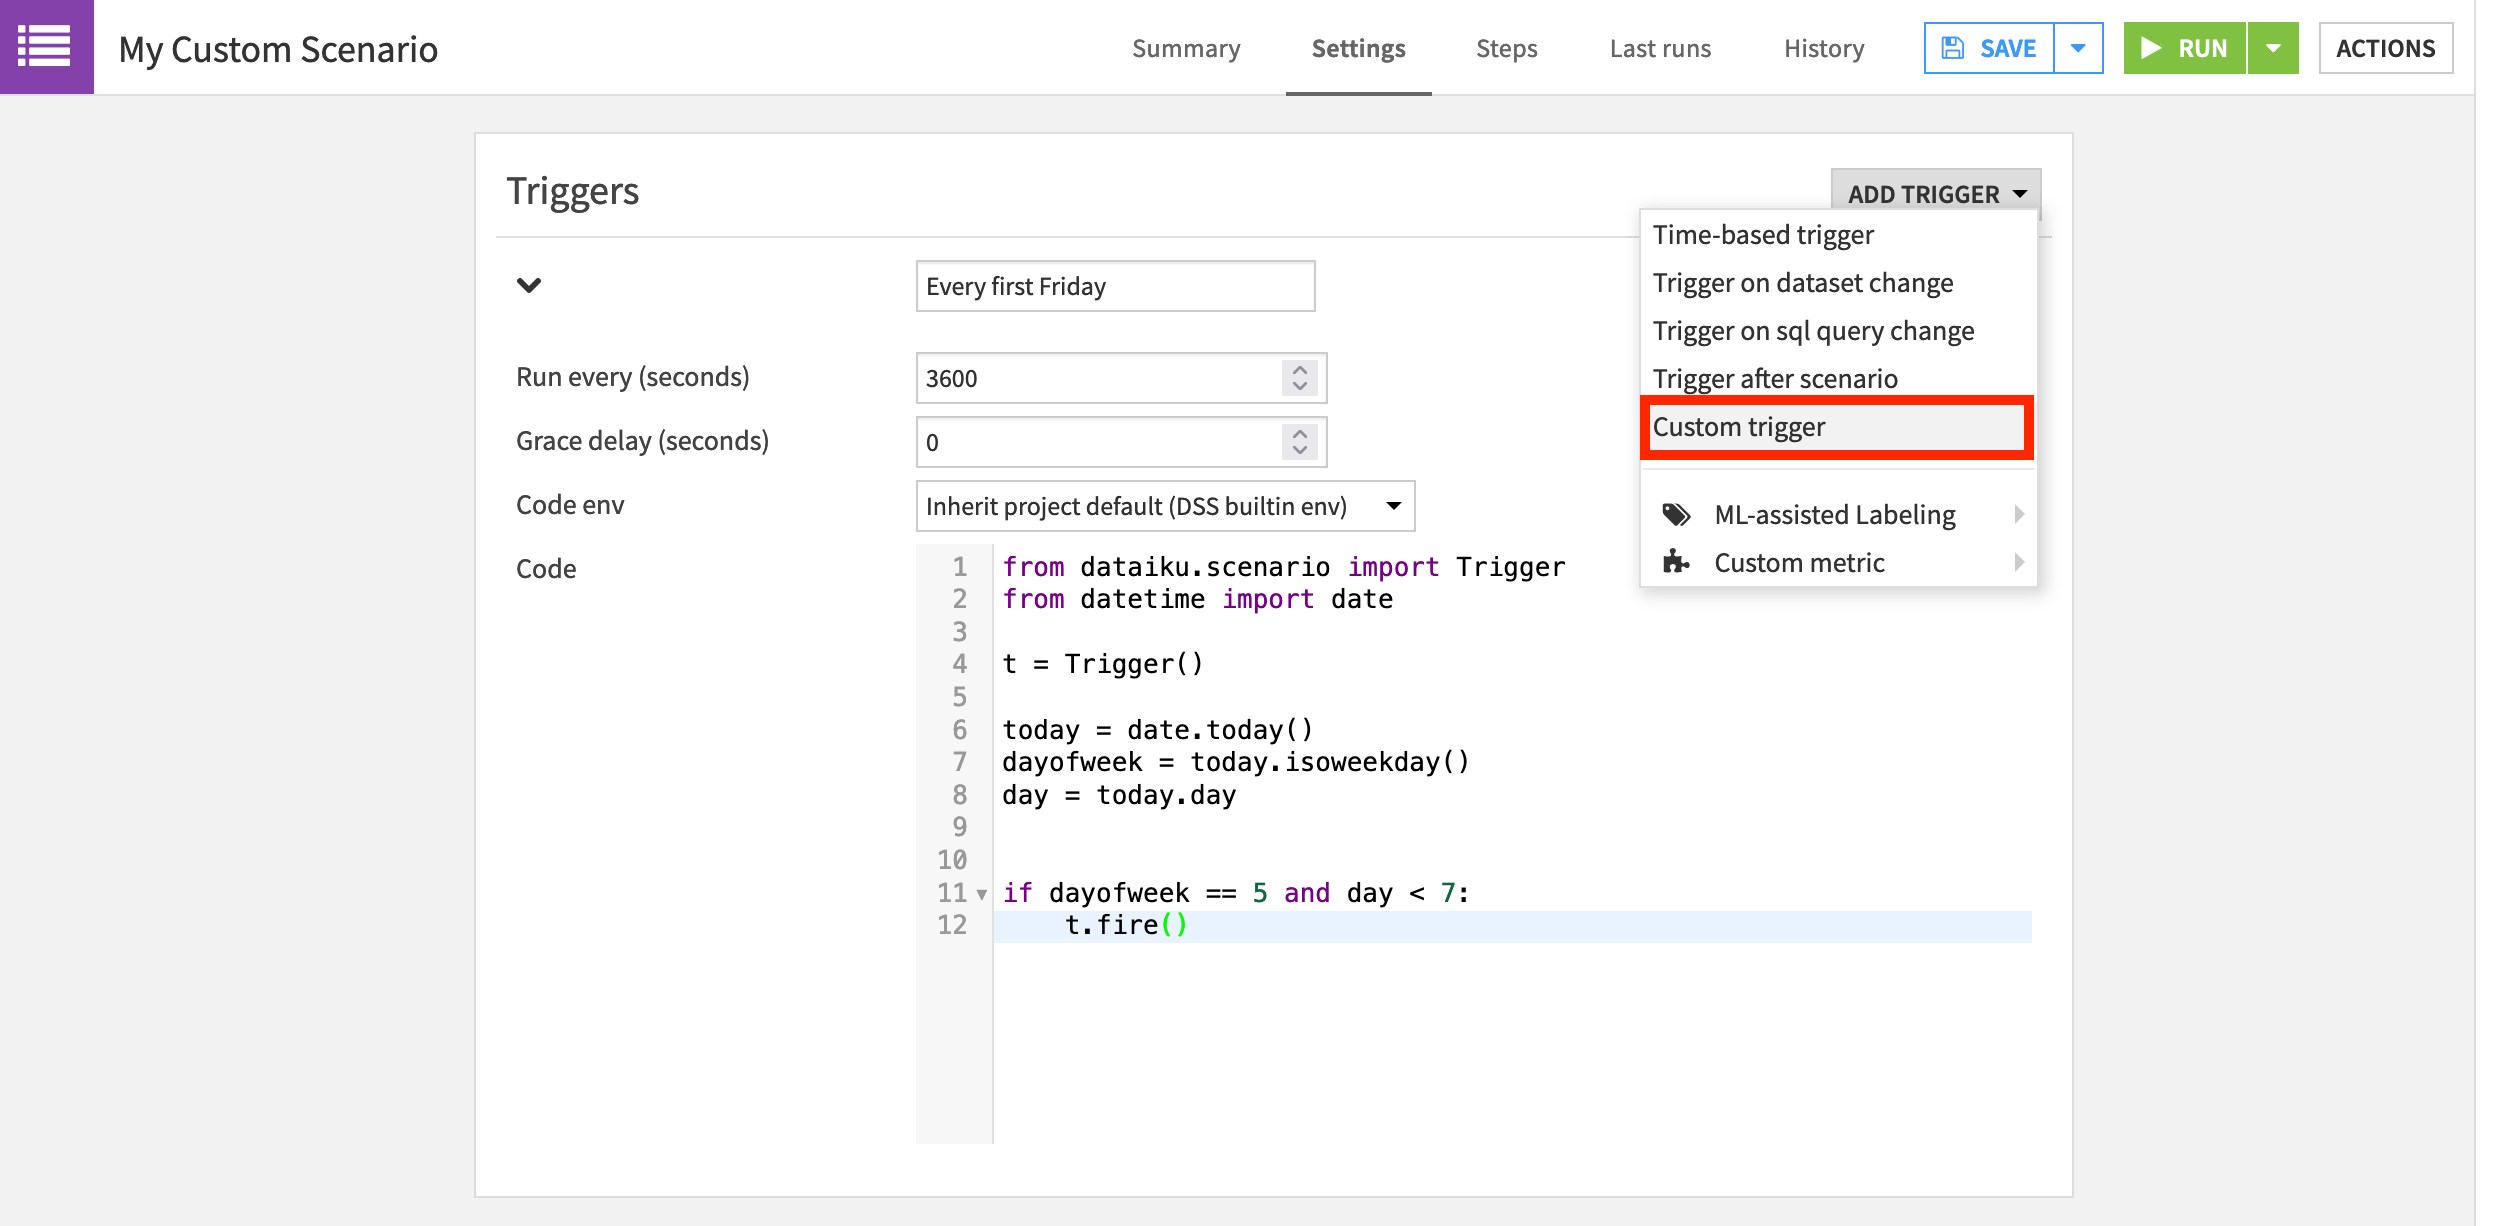
However, if we wanted to launch a scenario on only the first Friday of the month, we’d need to code our own solution. Let’s do this with a custom Python trigger.
Custom Triggers for Dataiku Online Users
Tip
Dataiku Online users will need to skip this step. Orbit subscribers can use any time-based trigger, and free trial users can trigger the scenario manually.
On the Settings tab of the newly-created scenario, add a “Custom trigger” from the Add Trigger dropdown.
Name it
Every first Friday.Normally, we’d increase the “Run every (seconds)” parameter, but we can leave the default for demonstration purposes.
We won’t need any special libraries so the default built-in code environment can remain.
Replace the starter code with the following Python code snippet.
from dataiku.scenario import Trigger
from datetime import date

t = Trigger()

today = date.today()
dayofweek = today.isoweekday()
day = today.day


if dayofweek == 5 and day < 7:
    t.fire()
Add Custom Steps to a Scenario
What actions should we instruct Dataiku DSS to take on the first Friday of every month? Earlier we rebuilt part of the Flow by hard coding a variable change in a scenario step. Now let’s rebuild the same part of the Flow, but change the variable based on the result of a custom step.
These steps will differ depending on the type of storage connection you are using. If you’re using SQL datasets, you’ll use an “Execute SQL” step. If you’re using file-based datasets, you’ll use an “Execute Python” step.
SQL-based step
If you’re using a SQL-based connection, we’ll start with a SQL query step to find the most transactions.
On the Steps tab, add an “Execute SQL” step.
Name it
top_merchant_state.Choose the connection you’re using.
Copy and paste the SQL query below.
SELECT
    COUNT(*) AS "state_transactions",
    "merchant_state"
FROM "${projectKey}_transactions_joined_prepared"
WHERE "merchant_state" IS NOT NULL
GROUP BY "merchant_state"
ORDER BY "state_transactions" DESC
LIMIT 1
Now we’ll use the result of this SQL query step to update a project variable.
Add a “Set project variables” step.
Turn Evaluated variables ON.
Add a variable:
The key is
state_name.The value is
parseJson(stepOutput_top_merchant_state)['rows'][0][1].
File-based Step
If you are using a file-based connection, you won’t be able to use an “Execute SQL” step like the example above. Instead, you can combine both the SQL query step and the “Set project variables” step into one custom Python step.
On the Steps tab, add an “Execute Python code” step.
Copy and paste the code snippet below into the script field.
import dataiku
from dataiku.scenario import Scenario

# Defining scenario object
s = Scenario()

# Defining python client for public API
client = dataiku.api_client()
p = client.get_default_project()

# Computing state with most transactions
dataset = dataiku.Dataset("transactions_joined_prepared")
df = dataset.get_dataframe()
state_name = (df
            .groupby("merchant_state")
            .agg({"transaction_id": "count"})
            .sort_values('transaction_id', ascending=False)
            .index[0]
            )

# Set variable
variables = p.get_variables()
variables["standard"]["state_name"] = state_name

p.set_variables(variables)
Clear and Build Datasets
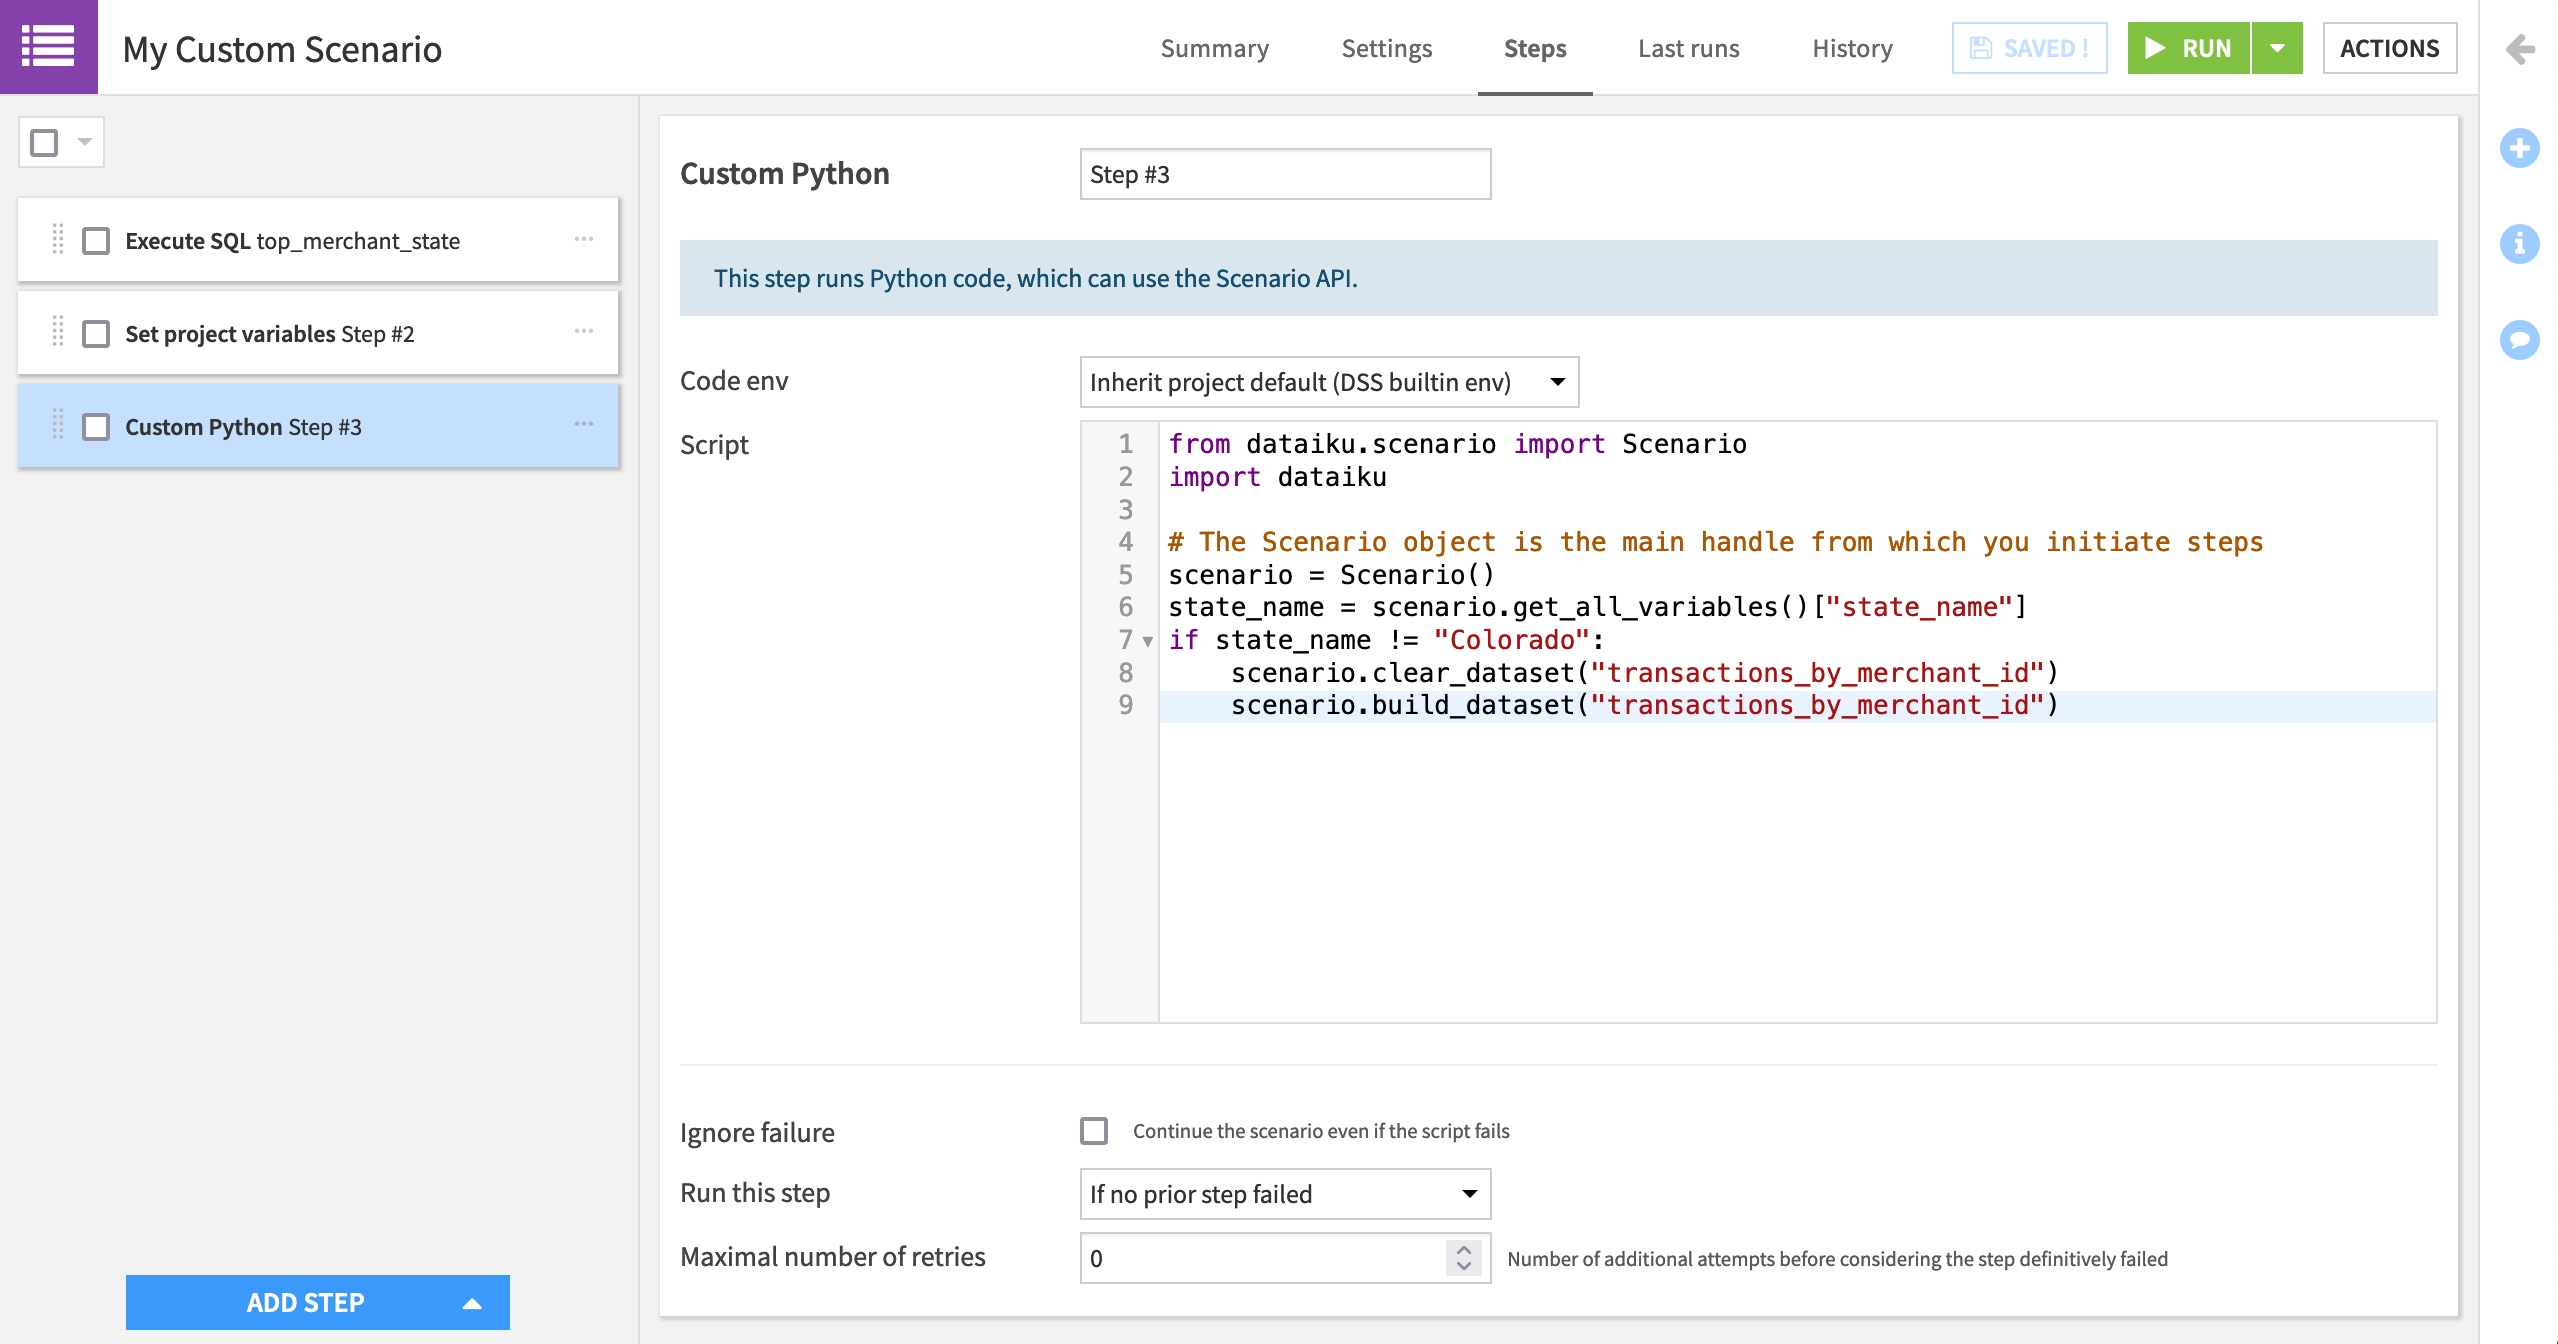
Once that variable is updated (either through a SQL query + “Set project variables” step or one Python step), we can clear and build just like we did in the previous scenario. Instead of using the built-in steps, however, let’s use a Python step.
For example, instead of a “Clear” step, we can use the clear_dataset() function. Instead of a “Build / Train” step, we can use the build_dataset() function.
Add an “Execute Python code” step.
Copy and paste the code snippet below into the script field.
from dataiku.scenario import Scenario
import dataiku

# The Scenario object is the main handle from which you initiate steps
scenario = Scenario()
state_name = scenario.get_all_variables()["state_name"]
if state_name != "Colorado":
    scenario.clear_dataset("transactions_by_merchant_id")
    scenario.build_dataset("transactions_by_merchant_id")
Running this scenario, even though it has custom steps and triggers, is no different from a fully built-in scenario.
Instead of waiting for the first Friday of a month, manually trigger the scenario by clicking Run.
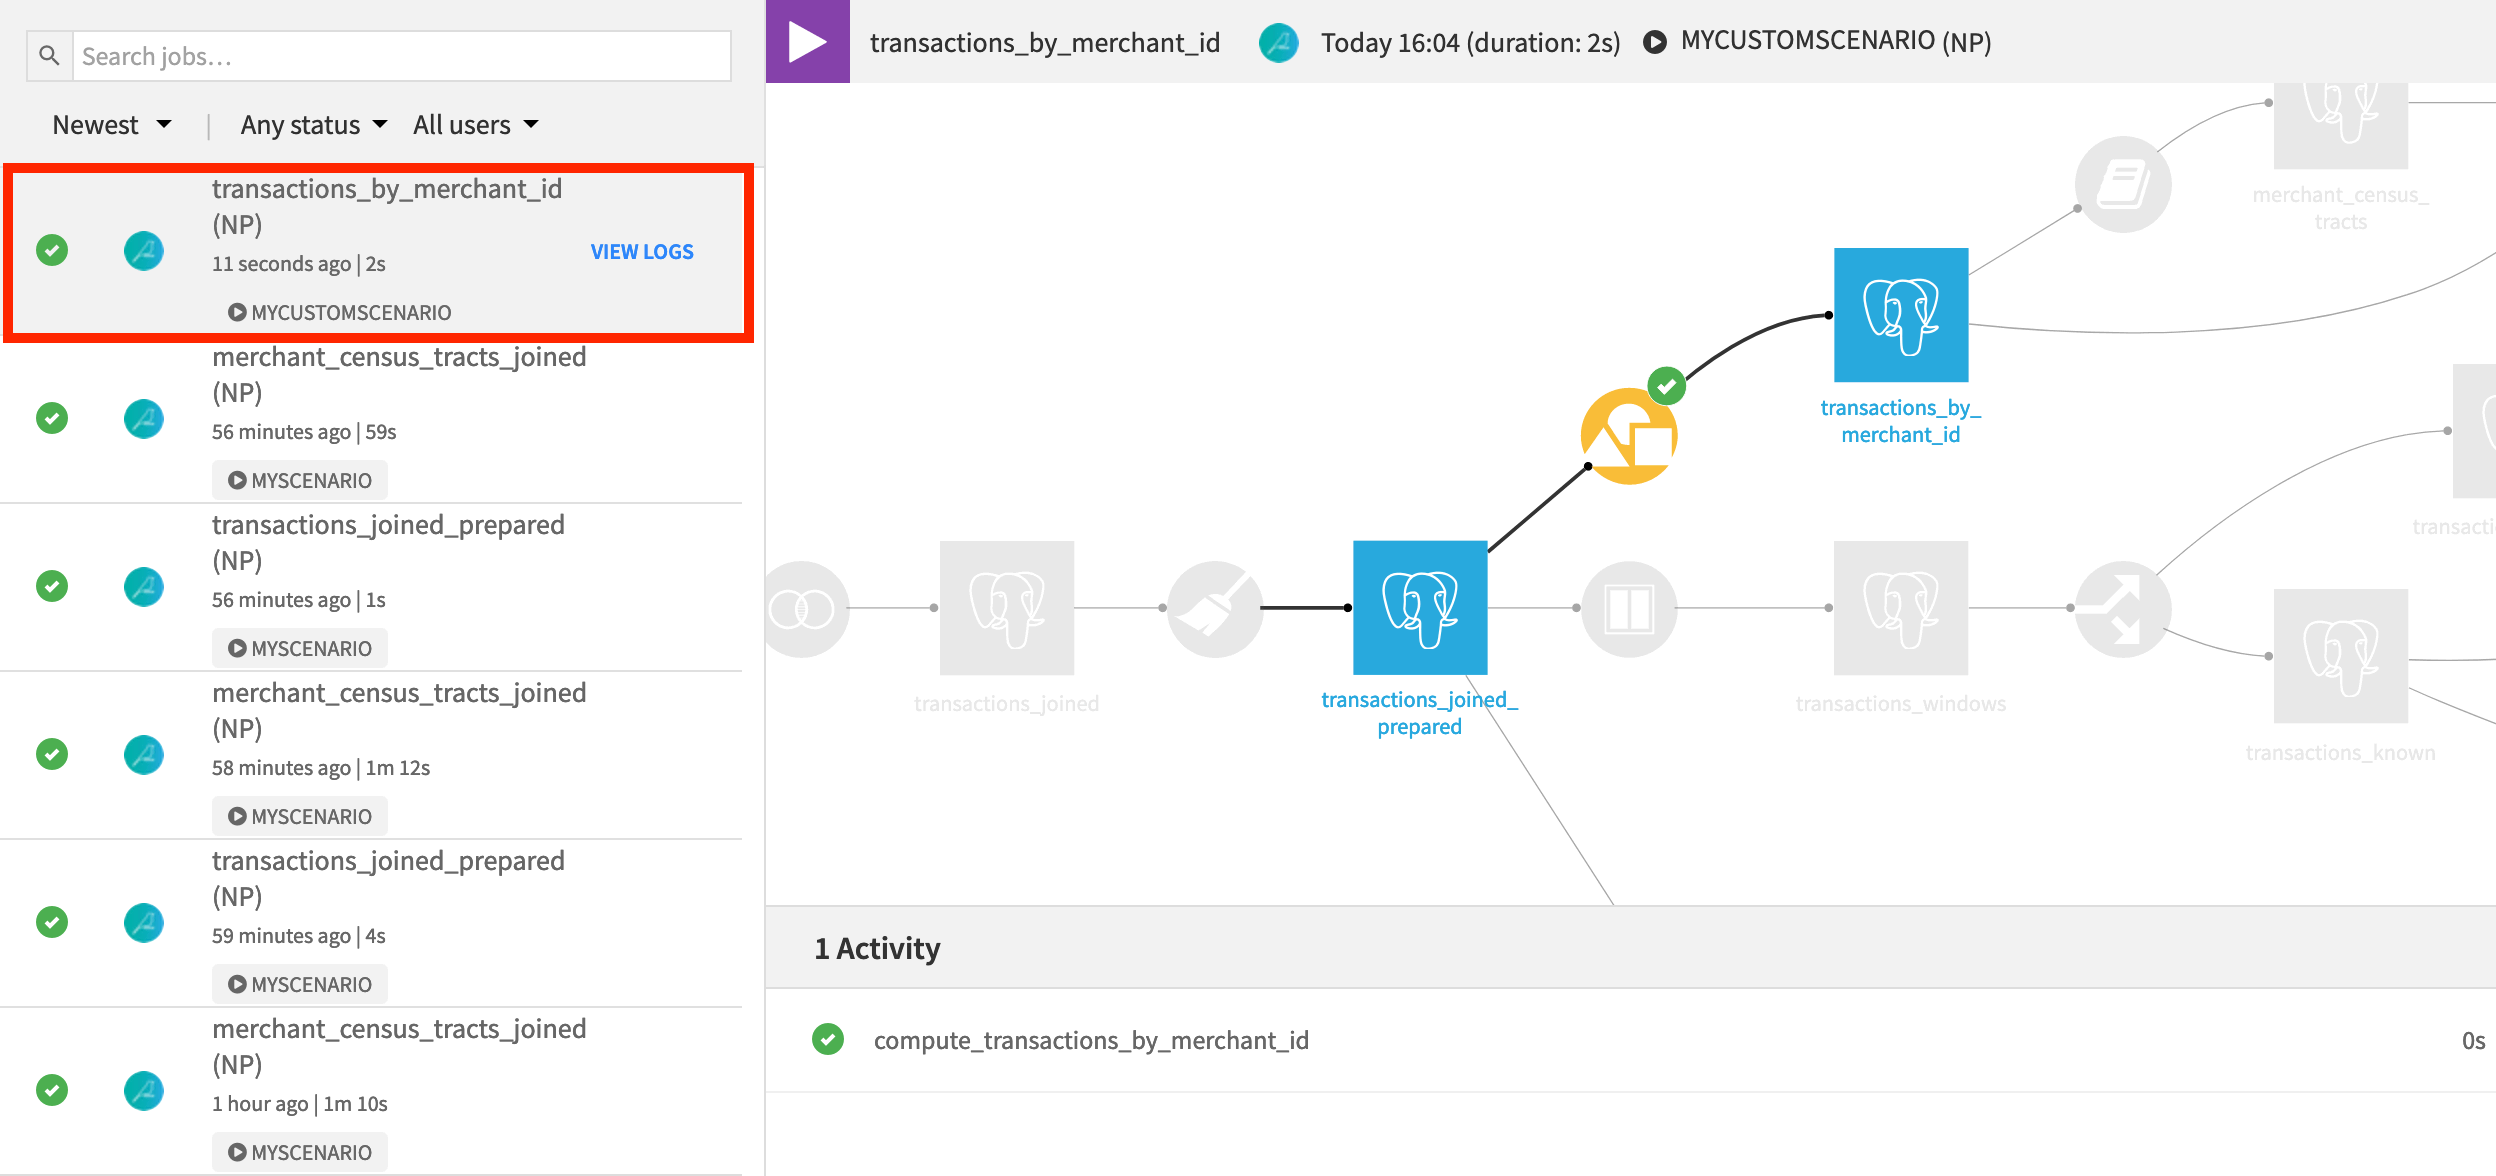
When the scenario finishes, open the transactions_by_merchant_id dataset to observe the change in output. It turns out that “Colorado” is the state with the most transactions.
What’s Next?
Congratulations on taking your first steps using metrics, checks, and scenarios in Dataiku DSS!
If you have not already done so, register for the Academy course on Automation to validate your knowledge of this material.
For more information on these topics, consult the product documentation.
Once you have become familiar with automating workflows, you may be ready to begin putting pipelines into production. Among other courses in the Operationalization section, the course on Flow Deployment will teach you how to take a Flow like this one and deploy it to a production environment.