Analyze and Understand Your Model with TensorBoard
The Deep Learning on images plugin includes a webapp component, Tensorboard (v2), for monitoring the retraining of deep learning models.
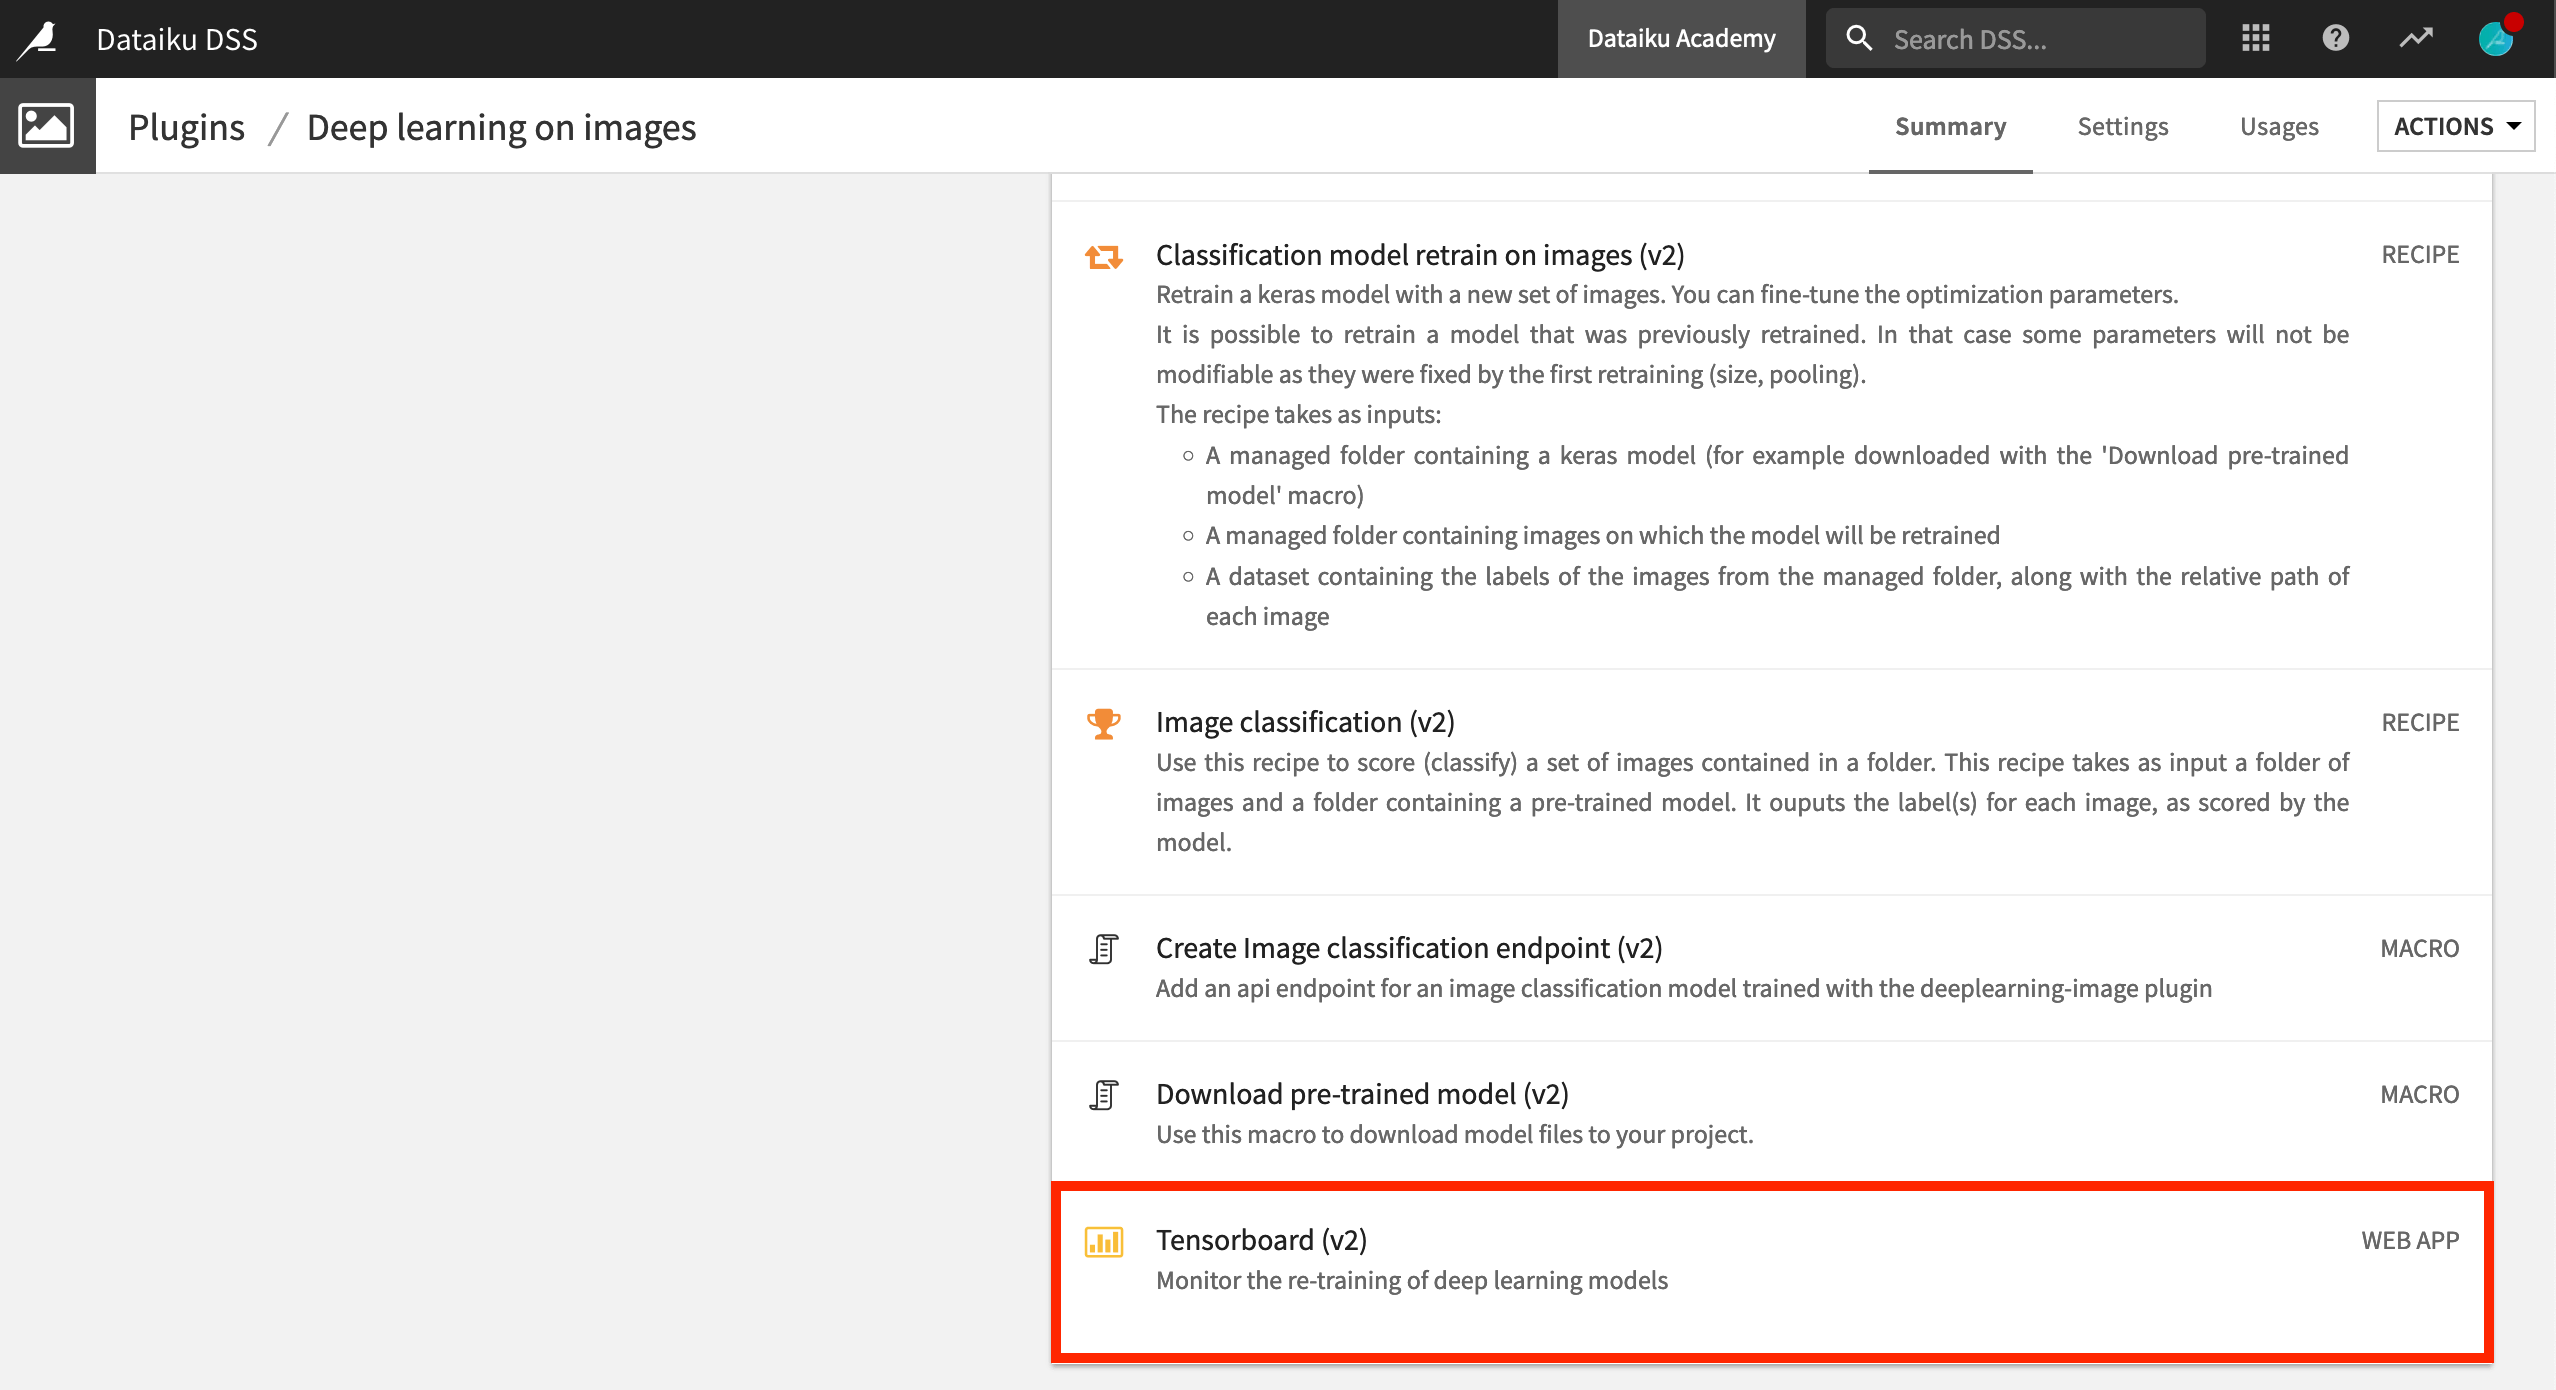
While re-training your model, you can use TensorBoard to view the performance of your model in real time, across epochs, along with the model’s architecture. The goal is to understand the architecture of your model and check the evolution of the most useful metrics over epochs, like the loss, and the Area Under the Curve (AUC).
Note
One epoch is equal to one complete pass of the entire training dataset by the model.
Create the Webapp
Let’s create the webapp.
Note
If you have difficulty with this step, return to the recipe that retrained the model and ensure the checkbox for “Use TensorBoard” was selected.
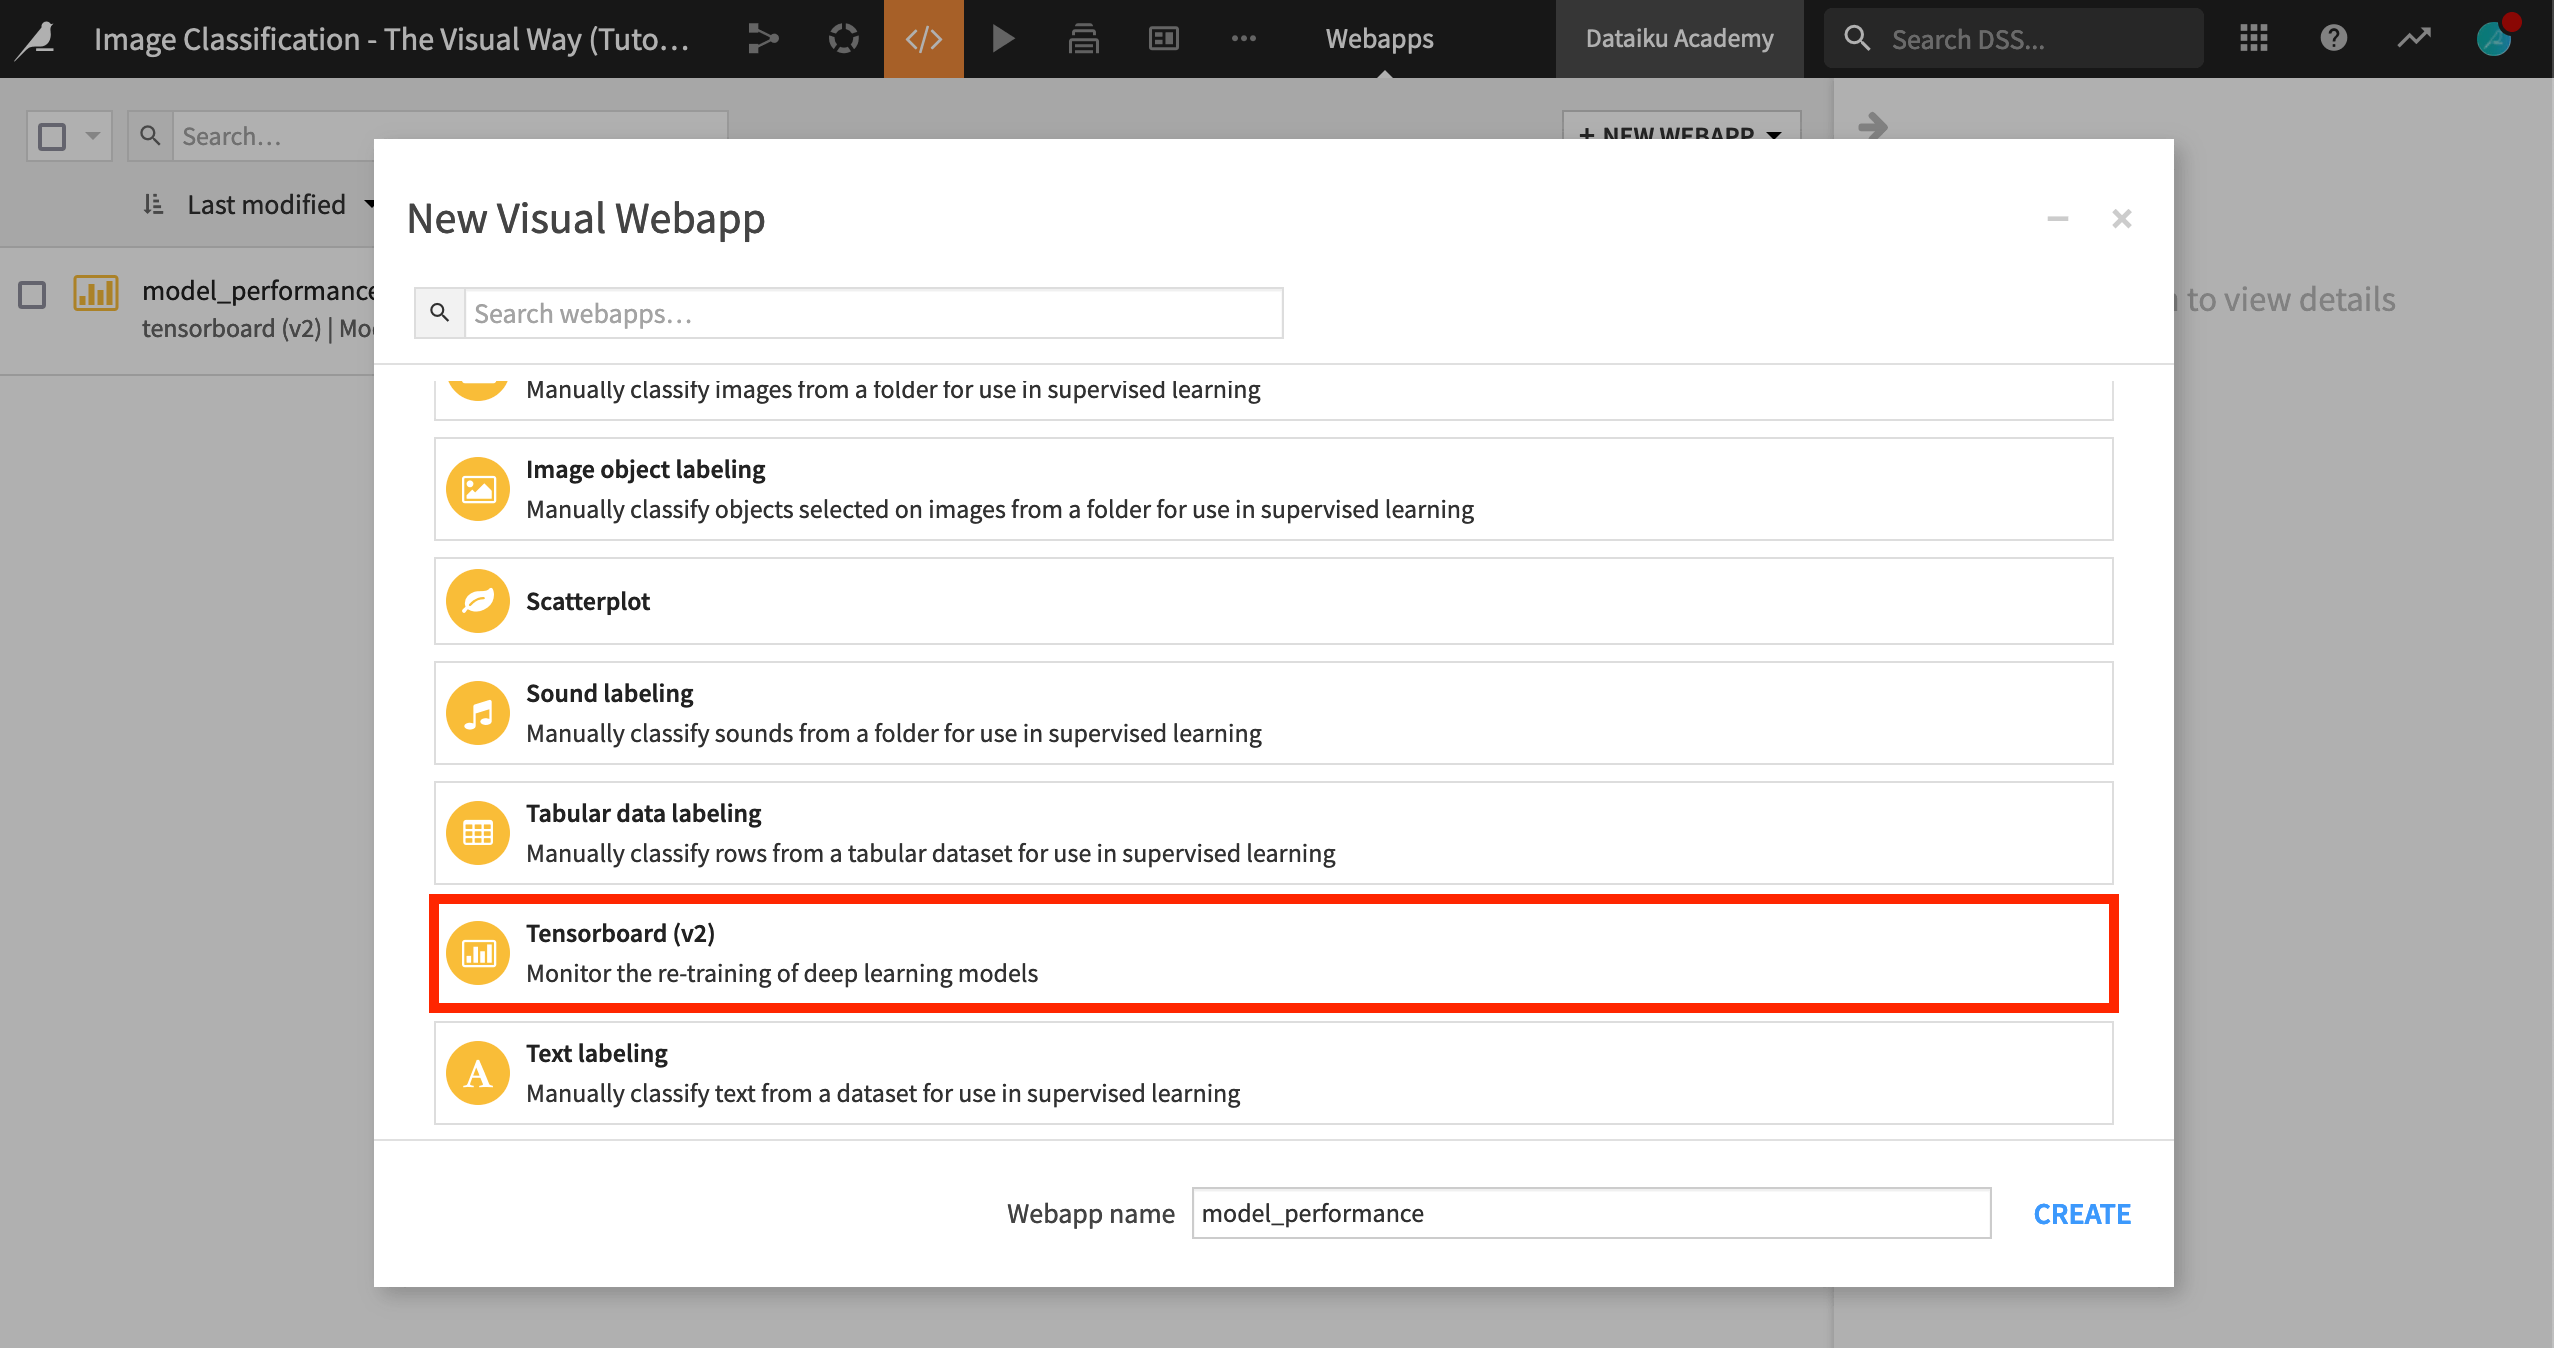
From the Code menu of the top navigation bar, select Webapps > + New Webapp > Visual Webapp > Tensorboard (v2).
Name the webapp
model_performance, and click Create.
Configure the Webapp
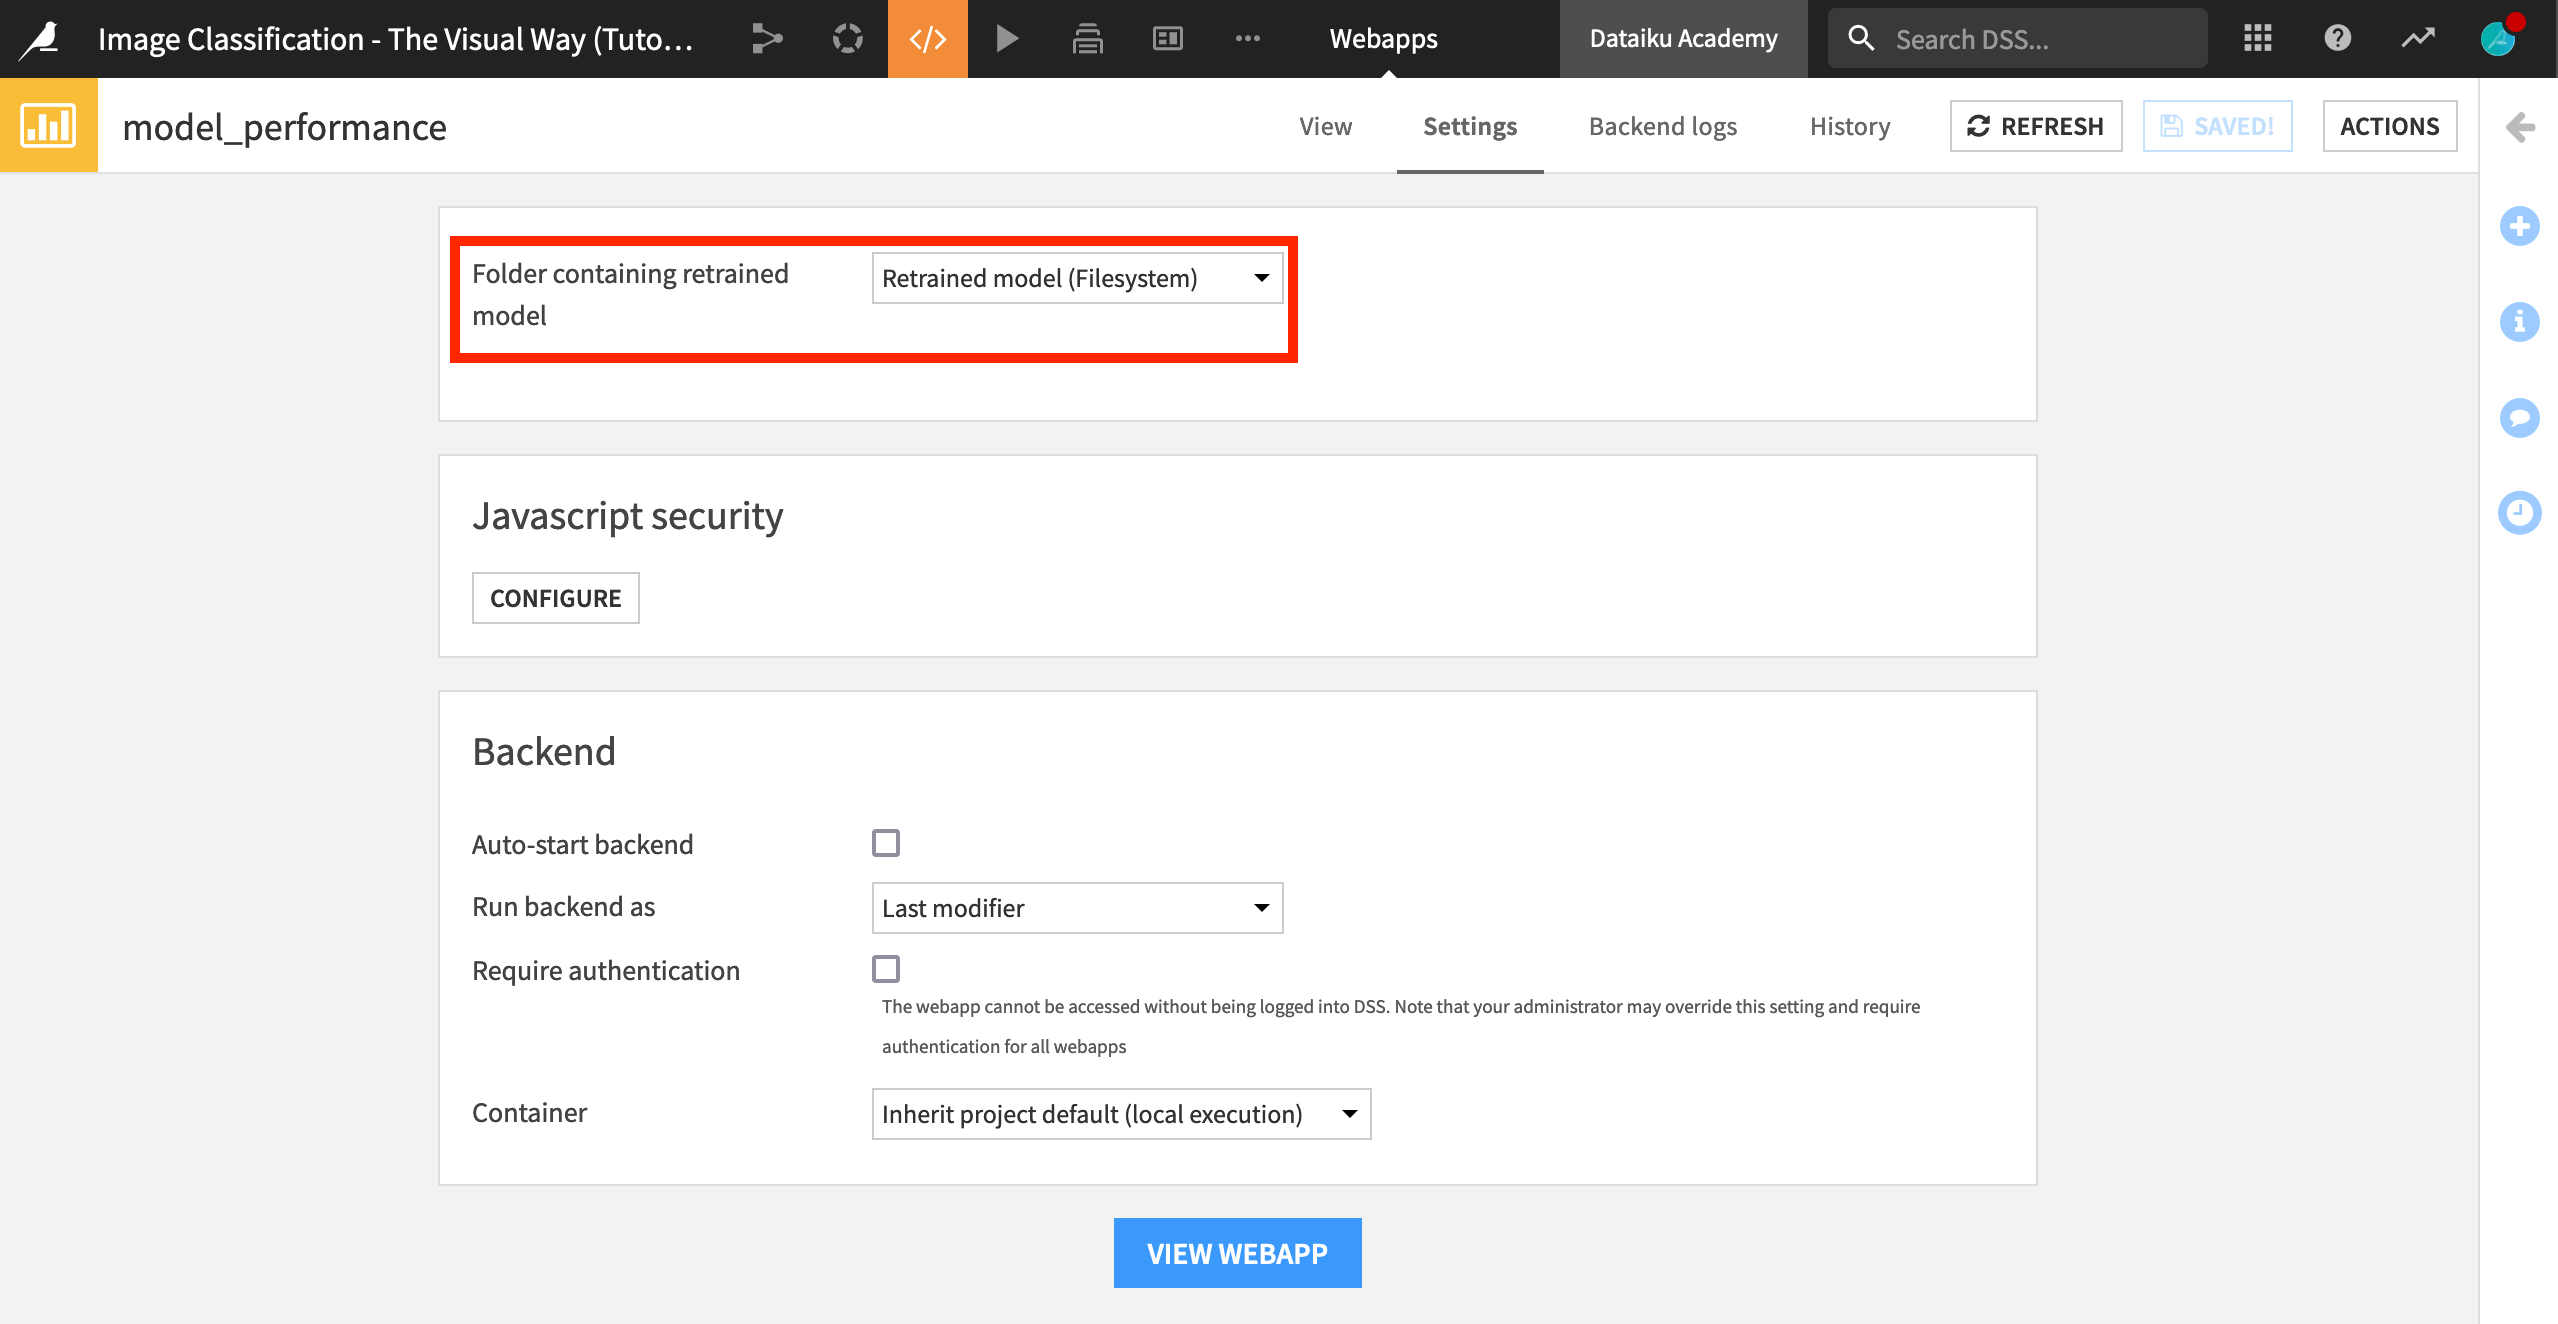
Dataiku lets you know the webapp requires a backend and that it is not running.
On the Settings tab of the webapp, choose Retrained model as the “Folder containing retrained model”.
Then click Save and View Webapp.
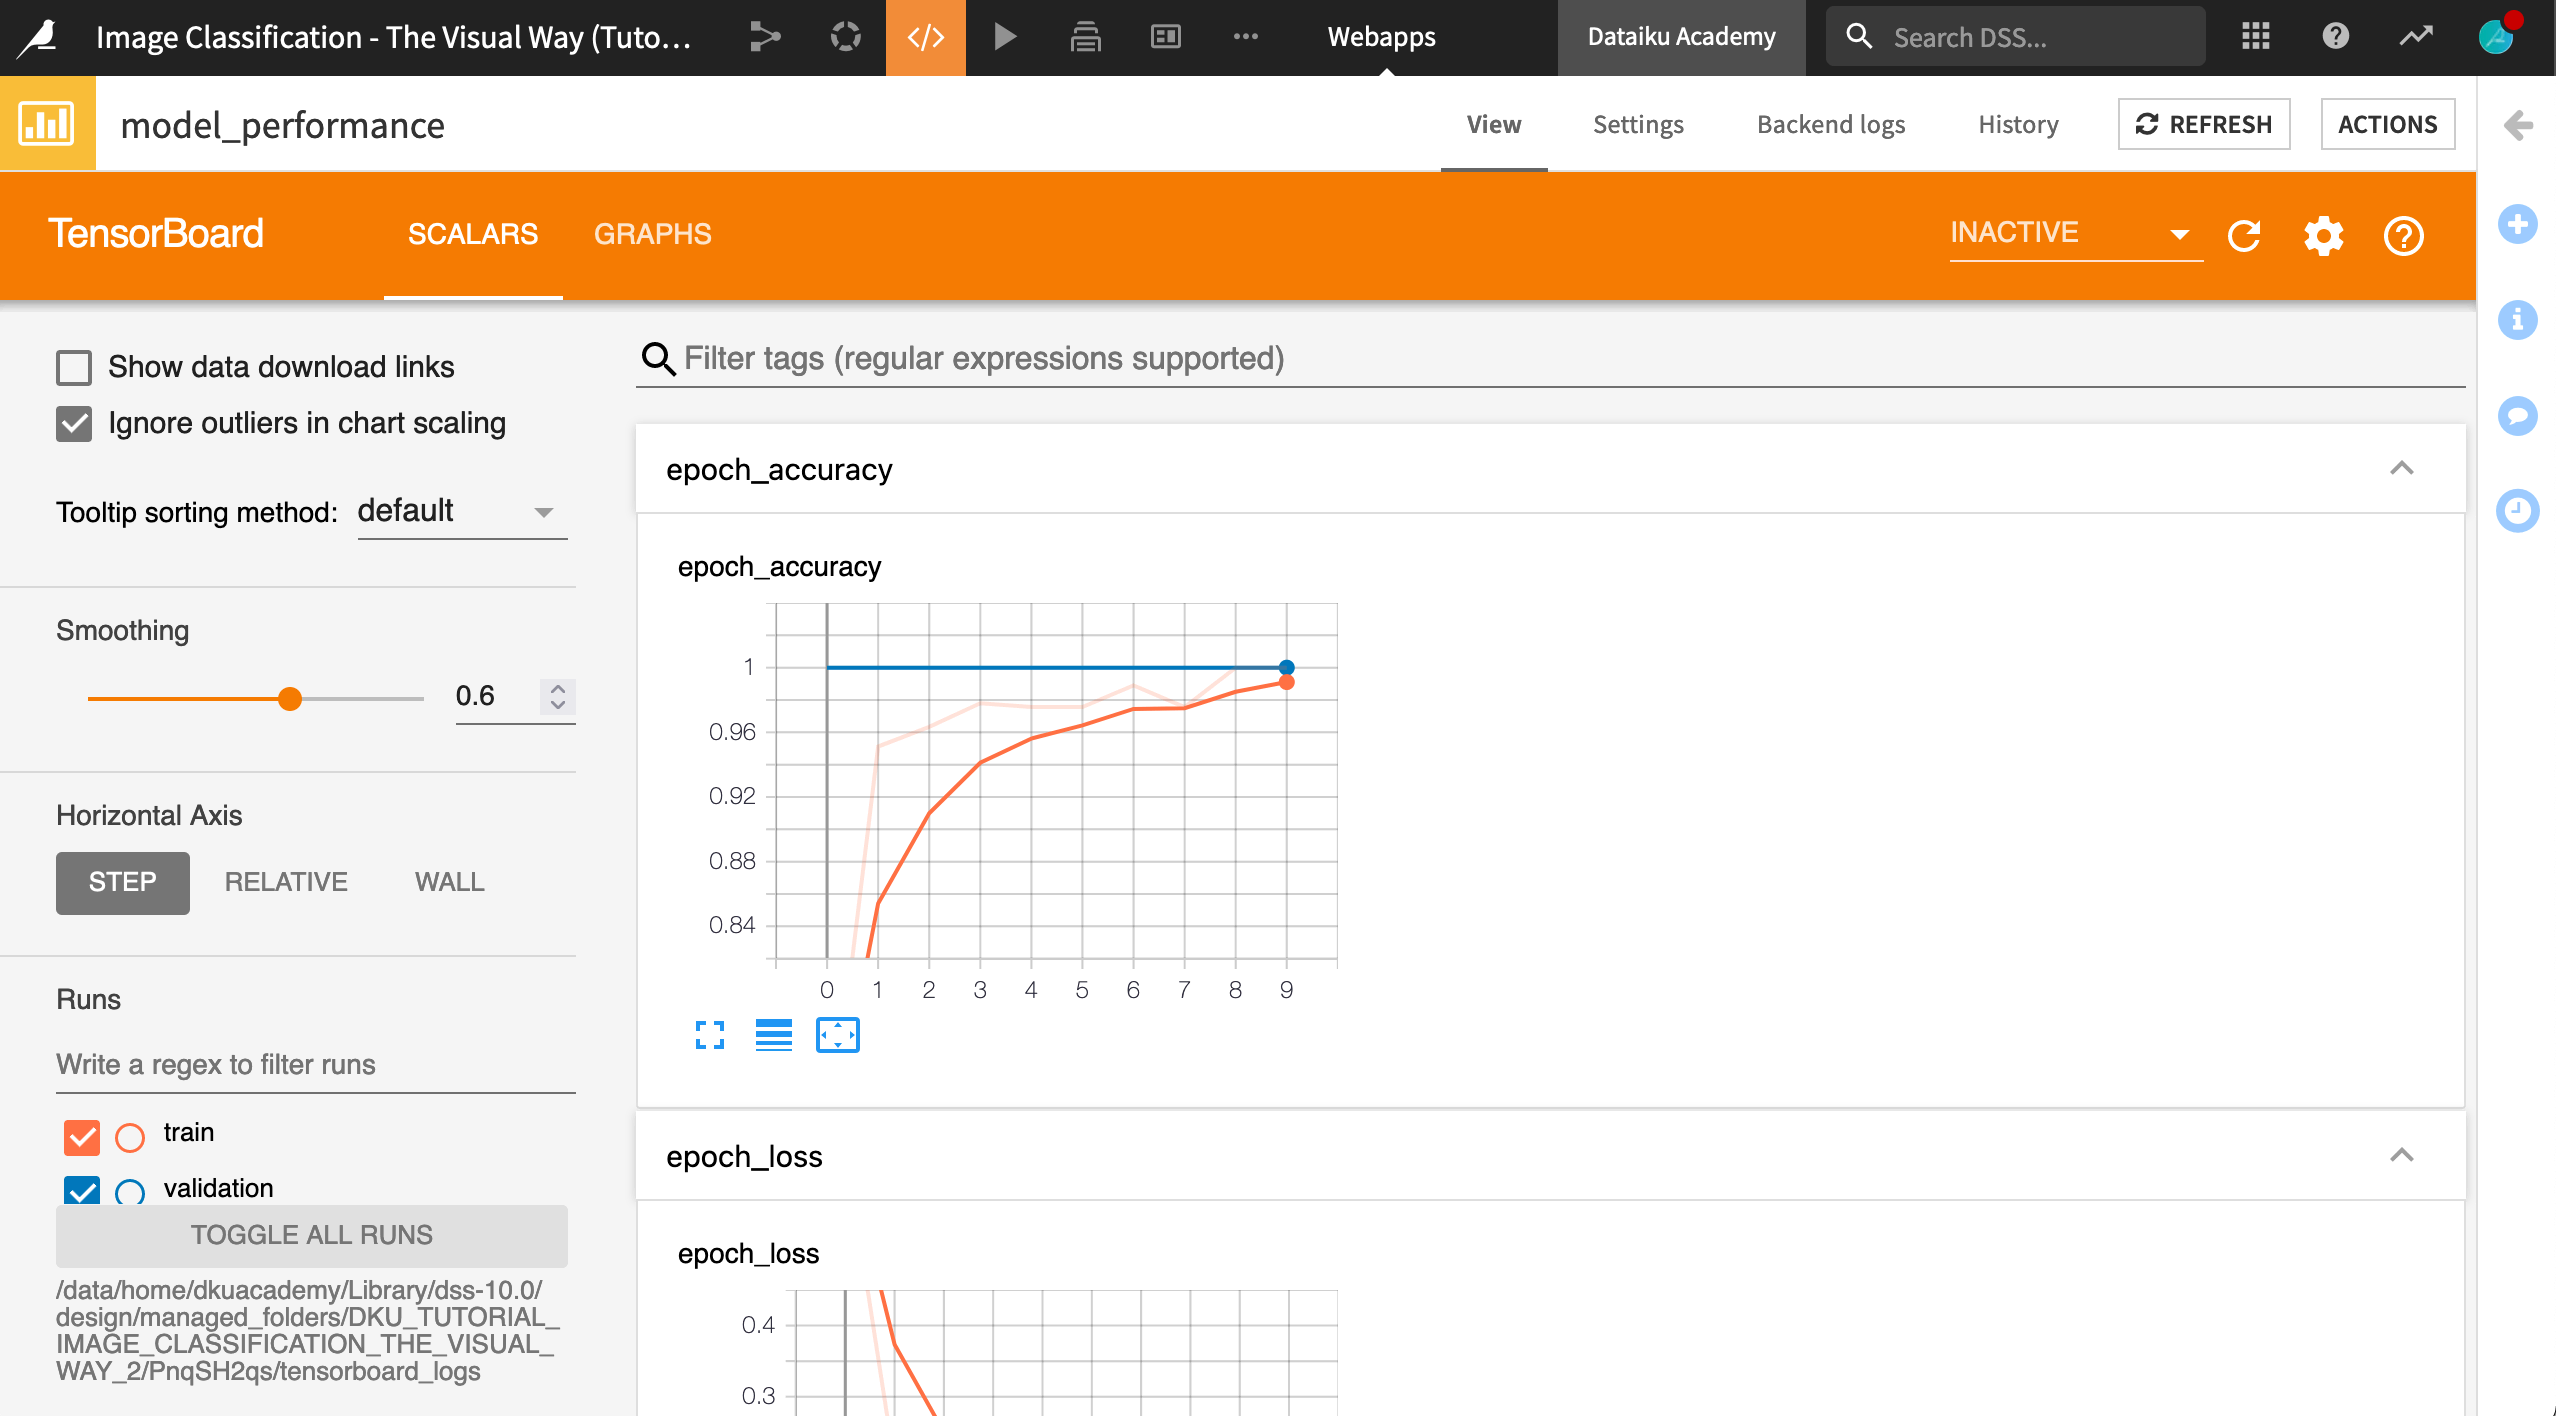
Congratulations! You can now monitor your model during re-training in the Scalars tab of your webapp.
Access the TensorBoard to Monitor Your Model
TensorBoard gathers all the metrics you need to interpret the results of your model both on the training set and the test set. Specifically, you can monitor the following:
The accuracy, acc. This is the accuracy on the train set towards steps. Likewise, val_acc is the accuracy on the test set.
The loss, loss in Tensorboard. This is the evolution of loss on the train set towards steps. Likewise, val_loss is the loss on the test set.
Analyze Your Model’s Architecture
Understanding your model’s architecture is useful particularly when using your own model. Here, we have used a pre-trained model where the last layer is being retrained. In the Graphs tab of the TensorBoard, you can visually access the model’s infrastructure. The graphs display the visual structure of the model.
Within the View tab of the webapp, navigate to the Graphs tab.
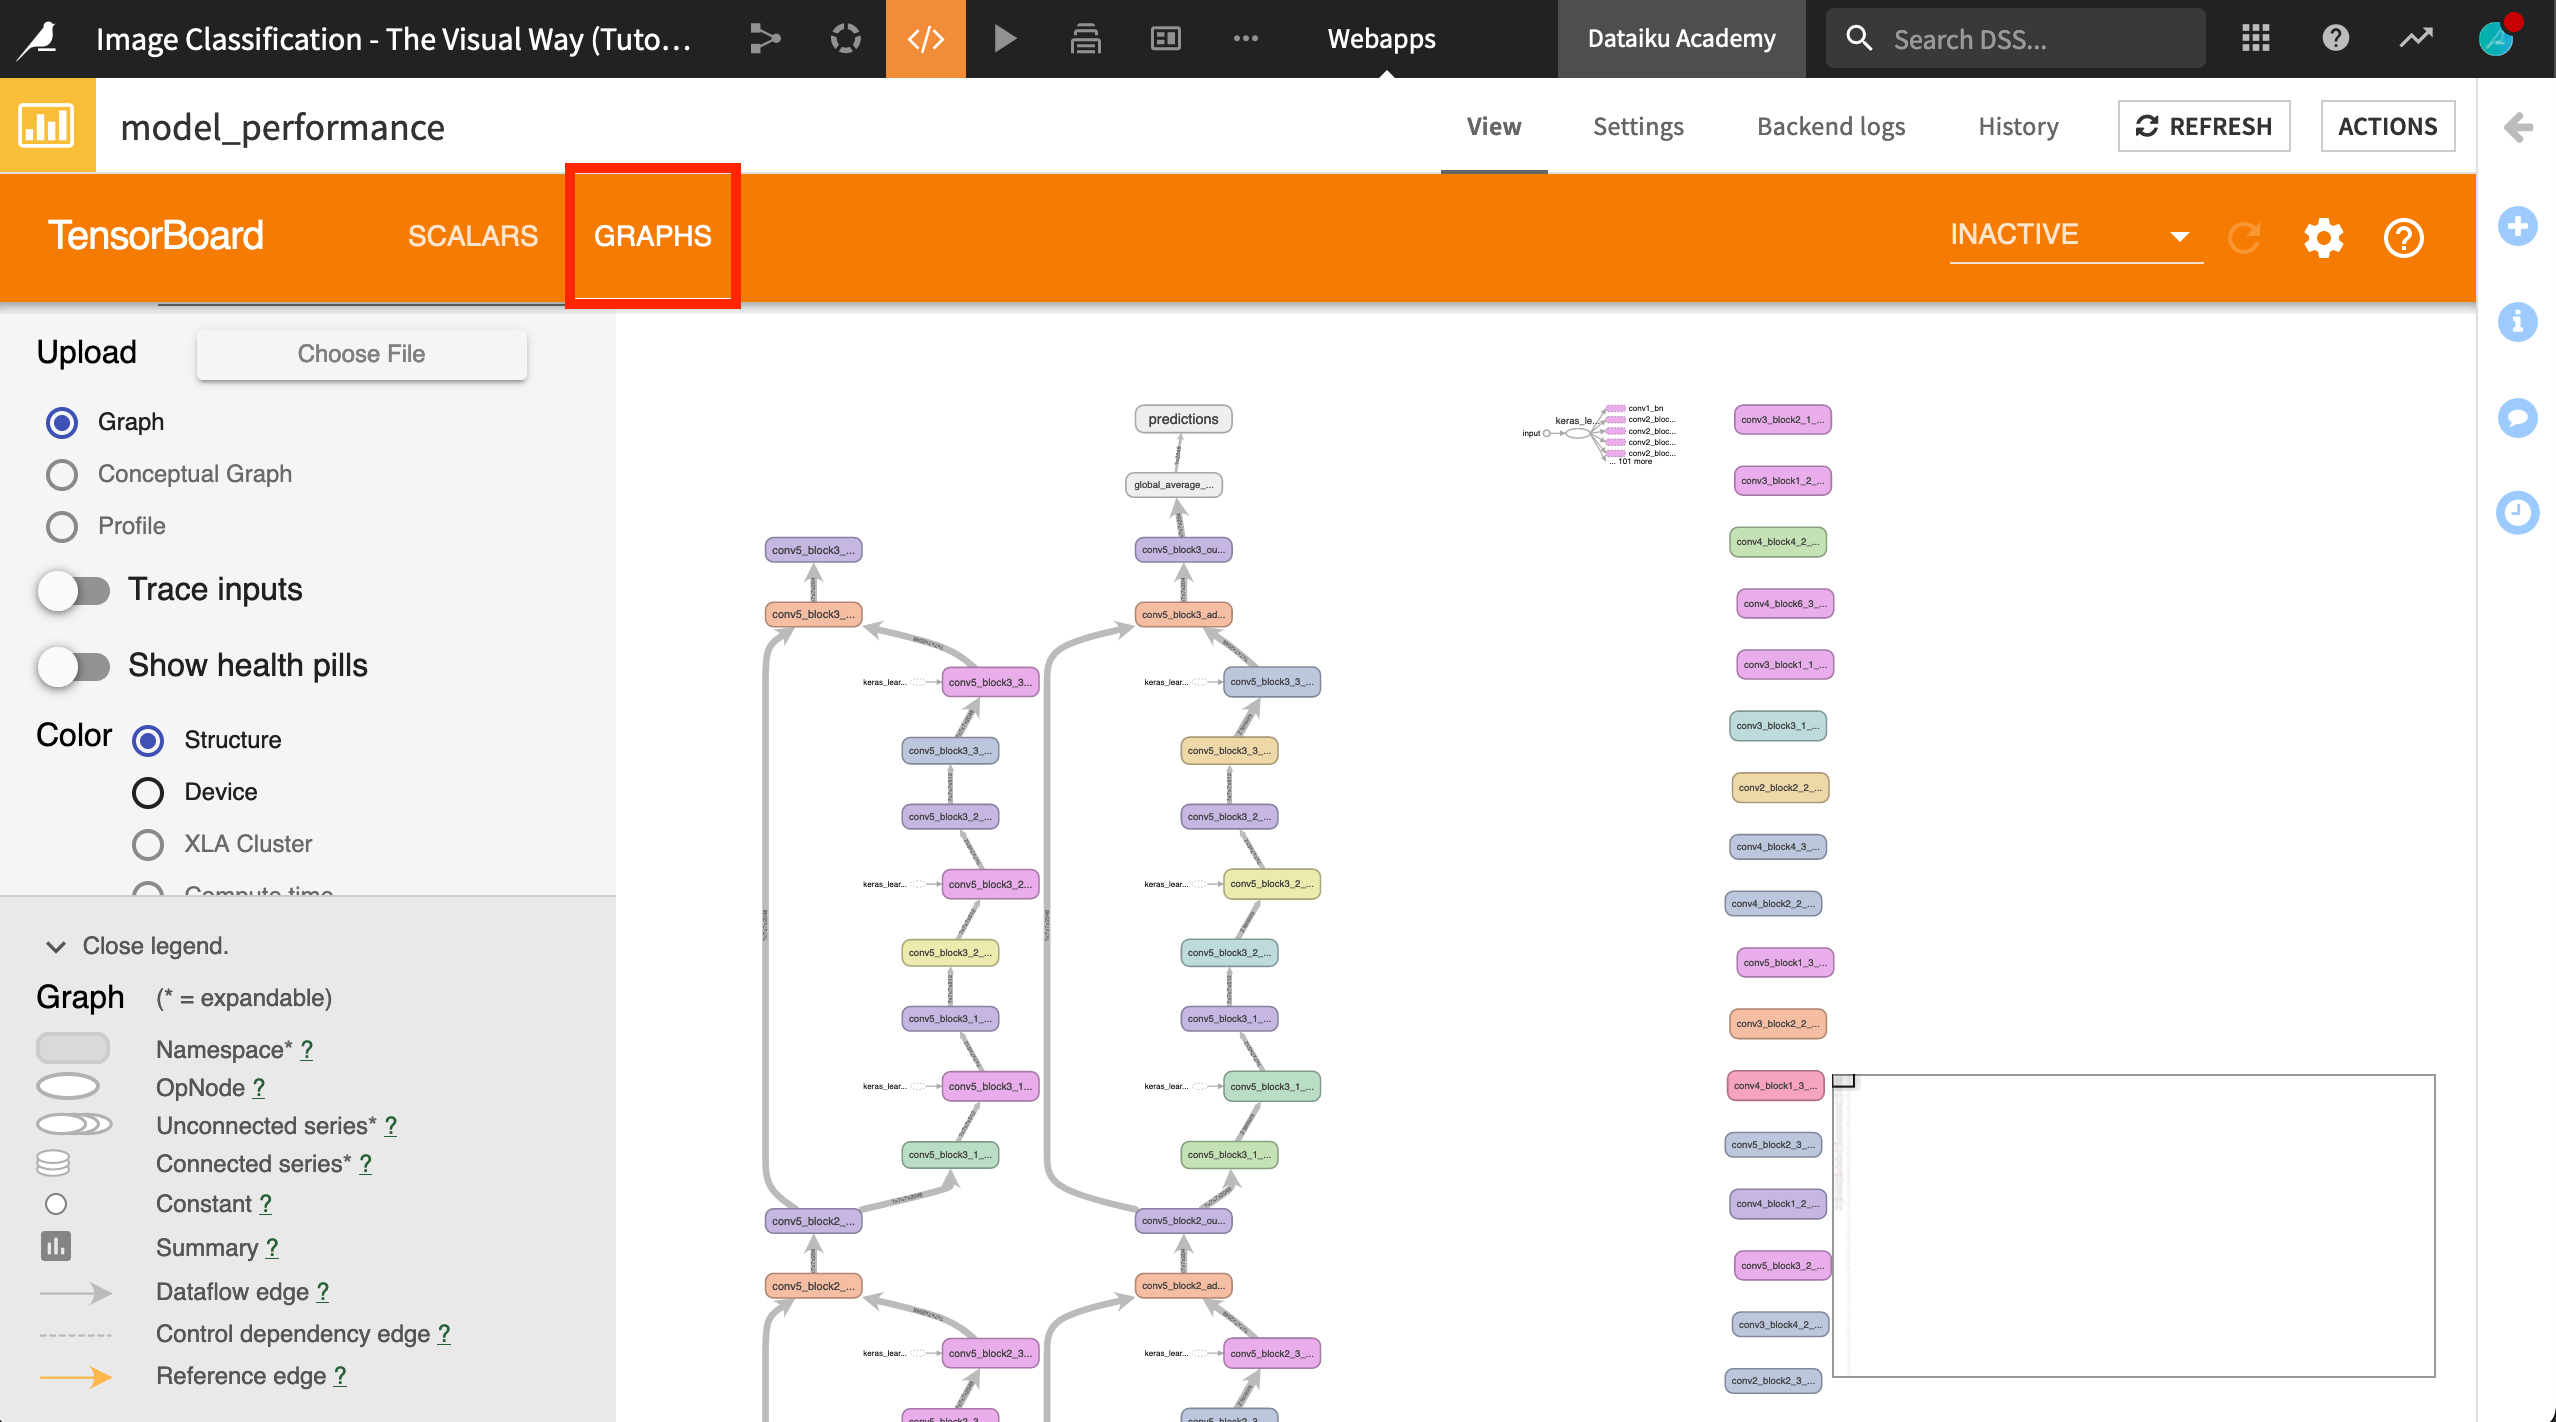
You can scan your graph, and fold and unfold your nodes. Each layer will have a color corresponding to its structure. For example, all activation layers will have the same color.
You can change the color code by changing the selection. Selecting a color code per device instead of per instance can help you distinguish between devices, particularly if you are using different devices, such as different GPUs.
Note
The “Trace inputs” option displays all of the dependencies for a node in the whole graph.
On your own, you can also publish this webapp to a dashboard, as done in the Gallery version of this project.
Wrap Up
Congratulations on completing this tutorial on image classification using the Deep Learning on Images plugin!
The plugin also allows you to extract features from images for use in building predictive models; for example, the goal of the Two Sigma Connect Kaggle competition was to predict how popular an apartment rental listing would be, based on various characteristics, including pictures of the apartment. Using the Deep learning on images plugin, you can extract features that can be used in the model.
Next, you may be interested in trying object detection!
Note
You can also build your own deep learning models for image classification using Keras and Tensorflow in Dataiku. For more information on deep learning, please see the product documentation.