How to use SQL from a Python Recipe in DSS
SQL is the most pervasive way to make data analysis queries. However, doing advanced logic like loops and conditions is often difficult in SQL. There are some options like stored queries, but they require learning new languages.
Dataiku DSS lets you run SQL queries directly from a Python recipe. This lets you:
sequence several SQL queries
dynamically generate new SQL queries to execute in the database
use SQL to obtain some aggregated data for further numerical processing in Python
and much more!
In this tutorial, we are going to use this ability to analyze a dataset from the San Francisco airport.
Prerequisites
You’ll need a SQL database configured in DSS. We are not going to use very advanced SQL, so any supported SQL database will do.
Getting Started
To get started, create the initial starter project with the data already uploaded.
From the Dataiku DSS homepage, click +New Project > DSS Tutorials > Code > SQL in Python (Advanced Tutorial).
Click Go to Flow.
The problem at hand
The dataset records the number of cargo landings and total landed cargo weight at the SFO airport. The dataset contains one record for each month, airline, type and details of aircraft. The line includes the number of aircrafts of this type of this company that landed this month, and the number of records.
The dataset contains data from 2005 to 2015.
What we would like to do is write a recipe to obtain, for each month and airline, a breakdown in several columns of the total landing weight by aircraft manufacturer. In essence, that’s a kind of crosstab / pivot table.
To make things a bit more complex, we are not interested in the small aircraft manufacturers (there are more than 15 in the original data). We only want the top 5 manufacturers. And by top, we mean, “with the highest count of landings”.
With these constraints, doing that in SQL only would be fairly complex. Let’s do it with a little bit of Python calling SQL.
Input data
| Month | Airline | Aircraft type | Landings | Total weight |
|---|
Output data
| Month | Airline | Boeing | Airbus | Mc. Donnel |
|---|---|---|---|---|
| 201501 | United | Total Boeing weight | Total Airbus Weight | Total Mc. Donnel weight |
Getting the data ready
Your DSS project has the source data in a Filesystem (or Uploaded) dataset. As this is an import from a CSV file, DSS has not automatically typed the input columns: if you go to the settings of the dataset, you’ll see the columns declared as string.
We could set the types manually in the dataset, but we could also let the Preparation recipe of DSS do it. Since anyway we need to copy our dataset to a SQL database, using a Prepare recipe instead of a Sync recipe will give us the typing inference for free.
Go to the Flow view and select your source dataset.
Create a Prepare recipe from the source dataset
Choose to store the output in your SQL database connection.
Let’s name the output dataset
sfo_prepared.
The dataset is actually fairly clean, so we won’t need any actual preparation step.
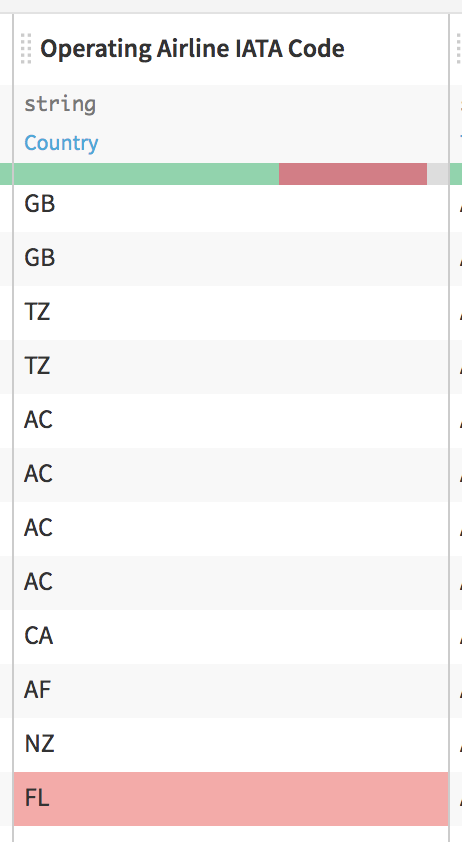
Note
About invalid values
If you look at your preparation recipe data table, you’ll see that DSS has colored some cells in red. That’s because DSS thinks that the meaning of the IATA columns is a Country (since many values are valid countries). DSS is wrong on this, since not all IATA codes are valid countries.
We could click on the column header and click Change meaning to tell DSS that this is only text. However, note that DSS has already selected string as the storage type (since a Country name can only be stored as string anyway). Fixing the meaning makes for a cleaner recipe but is not strictly mandatory
Let’s `Run` our preparation recipe (Select “Update Schema” when prompted).
Everything is going well, so we now how our properly typed dataset in our SQL database. Let’s create a Python recipe, and let’s create an output dataset sfo_pivot in the same SQL connection.
What we are going to do
We want to do our processing in two steps:
First we will issue a first SQL query to retrieve the 5 top manufacturers by total landing count
We’ll use that knowledge and a small Python loop to generate the actual pivot query
We’ll execute the pivot query in SQL and store the results in the output datasets
In order to create the column per manufacturer, we’re going to use a small trick: “CASE WHEN”.
This SQL construct allows you to create conditional operations. To make a column with the total landing weights of Airbus planes only, here is how we would use it:
SELECT
  SUM(CASE WHEN "Aircraft Manufacturer" = 'Airbus'
      THEN "Total Landed Weight" ELSE 0 END) AS boeing_weight
For each row, if it is Airbus, we sum the weight, else we sum 0.
Warning
The code below refers to the table as sfo_prepared. If you created the project through the method described above, your table will have the project key prefixed to it. You’ll also need to wrap it in quotation marks, such as “DKU_TUTORIAL_SQLINPYTHON_sfo_prepared”.
You can also create an SQL notebook and click on the table name to see how it should be referenced if you have trouble.
# -*- coding: utf-8 -*-
import dataiku
import pandas as pd, numpy as np
from dataiku import pandasutils as pdu

# Import the class that allows us to execute SQL on the Studio connections
from dataiku.core.sql import SQLExecutor2

# Get a handle on the input dataset
sfo_prepared = dataiku.Dataset("sfo_prepared")

# We create an executor. We pass to it the dataset instance. This way, the
# executor  knows which SQL database should be targeted
executor = SQLExecutor2(dataset=sfo_prepared)

# Get the 5 most frequent manufacturers by total landing count
# (over the whole period)
mf_manufacturers = executor.query_to_df(
    """
    select      "Aircraft Manufacturer" as manufacturer,
                sum("Landing Count") as count
            from sfo_prepared
            group by "Aircraft Manufacturer"
            order by count desc limit 5
    """)

# The "query_to_df" method returns a Pandas dataframe that
# contains the manufacturers
So we now have a dataframe with the manufacturers, let’s use a small Python loop to generate these pesky case when
cases = []

for (row_index, manufacturer, count) in mf_manufacturers.itertuples():
    cases.append(
    """SUM (case when "Aircraft Manufacturer" = '%s'
            then "Total Landed Weight" else 0 end)
        as "weight_%s"
        """ % (manufacturer, manufacturer))
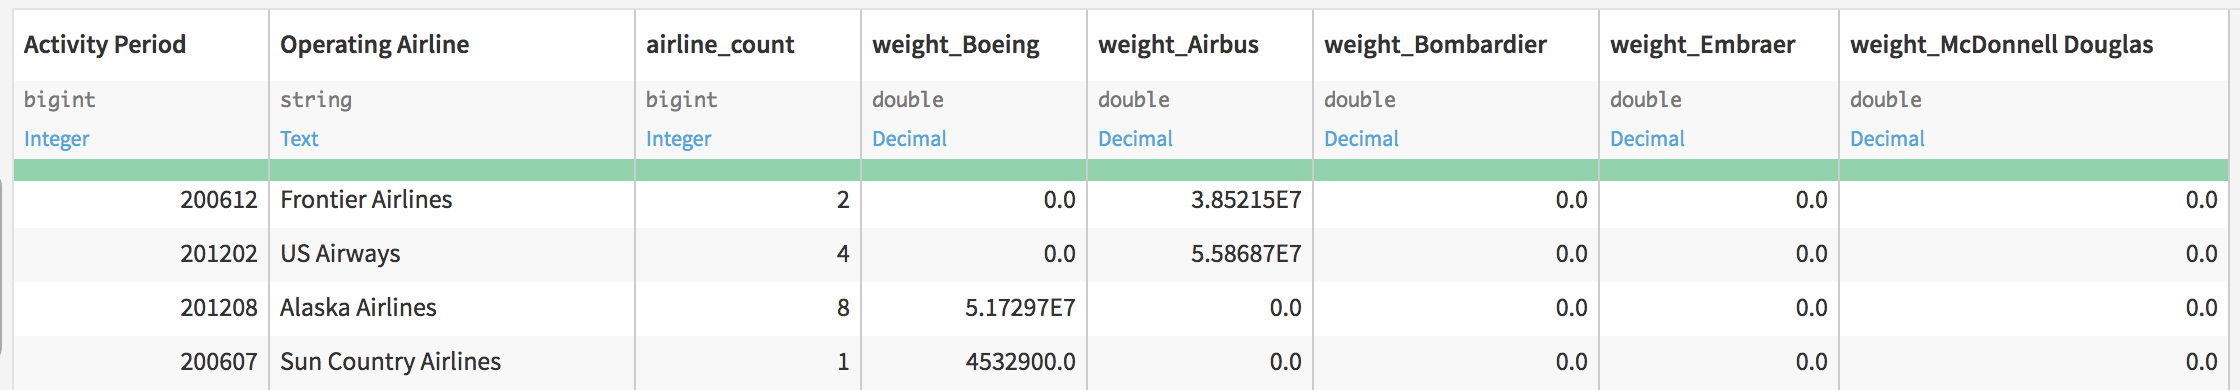
To finish, we only need to build the final query, execute it, get a dataframe, and store the result in the output
final_query = """select "Activity Period", "Operating Airline",
        COUNT(*) as airline_count, %s
        from sfo_prepared
        group by "Activity Period", "Operating Airline"
        """ % (",".join(cases))

print final_query

result = executor.query_to_df(final_query)

output_dataset = dataiku.Dataset("sfo_pivot")
output_dataset.write_with_schema(result)
We can now run and have a look at our output dataset!
Look at the output
The output is exactly what we wanted.
Let’s not resist making a chart. Let’s do a `Stacked columns` chart like this:
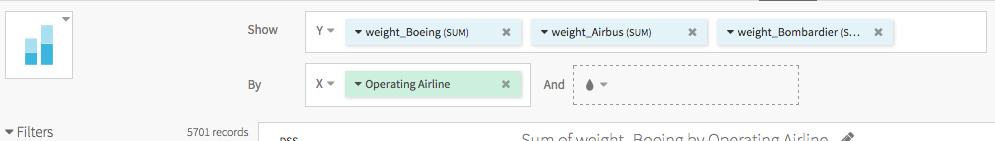
Add in “Tooltip” the `airline_count (SUM)` column, click on `Operating Airline`, and elect to sort by descending airline_count.
We obtain the following chart.
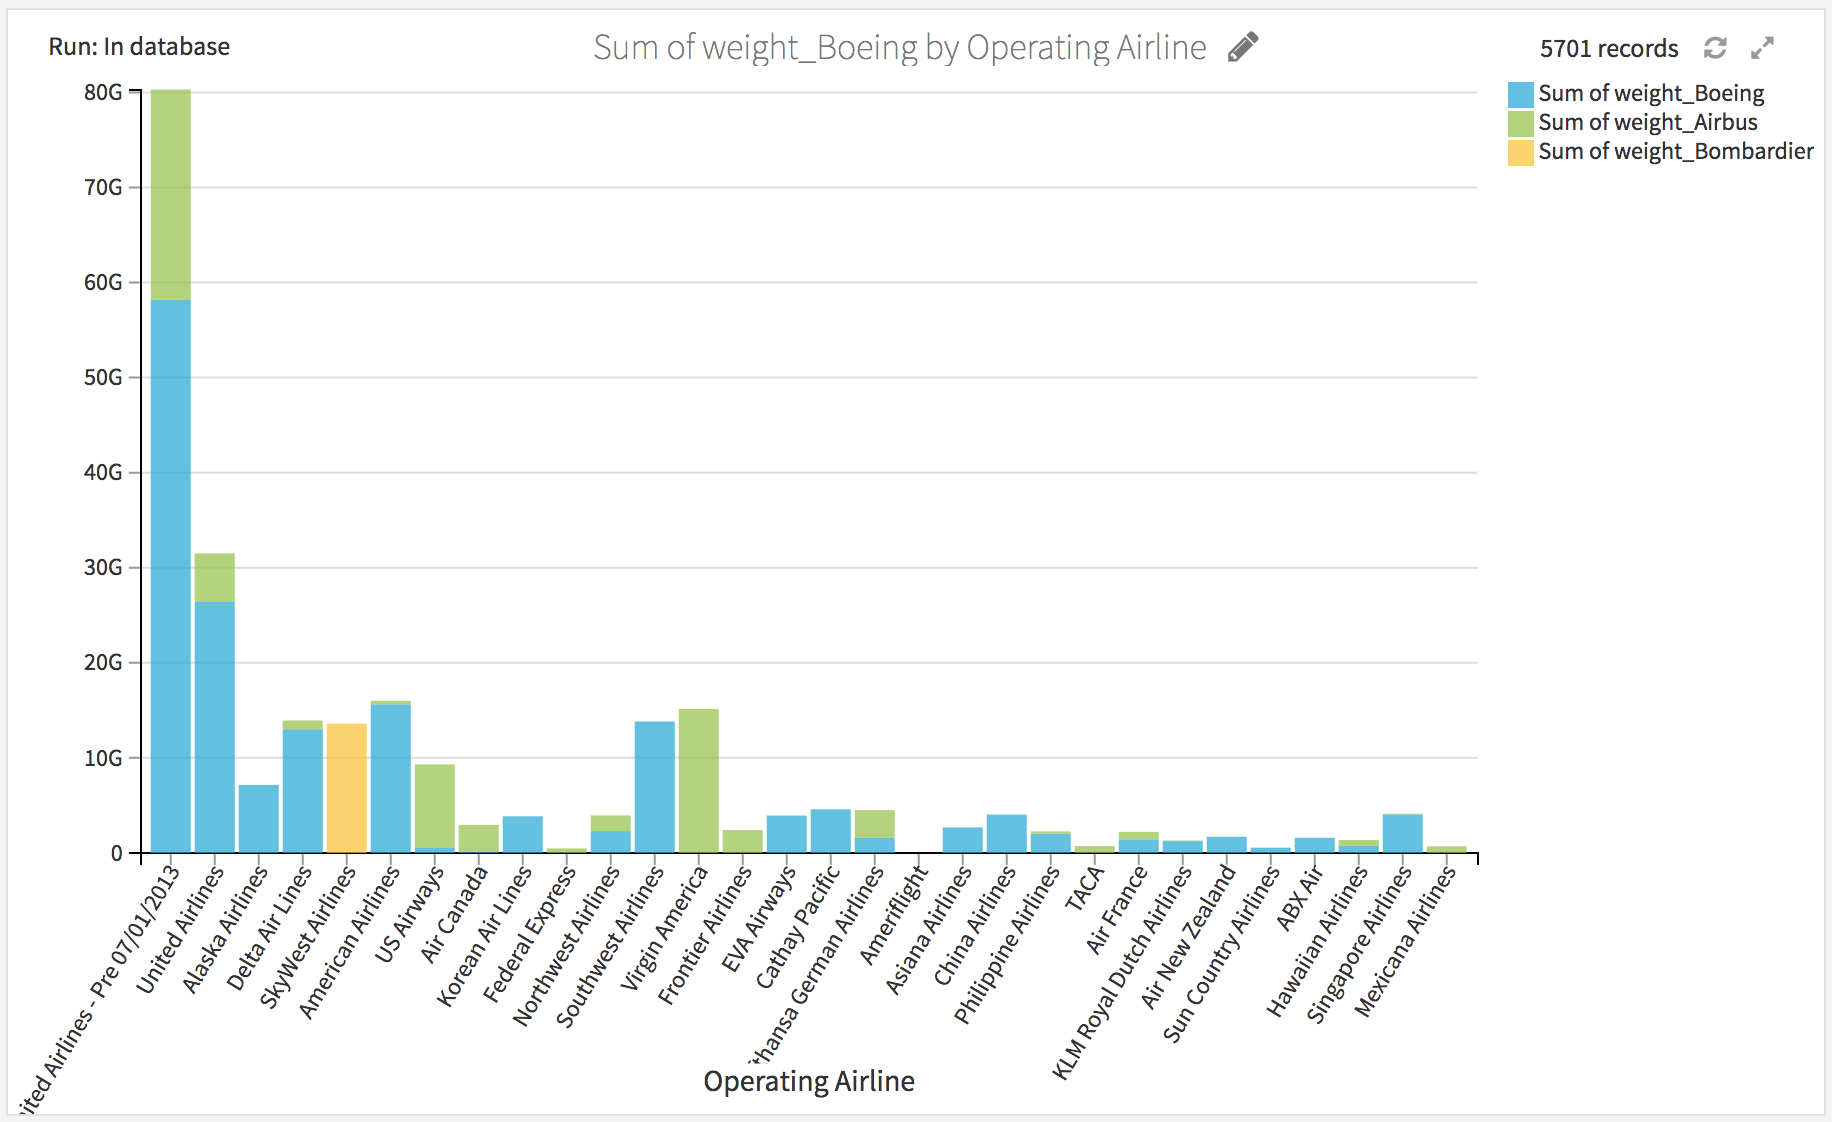
Fairly unsurprisingly, Boeing is very dominant, and most airlines are mono-carrier. However, United Airlines has a non-negligible Airbus cargo fleet.
Going further: execute in-database
In this first version, we executed both queries using “query_to_df”, meaning that the Python code actually received the whole data in memory, and sent it back to the database for storing the output dataset.
It would be better (and critical in the case of big datasets) that the “final” query be performed fully in-database.
Fortunately, DSS makes that easy. Executing SQL queries in-database and handling the work of dropping/creating table is what the SQL query does. The `SQLExecutor2` class lets you run a query “as-if” it was a SQL Query recipe.
Let’s just replace the final 3 lines of the code by:
output_dataset = dataiku.Dataset("sfo_pivot")
SQLExecutor2.exec_recipe_fragment(output_dataset, final_query)
And re-run. Everything works the same, but now, the data has not been streamed to Python. Everything stayed in the database.