Using PySpark in DSS
Out of the numerous ways to interact with Spark, the DataFrames API, introduced back in Spark 1.3, offers a very convenient way to do data science on Spark using Python (thanks to the PySpark module), as it emulates several functions from the widely used Pandas package. Let’s see how to do that in DSS in the short article below.
Prerequisites
You have access to an instance of DSS with Spark enabled, and a working installation of Spark, version 1.4+.
We’ll use the MovieLens 1M dataset, made of 3 parts: ratings, movies and users. You can start with downloading and creating these datasets in DSS, and parse them using a Visual Data Preparation script to make them suitable for analysis:
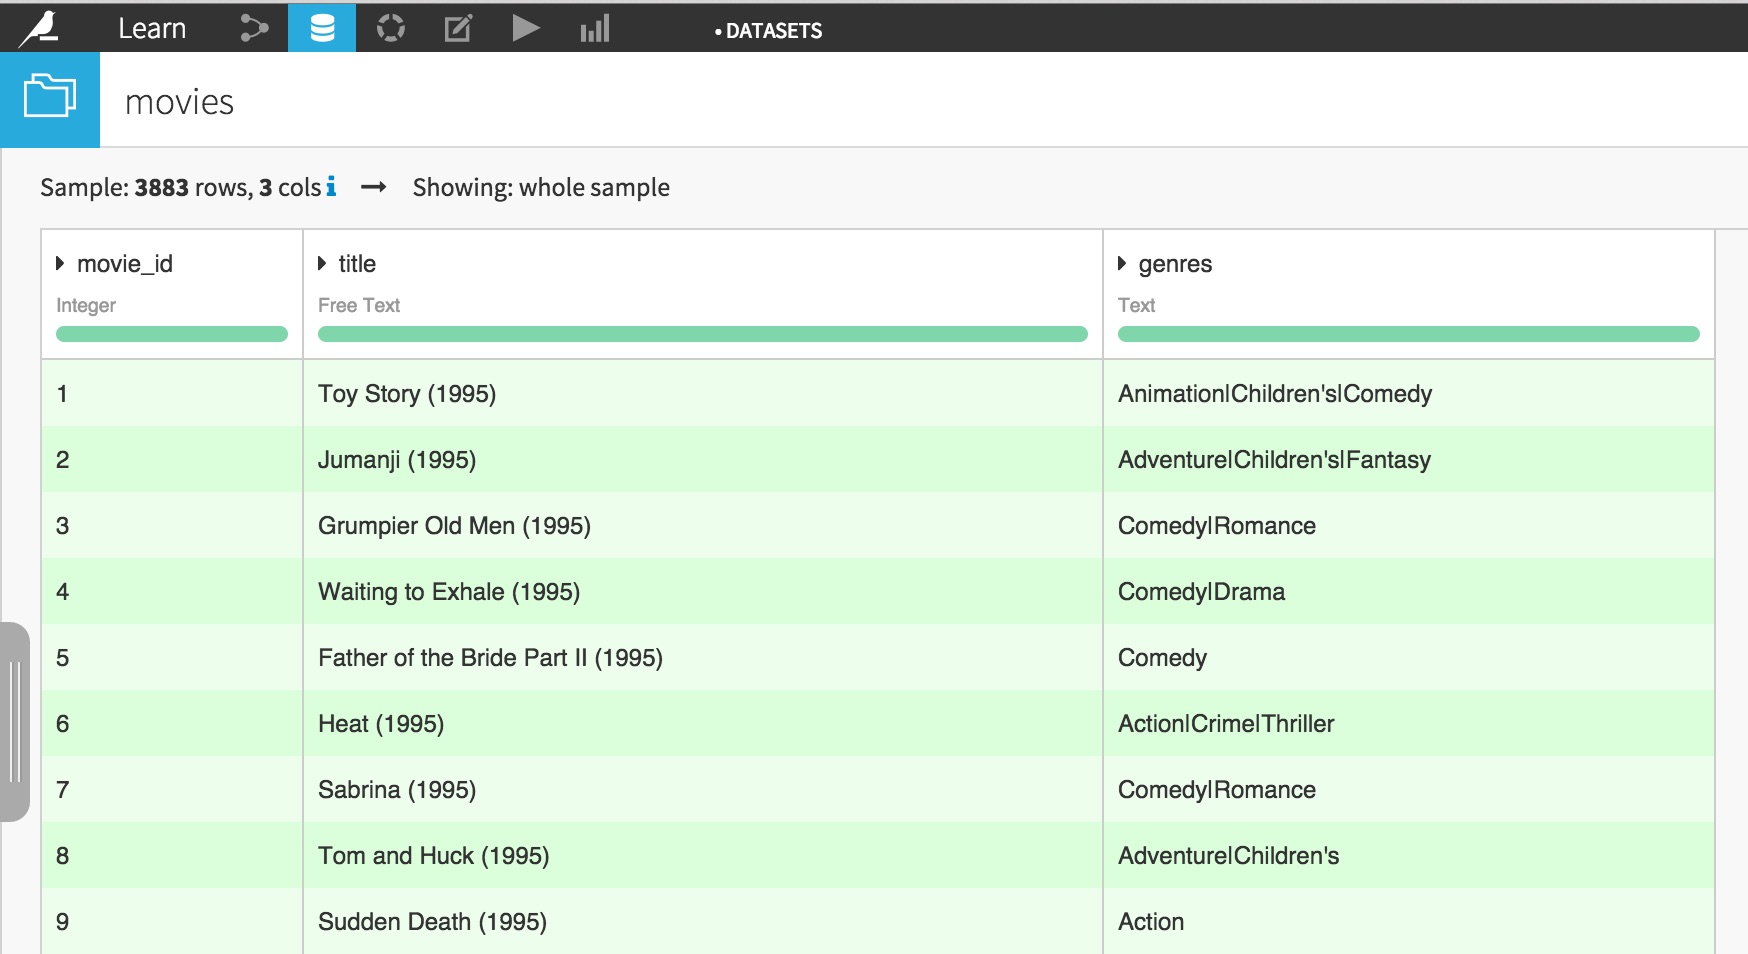
You should end up with 3 datasets:
movies
users
ratings
Creating DataFrames using PySpark and DSS APIs
As with regular Python, one can use Jupyter, directly embedded in DSS, to analyze interactively its datasets.
Go to the Notebook section from DSS top navbar, click New Notebook, and choose Python. In the new modal window showing up, select Template: Starter code for processing with PySpark:
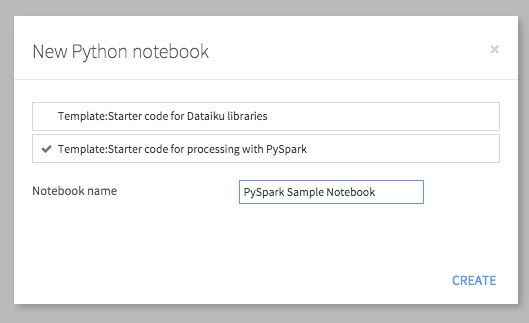
You are taken to a new Jupyter notebook, conveniently filled with starter code:
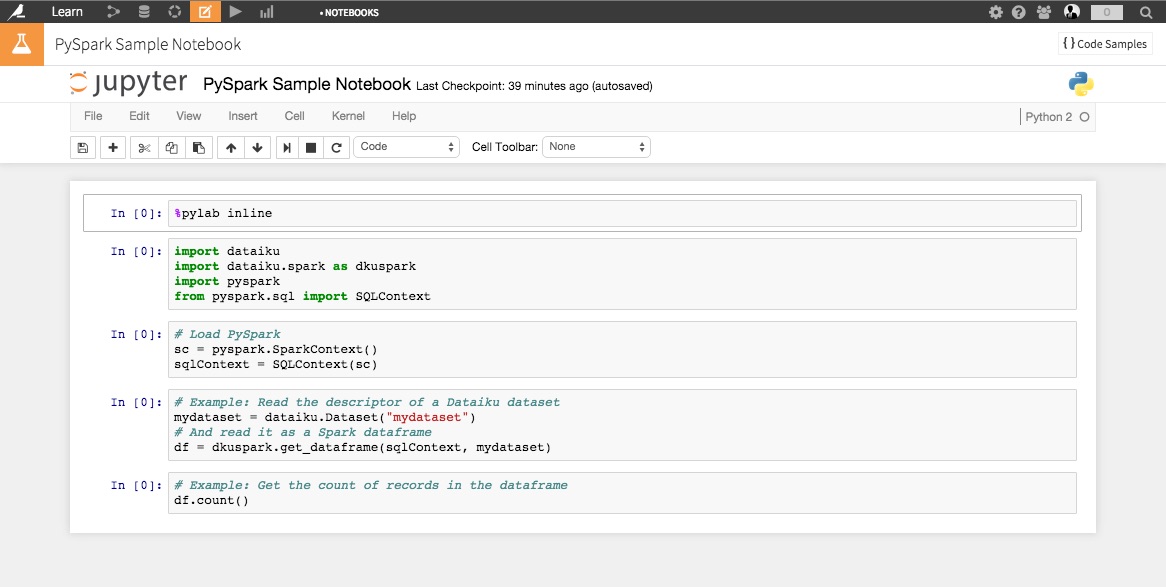
Let’s start with loading our DSS datasets into an interactive PySpark session, and store them in DataFrames.
DSS does the heavy lifting in terms of “plumbing”, so loading the Datasets into DataFrames is as easy as typing the following lines of code in your Jupyter notebook:
# Dataiku and Spark Python API's
import dataiku
import dataiku.spark as dkuspark
import pyspark
from pyspark.sql import SQLContext

# Load PySpark
sc = pyspark.SparkContext()
sqlContext = SQLContext(sc)

# Point to the DSS datasets
users_ds = dataiku.Dataset("users")
movies_ds = dataiku.Dataset("movies")
ratings_ds = dataiku.Dataset("ratings")

# And read them as a Spark dataframes
users = dkuspark.get_dataframe(sqlContext, users_ds)
movies = dkuspark.get_dataframe(sqlContext, movies_ds)
ratings = dkuspark.get_dataframe(sqlContext, ratings_ds)
The hardest part is done. You can now start using your DataFrames using the regular Spark API.
Exploring your DataFrames
A Spark DataFrame has several interesting methods to uncover their content. For instance, let’s have a look at the number of records in each dataset:
print "DataFrame users has %i records" % users.count()
print "DataFrame movies has %i records" % movies.count()
print "DataFrame ratings has %i records" % ratings.count()
DataFrame users has 6040 records, DataFrame movies has 3883 records, and DataFrame ratings has 1000209 records.
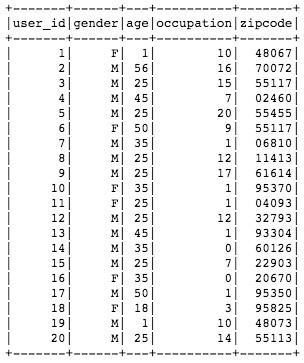
You can also want to look at the actual content of your dataset using the .show() method:
users.show()
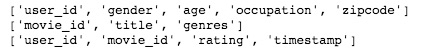
You may want to only check the column names in your DataFrame using the columns attribute:
dfs = [users, movies, ratings]

for df in dfs:
    print df.columns
The printSchema() method gives more details about the DataFrame’s schema and structure:
print users.printSchema()
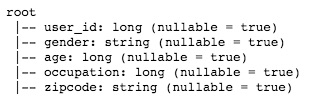
Note that the DataFrame schema directly inherits from the DSS Dataset schema, which comes very handy when you need to manage centrally your datasets and the associated metadata!
Analyzing your DataFrames
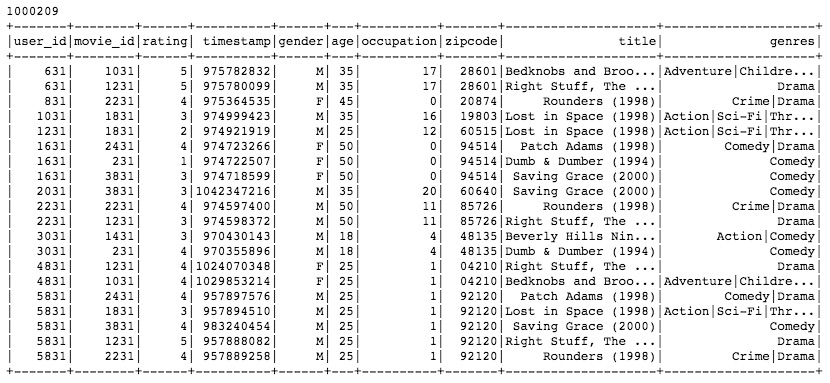
Let’s have a look now at more advanced functions. Let’s start with merging the datasets together to offer a consolidated view.
a = ratings\
     .join(users, ratings['user_id']==users['user_id'], 'inner')\
     .drop(users['user_id'])

complete = a\
            .join(movies, a['movie_id']==movies['movie_id'], 'inner')\
            .drop(movies['movie_id'])

print complete.count()
print '\n' + complete.show()
Let’s assume you need to rescale the users ratings by removing their average rating value:
from pyspark.sql import functions as spfun

# Computing the average rating by user
avgs = complete.groupBy('user_id').agg(
    spfun.avg('rating').alias('avg_rating')
)

# Join again with initial data
final = complete\
          .join(avgs, complete['user_id']==avgs['user_id'])\
          .drop(avgs['user_id'])

# Create a new column storing the rescaled rating
df = final.withColumn('rescaled_rating', final['rating'] - final['avg_rating'])
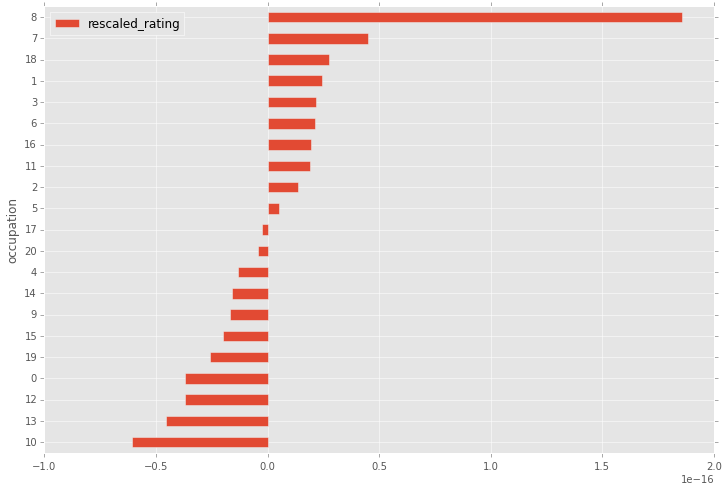
How do the rescaled ratings differ by occupation code? Don’t forget that you are in regular Jupyter / Python session, meaning that you can use non-Spark functionalities to analyze your data.
matplotlib.style.use('ggplot')

# Spark DataFrame
stats = df.groupBy('occupation').avg('rescaled_rating').toPandas()

# Pandas dataframe
stats.columns = ['occupation', 'rescaled_rating']
stats = stats.sort('rescaled_rating', ascending=True)

stats.plot(
  kind='barh',
  x='occupation',
  y='rescaled_rating',
  figsize=(12, 8)
)
Creating PySpark recipes to automate your workflow
Finally, once your interactive session is over and you are happy with the results, you may want to automate your workflow.
First, download your Jupyter notebook as a regular Python file on your local computer, from the File => Download as… function in the Notebook menu.
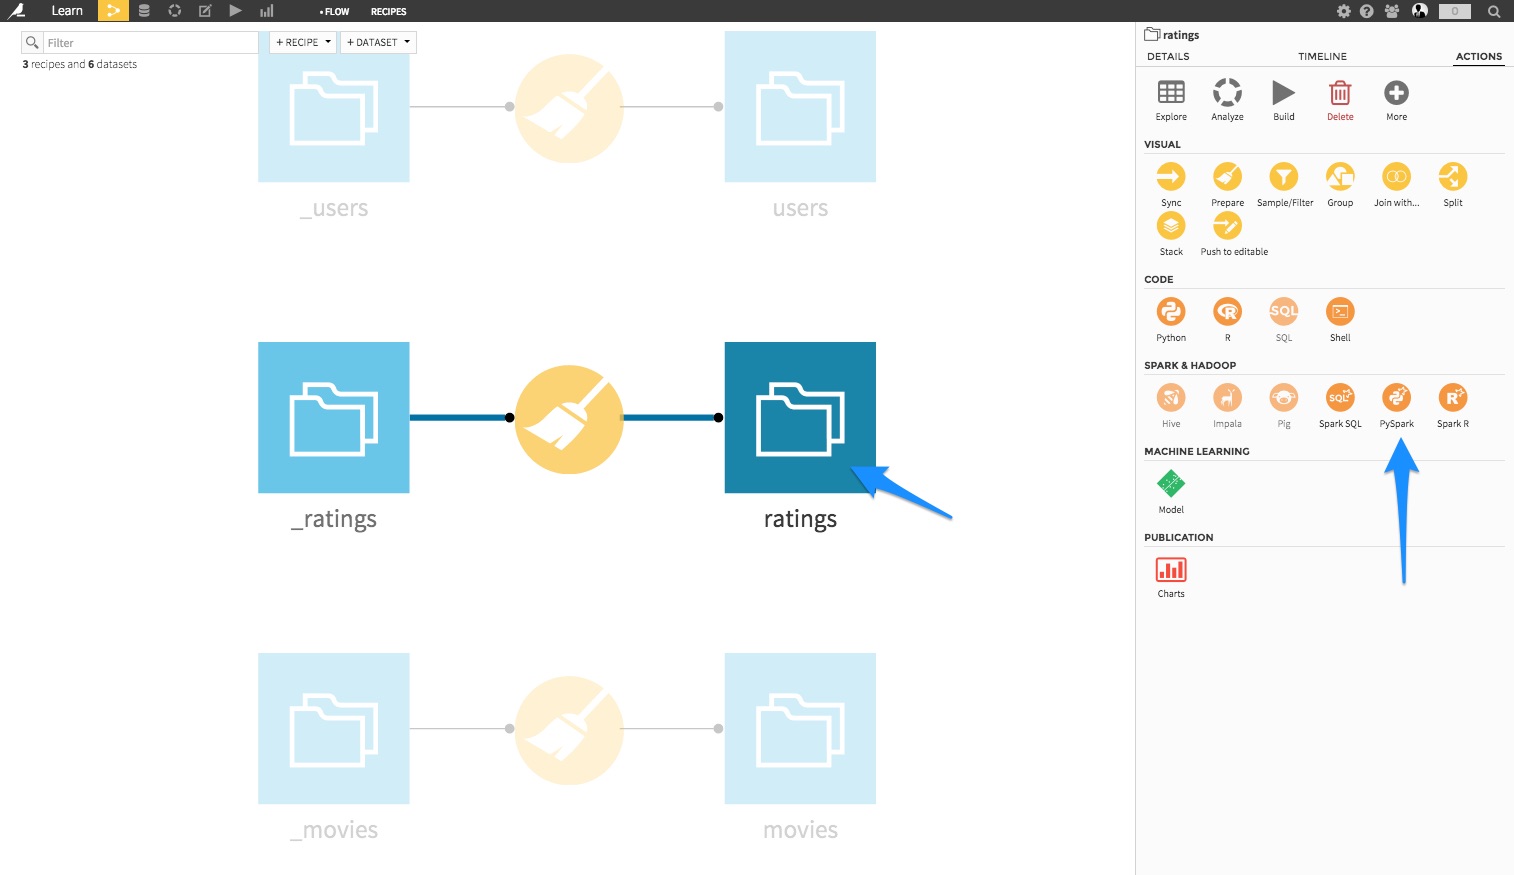
Go back to the Flow screen, left click on the ratings dataset, and in the right pane, choose PySpark:
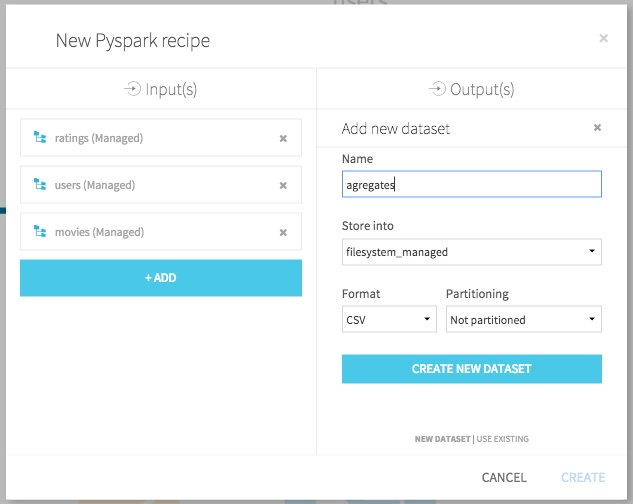
Select the 3 MovieLens datasets as inputs, and create a new dataset called agregates on the machine filesystem:
In the recipe code editor, copy/paste the content of the downloaded Python file, and add the output dataset:
# -*- coding: utf-8 -*-
import dataiku
import dataiku.spark as dkuspark
import pyspark
from pyspark.sql import SQLContext
from pyspark.sql import functions as spfun

# Load PySpark
sc = pyspark.SparkContext()
sqlContext = SQLContext(sc)

# Point to the DSS datasets
users_ds = dataiku.Dataset("users")
movies_ds = dataiku.Dataset("movies")
ratings_ds = dataiku.Dataset("ratings")

# And read them as a Spark dataframes
users = dkuspark.get_dataframe(sqlContext, users_ds)
movies = dkuspark.get_dataframe(sqlContext, movies_ds)
ratings = dkuspark.get_dataframe(sqlContext, ratings_ds)

# Analysis
a = ratings\
      .join(users, ratings['user_id']==users['user_id'], 'inner')\
      .drop(users['user_id'])

complete = a\
            .join(movies, a['movie_id']==movies['movie_id'], 'inner')\
            .drop(movies['movie_id'])

avgs = complete.groupBy('user_id').agg(
    spfun.avg('rating').alias('avg_rating')
)

final = complete\
          .join(avgs, complete['user_id']==avgs['user_id'])\
          .drop(avgs['user_id'])

df = final.withColumn('rescaled_rating', final['rating'] - final['avg_rating'])

stats = df.groupBy('occupation').avg('rescaled_rating')

# Output datasets
agregates = dataiku.Dataset("agregates")
dkuspark.write_with_schema(agregates, stats)
Hit the Run green button. The Spark jobs launches, and successfully completes (check your job’s logs to make sure everything went fine).
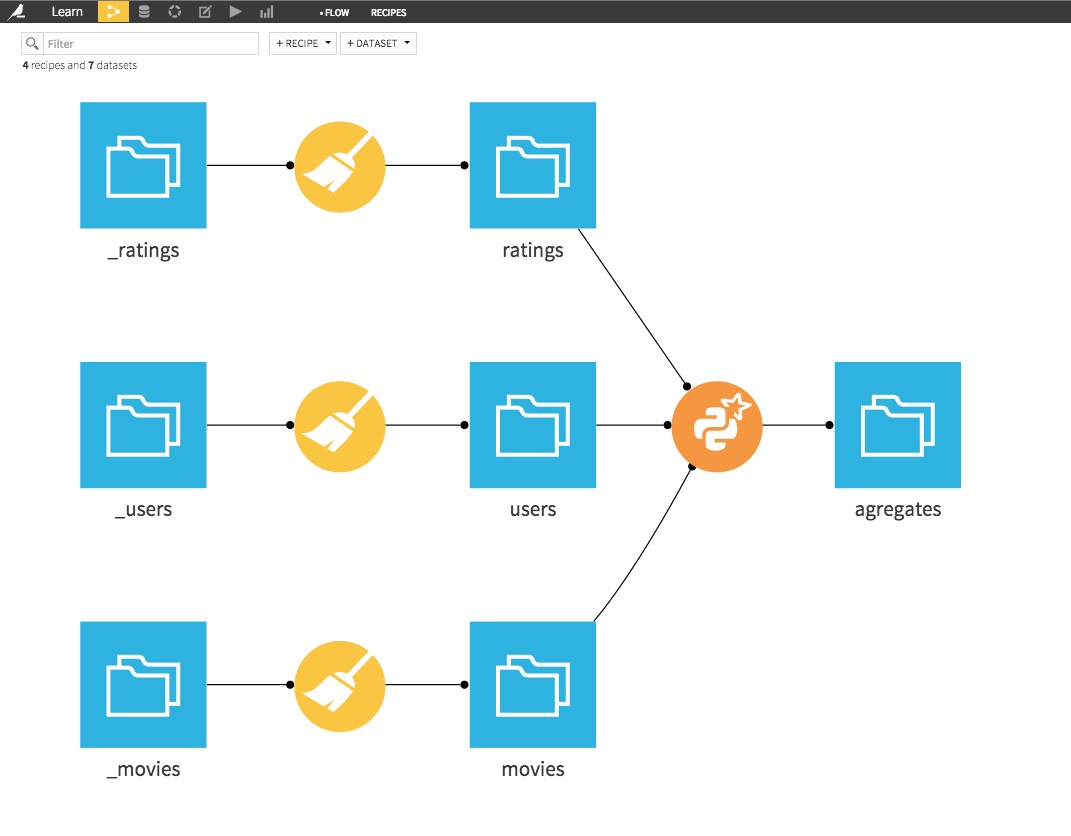
Your flow is now complete:
Using PySpark and the Spark’s DataFrame API in DSS is really easy. This opens up great opportunities for data science in Spark, and create large-scale complex analytical workflows.