The AI Lifecycle: Data Exploration
The goal of the Data Exploration phase is to investigate data with iterative visualizations and statistical summaries.
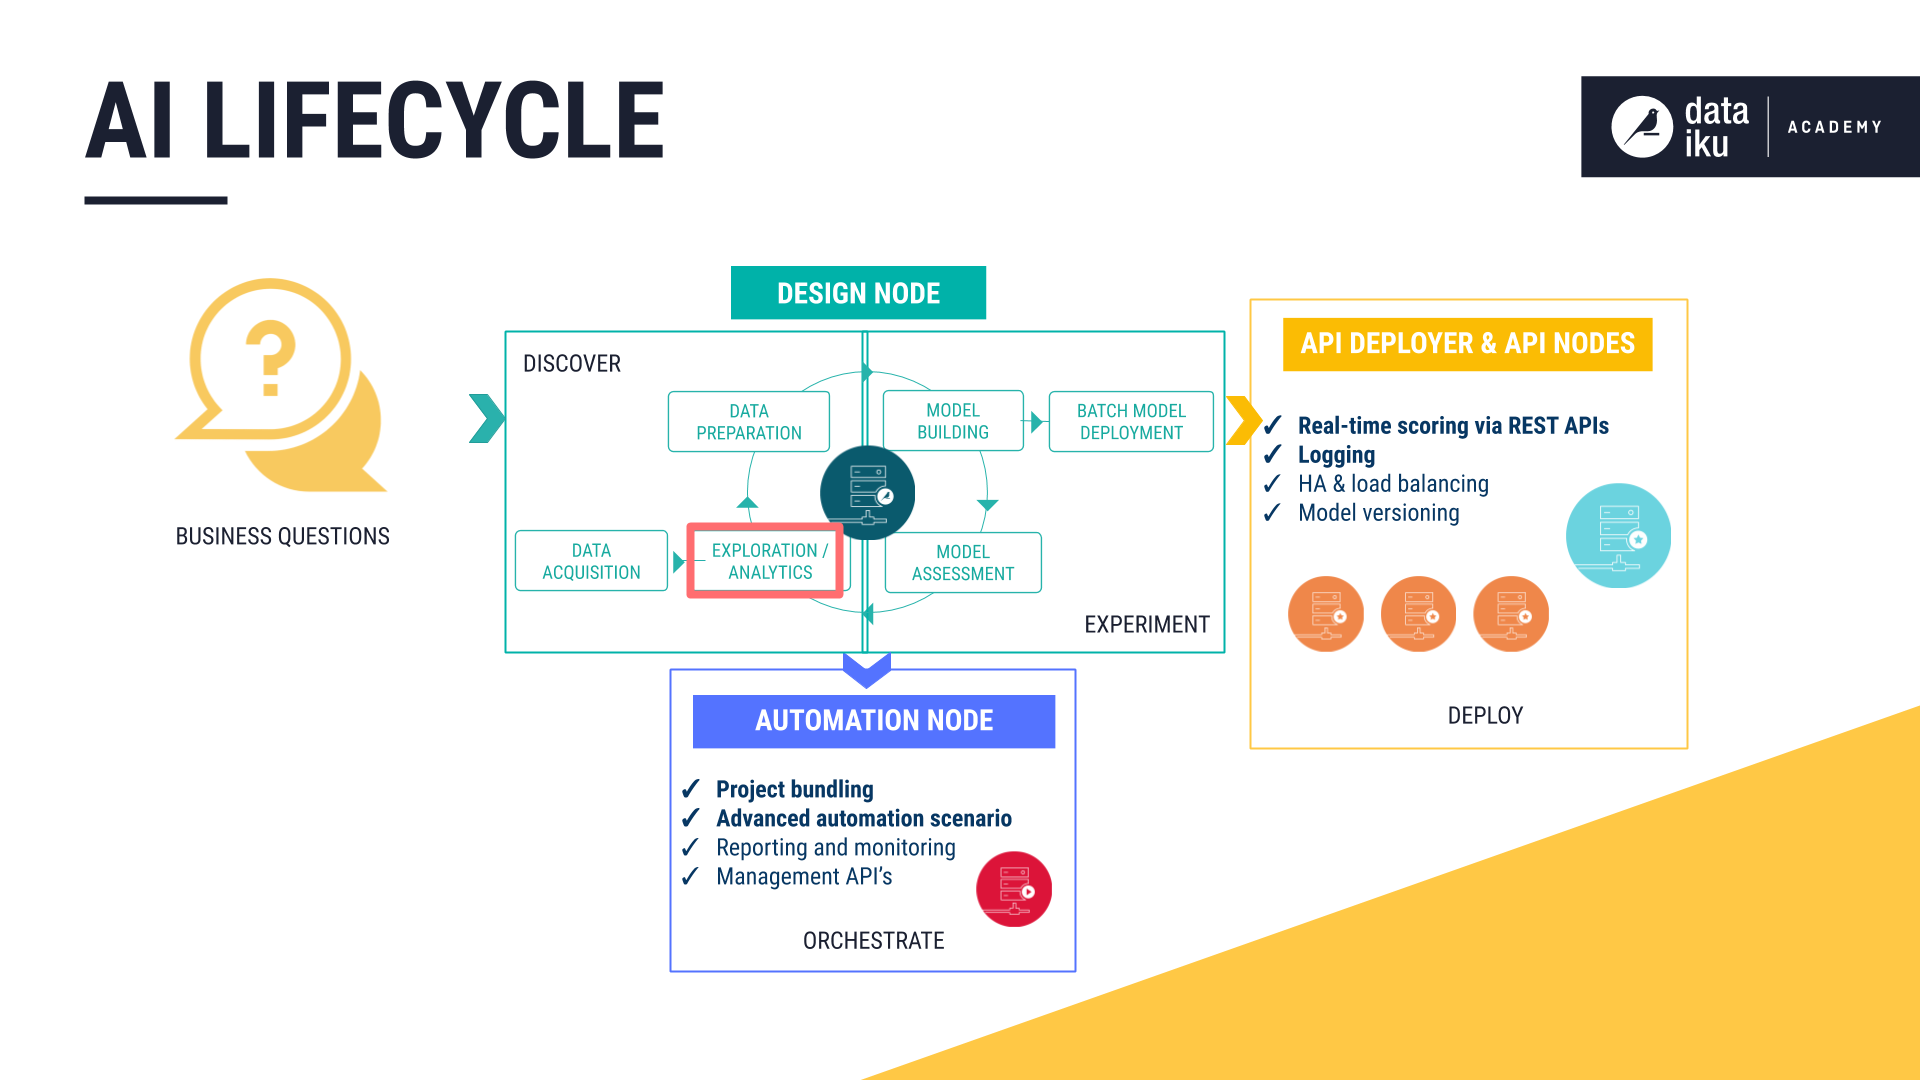
DSS allows users to quickly explore data through a visual UI or code, depending on their preference. As explained in the following lessons, this can be done from within the project’s Flow or in a separate workspace for experimentation, known as the Lab.
The Explore Tab
For any dataset, the Explore tab shows a tabular representation that will appear familiar to any spreadsheet user. However, as this is an environment built for big data, the Explore tab shows only a sample of the data. The user has full control over the design of the sample. Working with just a sample in the browser allows for quicker exploration of large datasets.
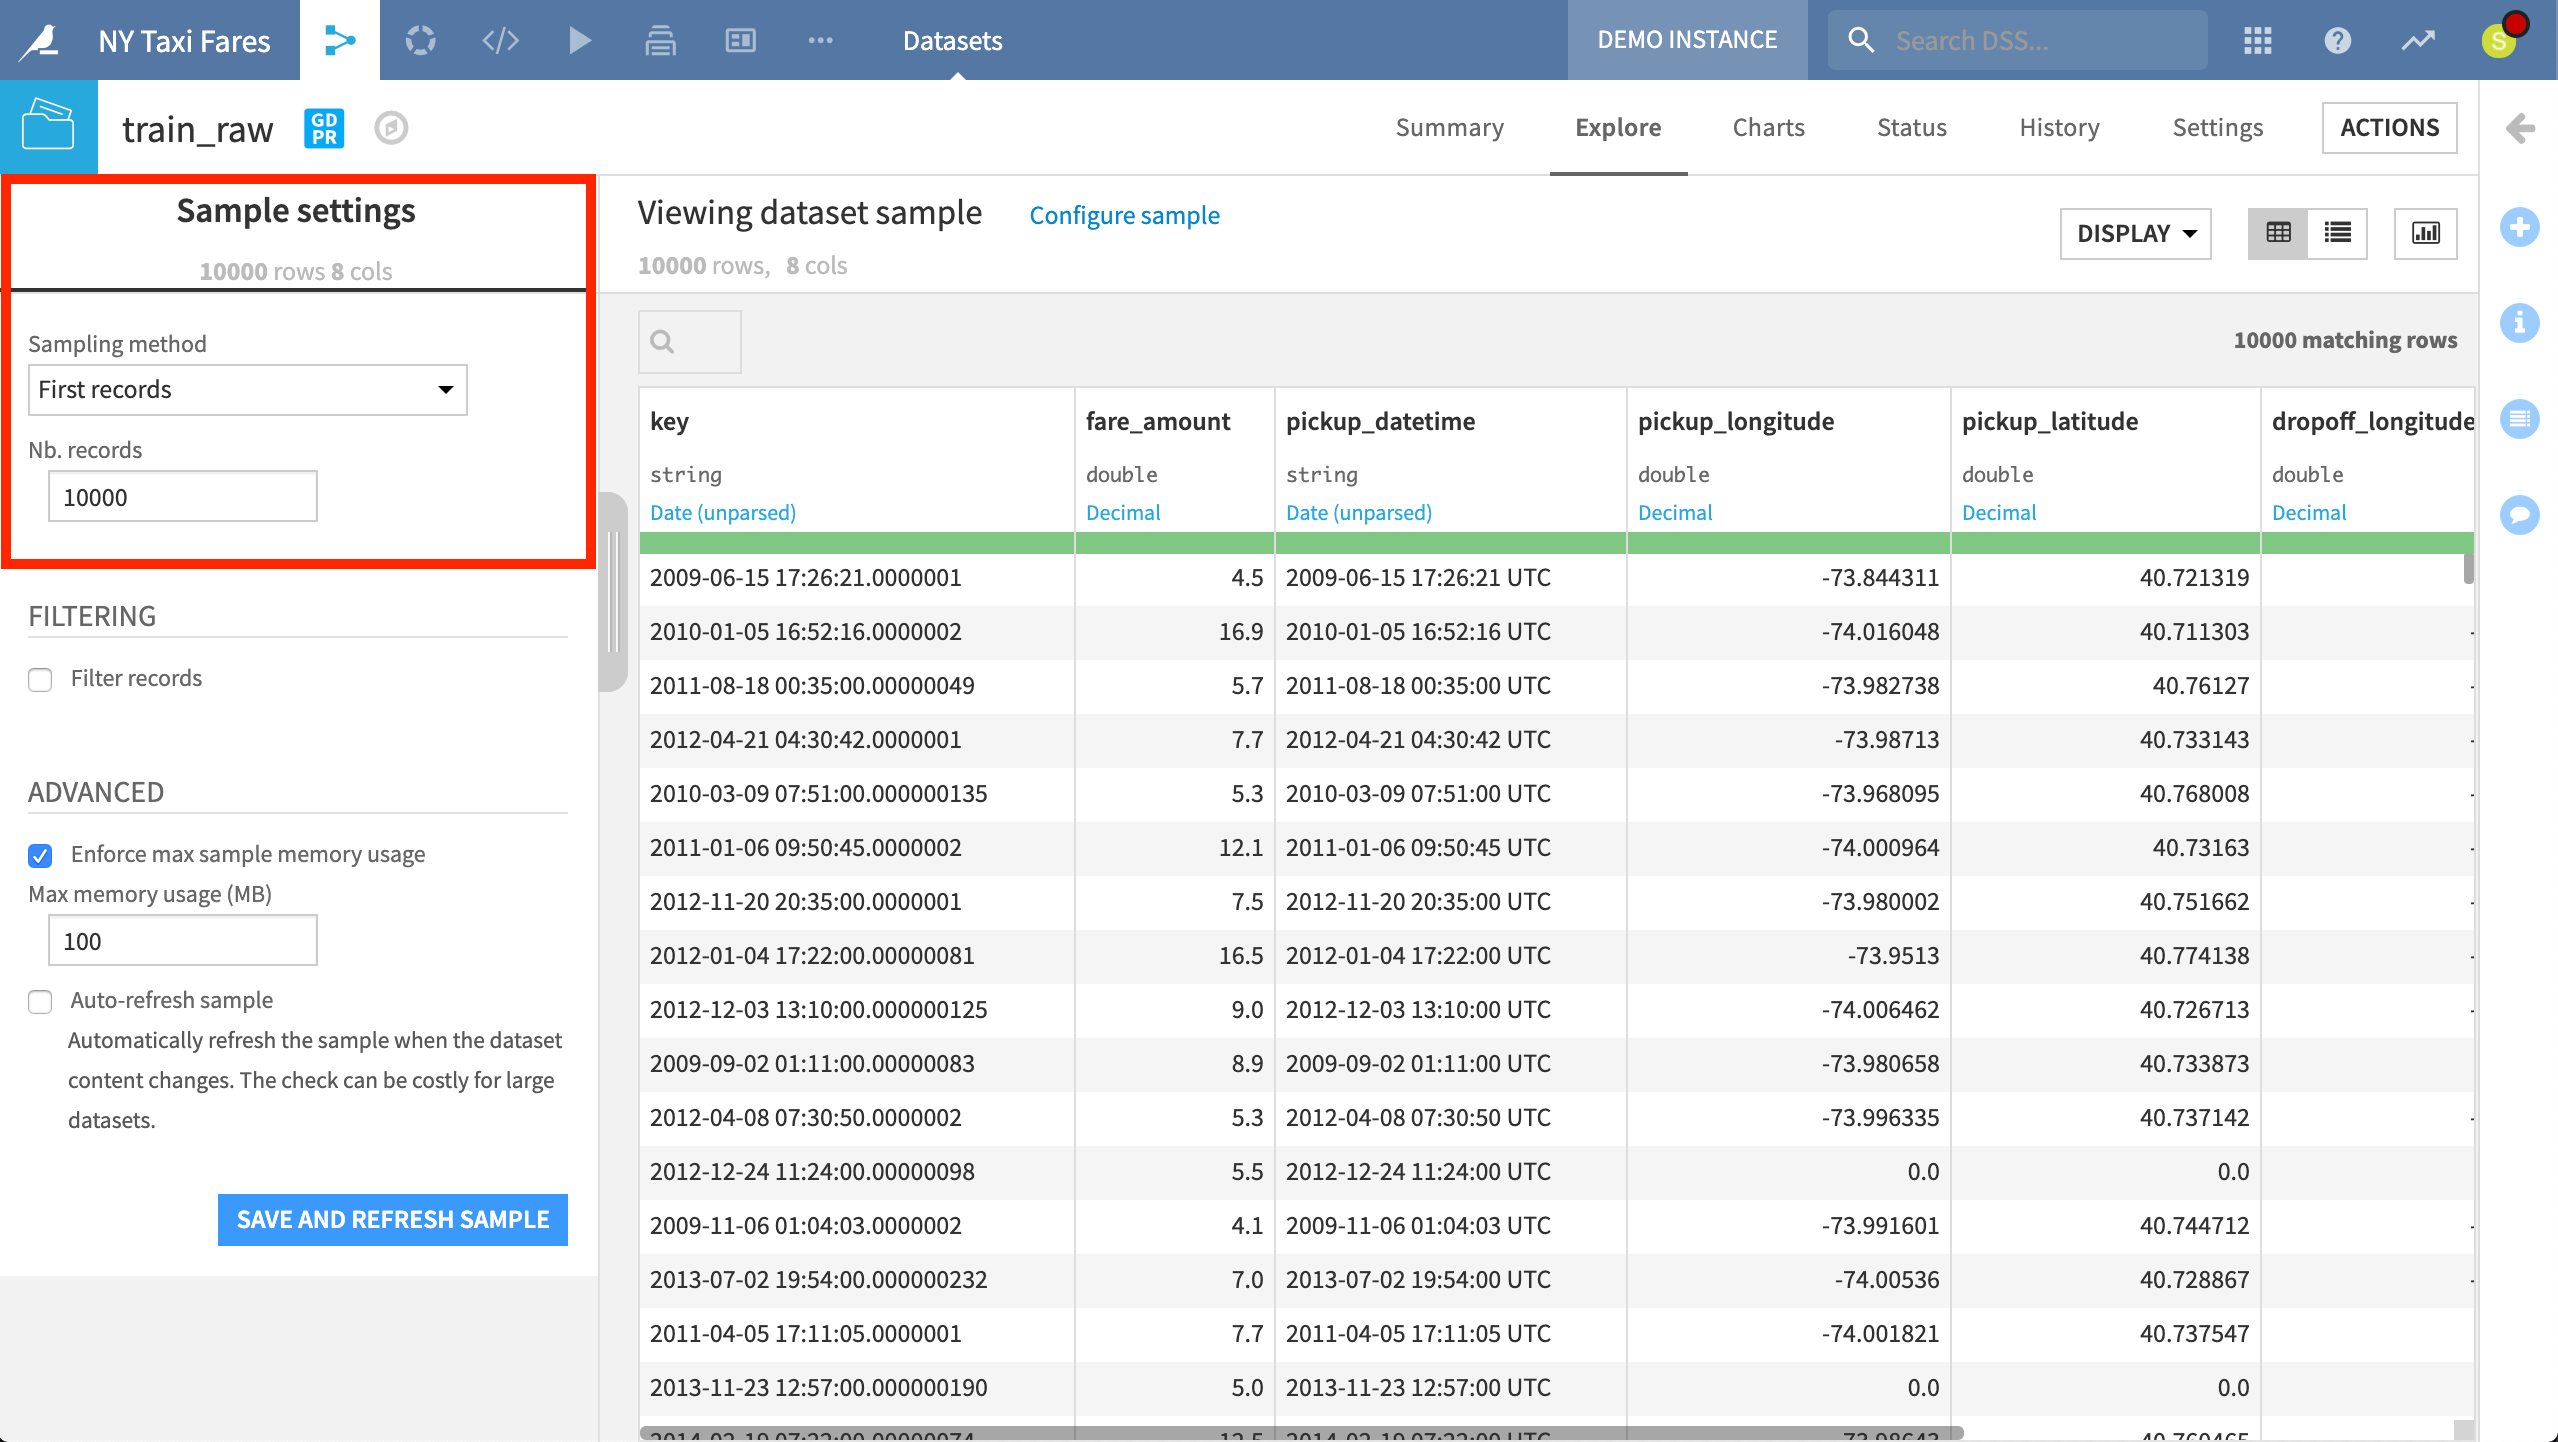
The default sample in the Explore tab contains the first ten thousand records of a dataset.
Within the Explore tab, users have access to tools like Analyze. Users need only click on a column to produce a quick summary of the column’s distribution, statistics, and outliers.
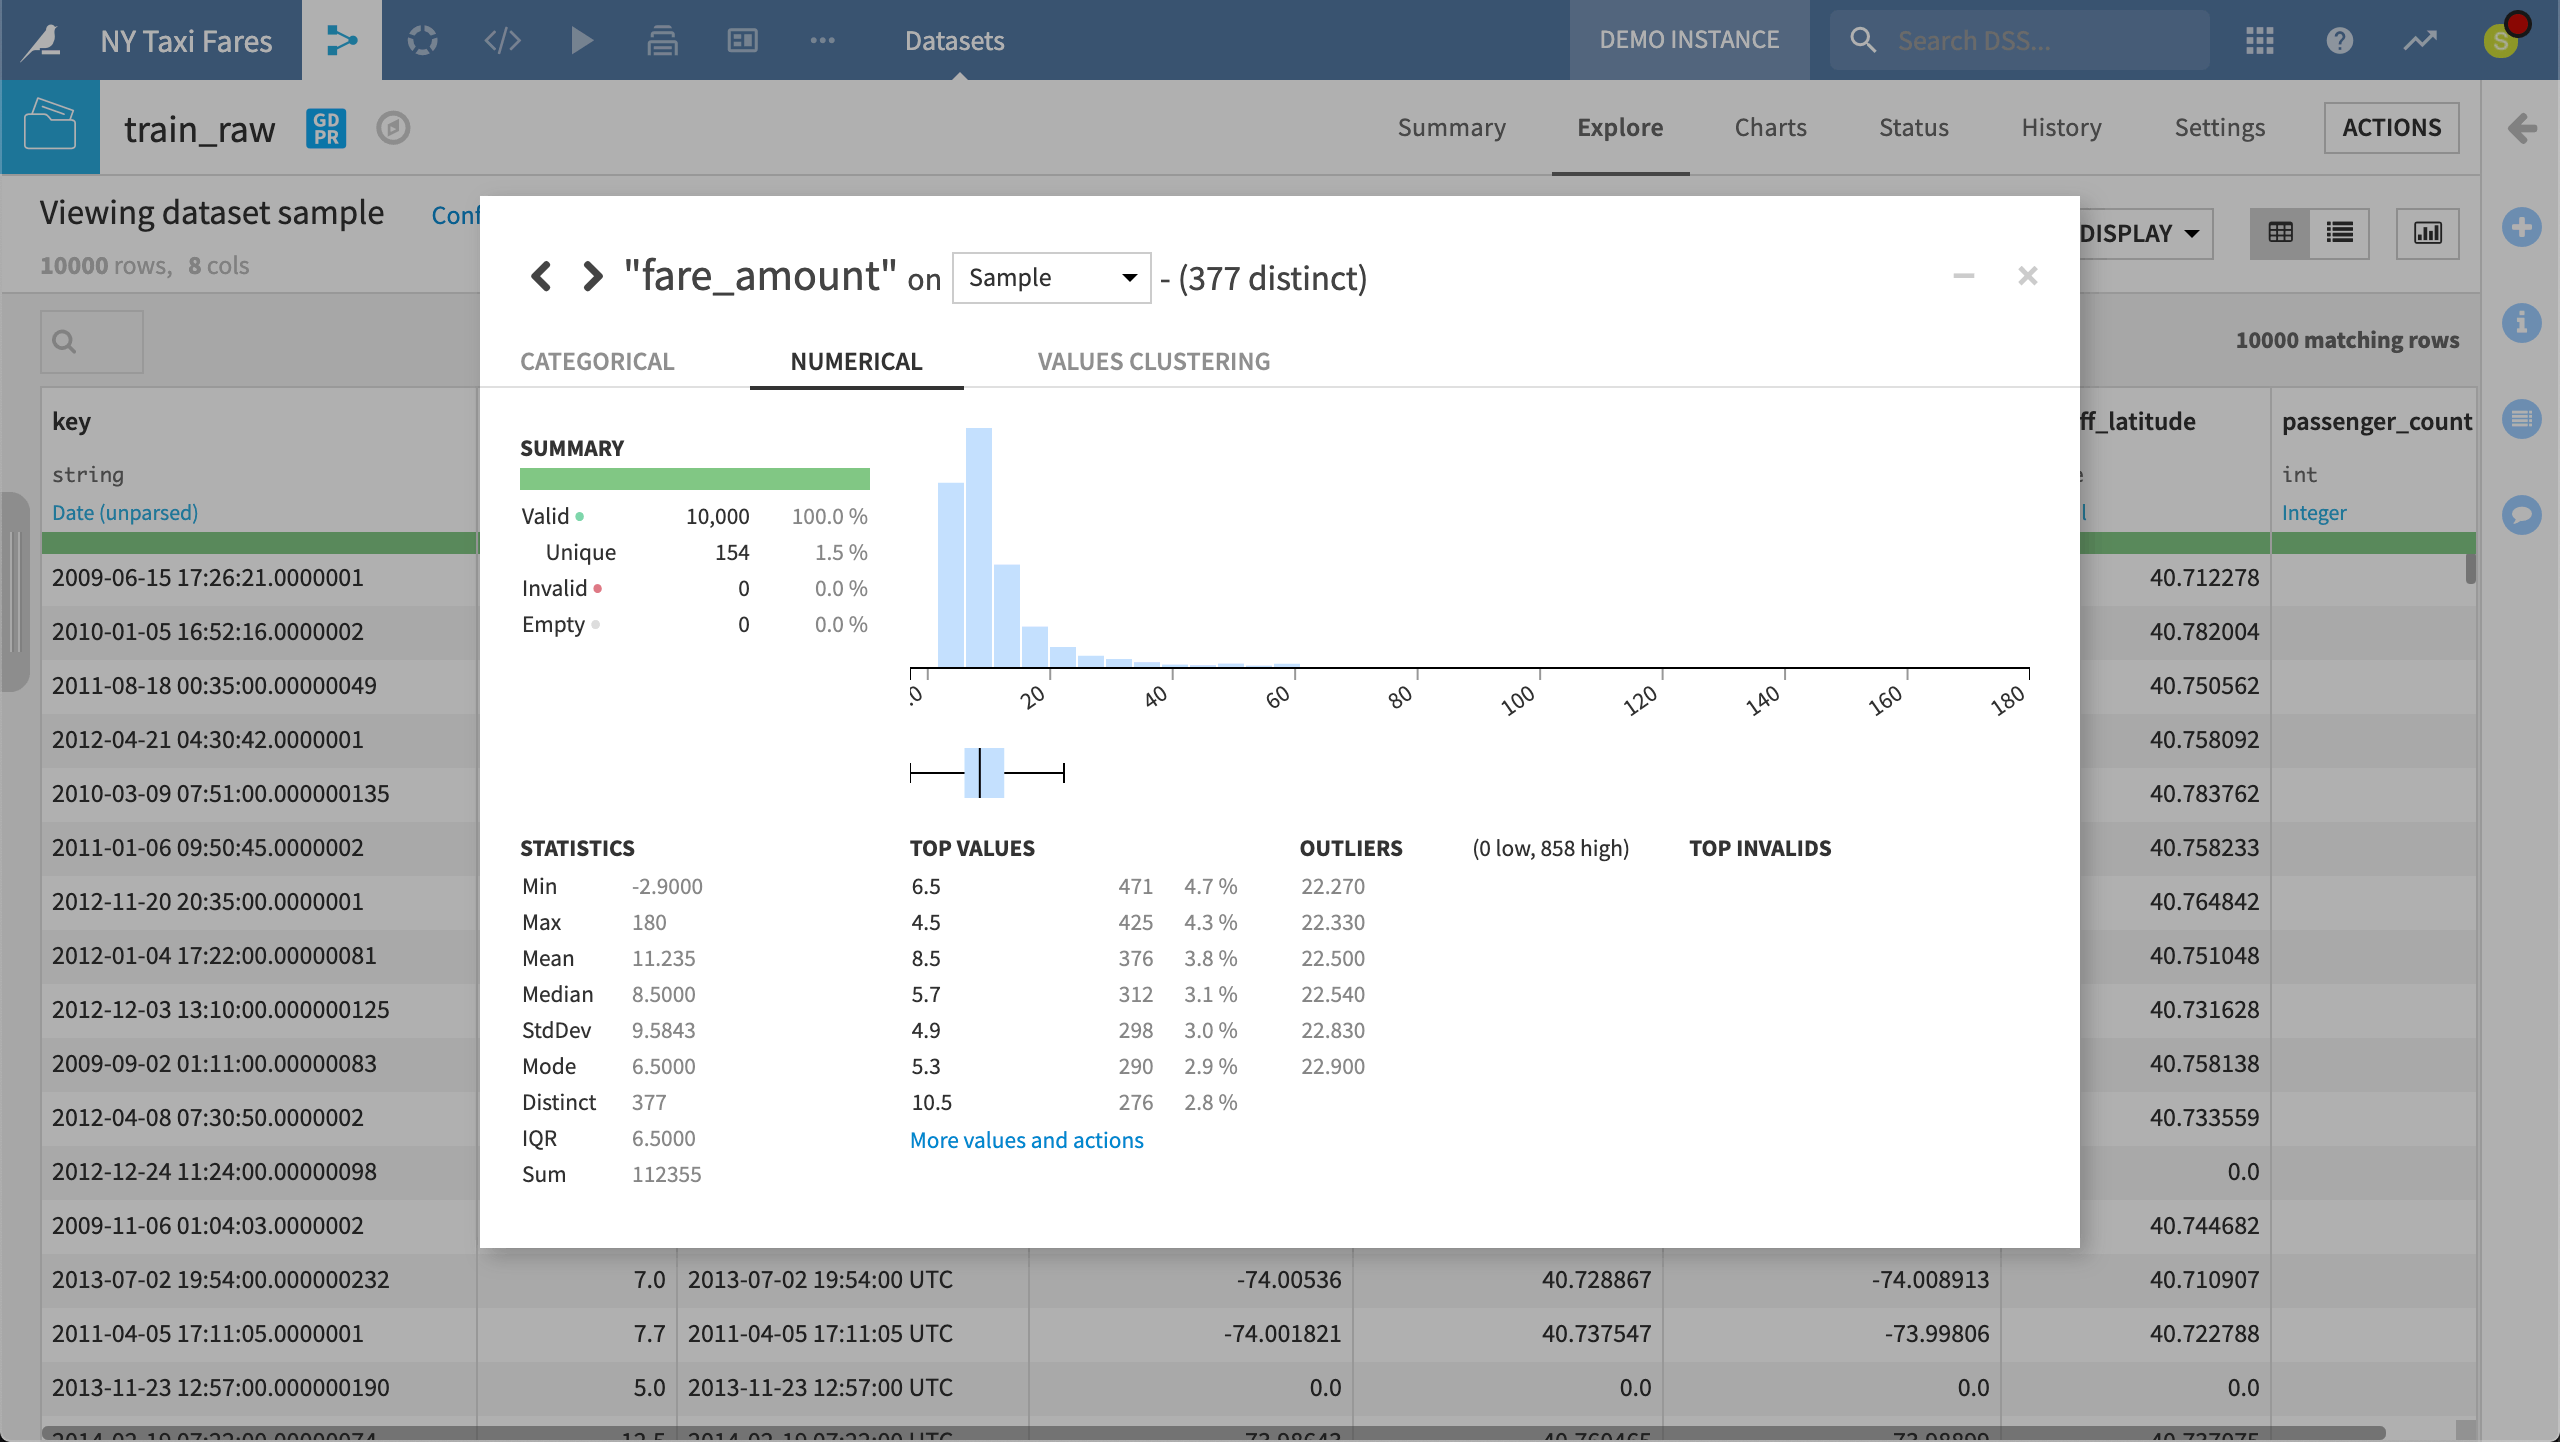
When exploring the raw training data, using the Analyze tool on the fare amount column shows the distribution and key metrics that can guide what data cleaning might be necessary. These statistics can be calculated on the sample or the whole dataset.
The Charts Tab
The ability to quickly iterate on data visualizations and share results with colleagues is a key part of any data exploration.
The Charts tab contains a drag and drop interface, allowing users to produce quick visualizations of the data in the sample. Default chart options include standard types like histograms and scatter plots, but also geographic maps.
It is also easy to save any charts as insights or publish them to a web app or dashboard through the visual UI.
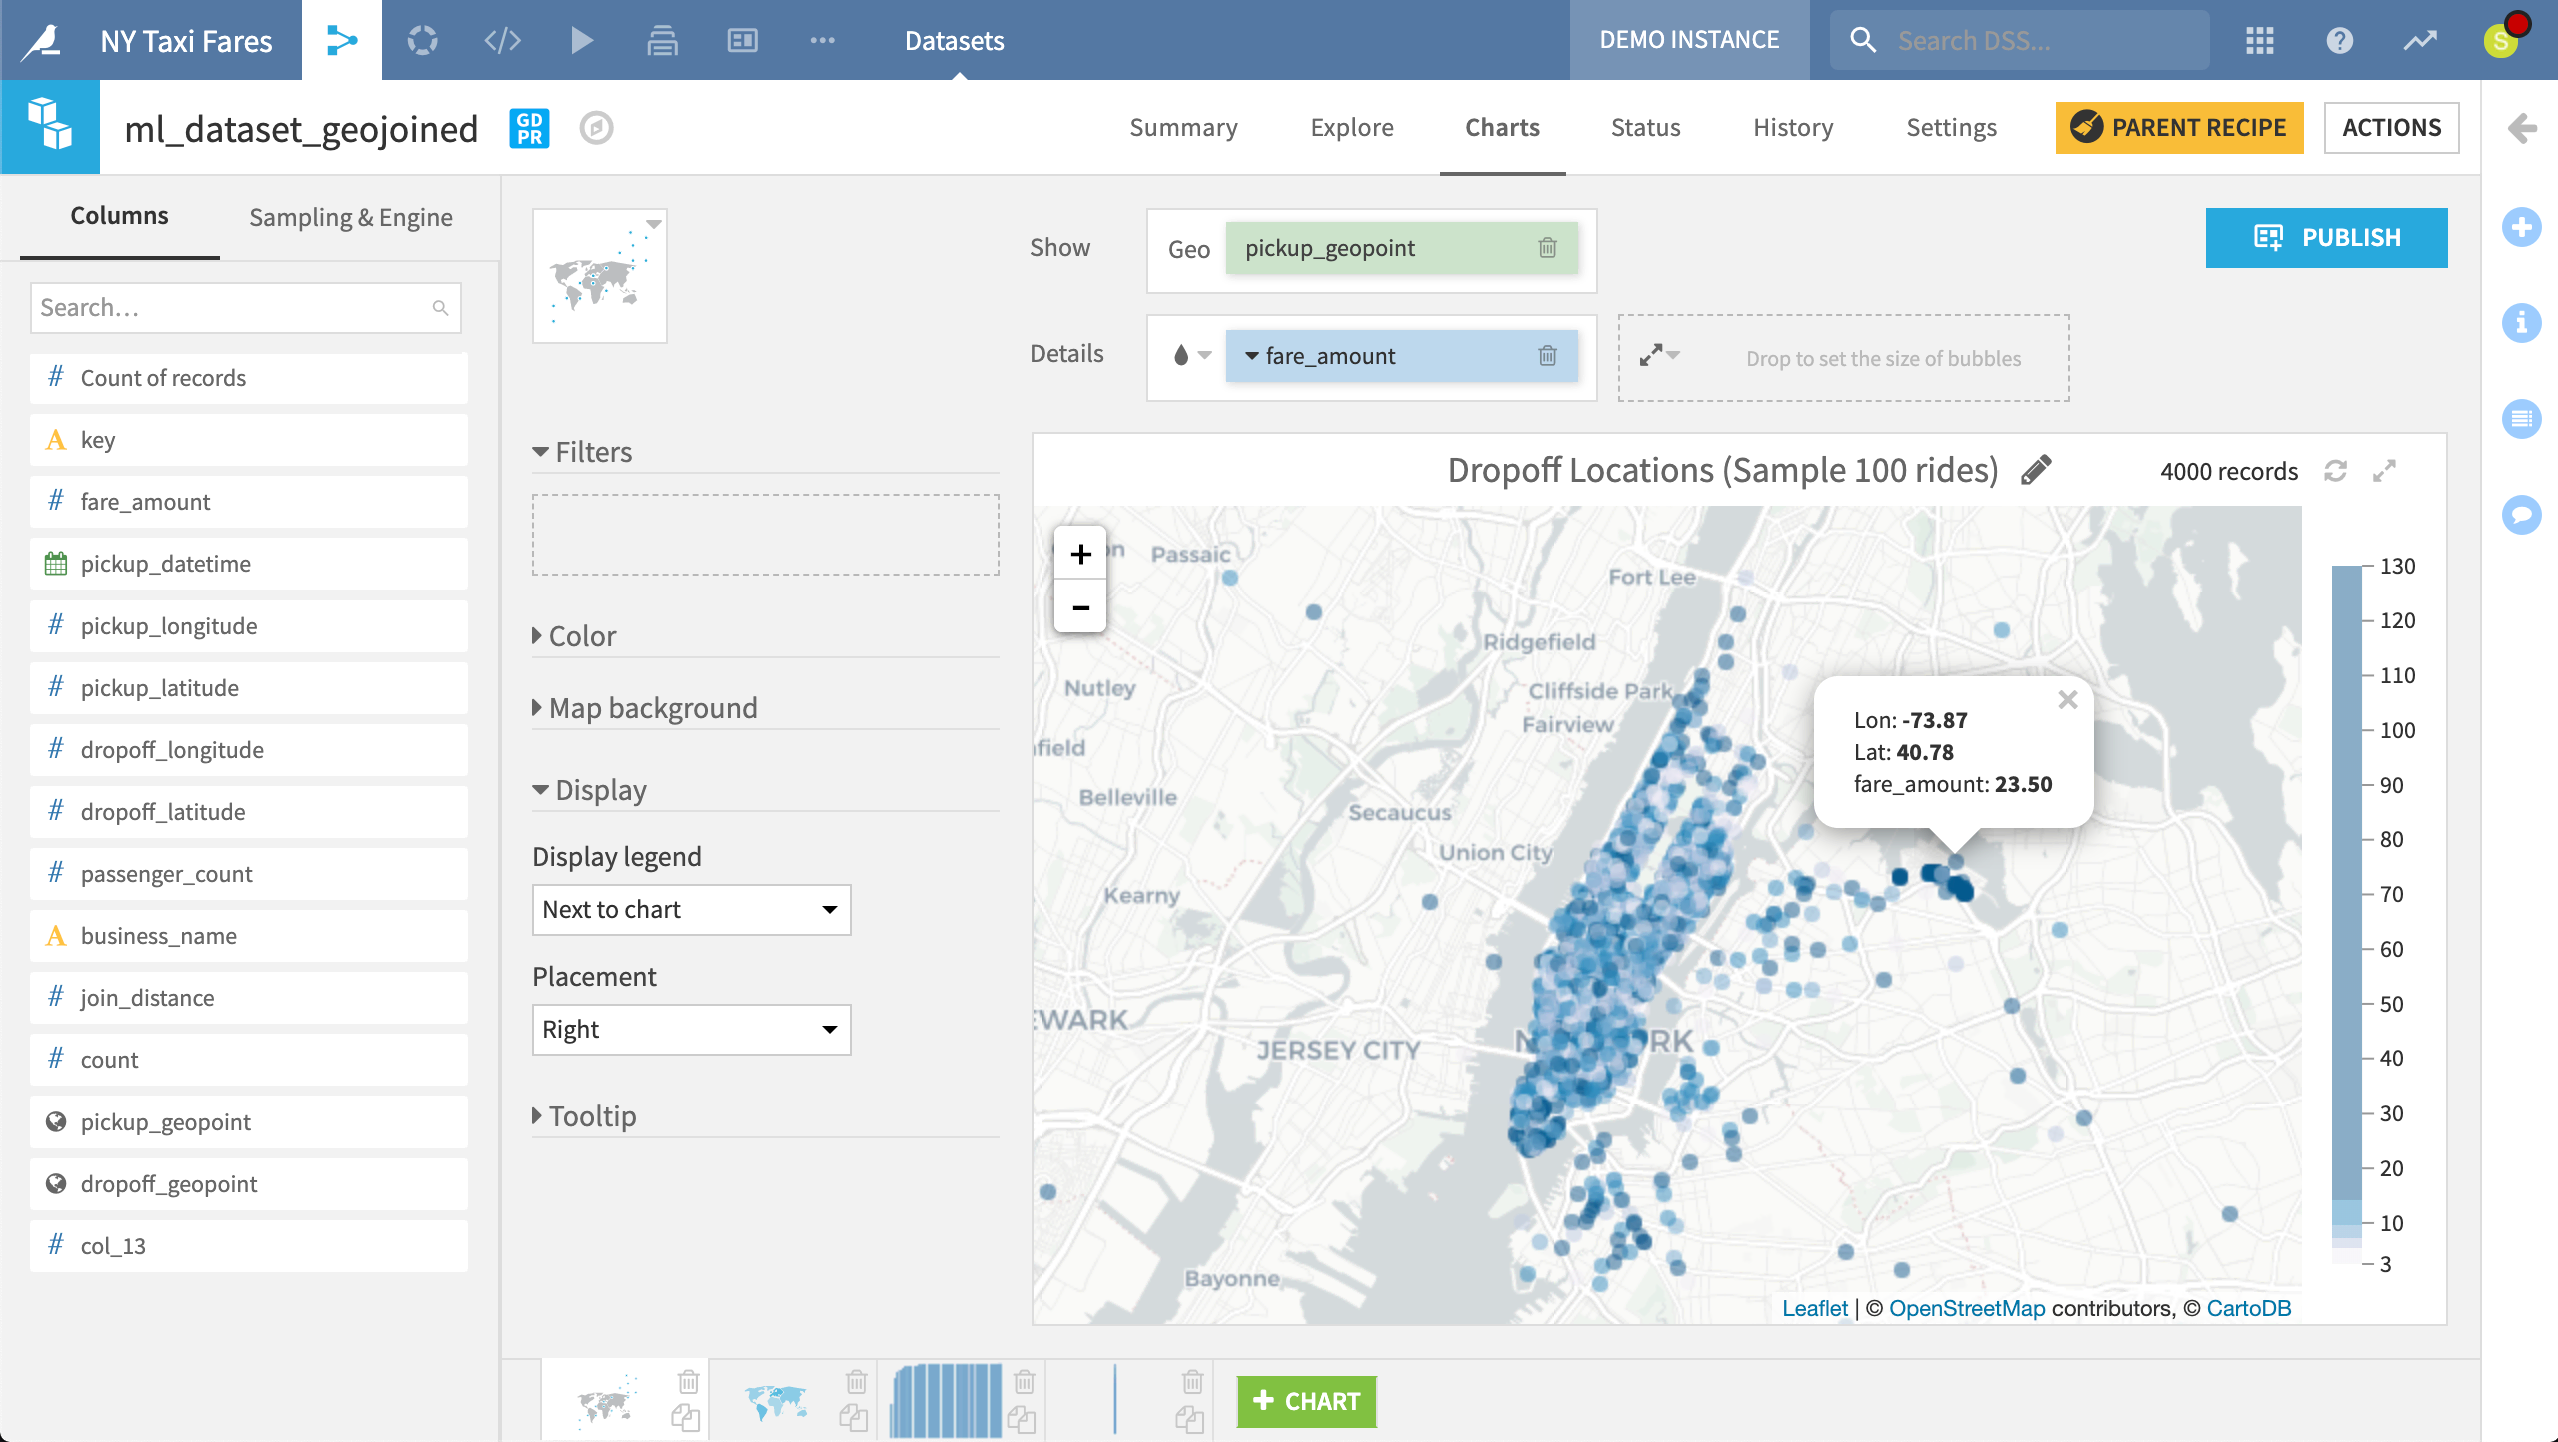
By just dragging two variables in place, we have created an interactive Leaflet map of taxi dropoff locations in New York City colored by fare amounts.
The Lab
Although it is possible to experiment directly in the project Flow, it is often helpful to have a complementary workspace to iterate between data preparation, visualization, and machine learning. The Lab is this space within DSS.
Keeping experimentation in the Lab helps avoid overcrowding the Flow with unnecessary items that will not be used in production.
As with many aspects of DSS, the choice between visual tools and code is left to the user. In the Lab, users can create a Visual Analysis or start a Code Notebook. In either case, work in the Lab can be deployed to the Flow when ready.
Visual Analyses
A Visual Analysis will appear similar to the Prepare recipe (discussed below) found in the Flow. However, a Visual Analysis is a pure “Lab” object, which does not have persistent output data. As such, columns in an analysis do not have a notion of storage types (since they are not stored). When a script is ready to be used in the Flow, it can easily be deployed as a Prepare recipe.
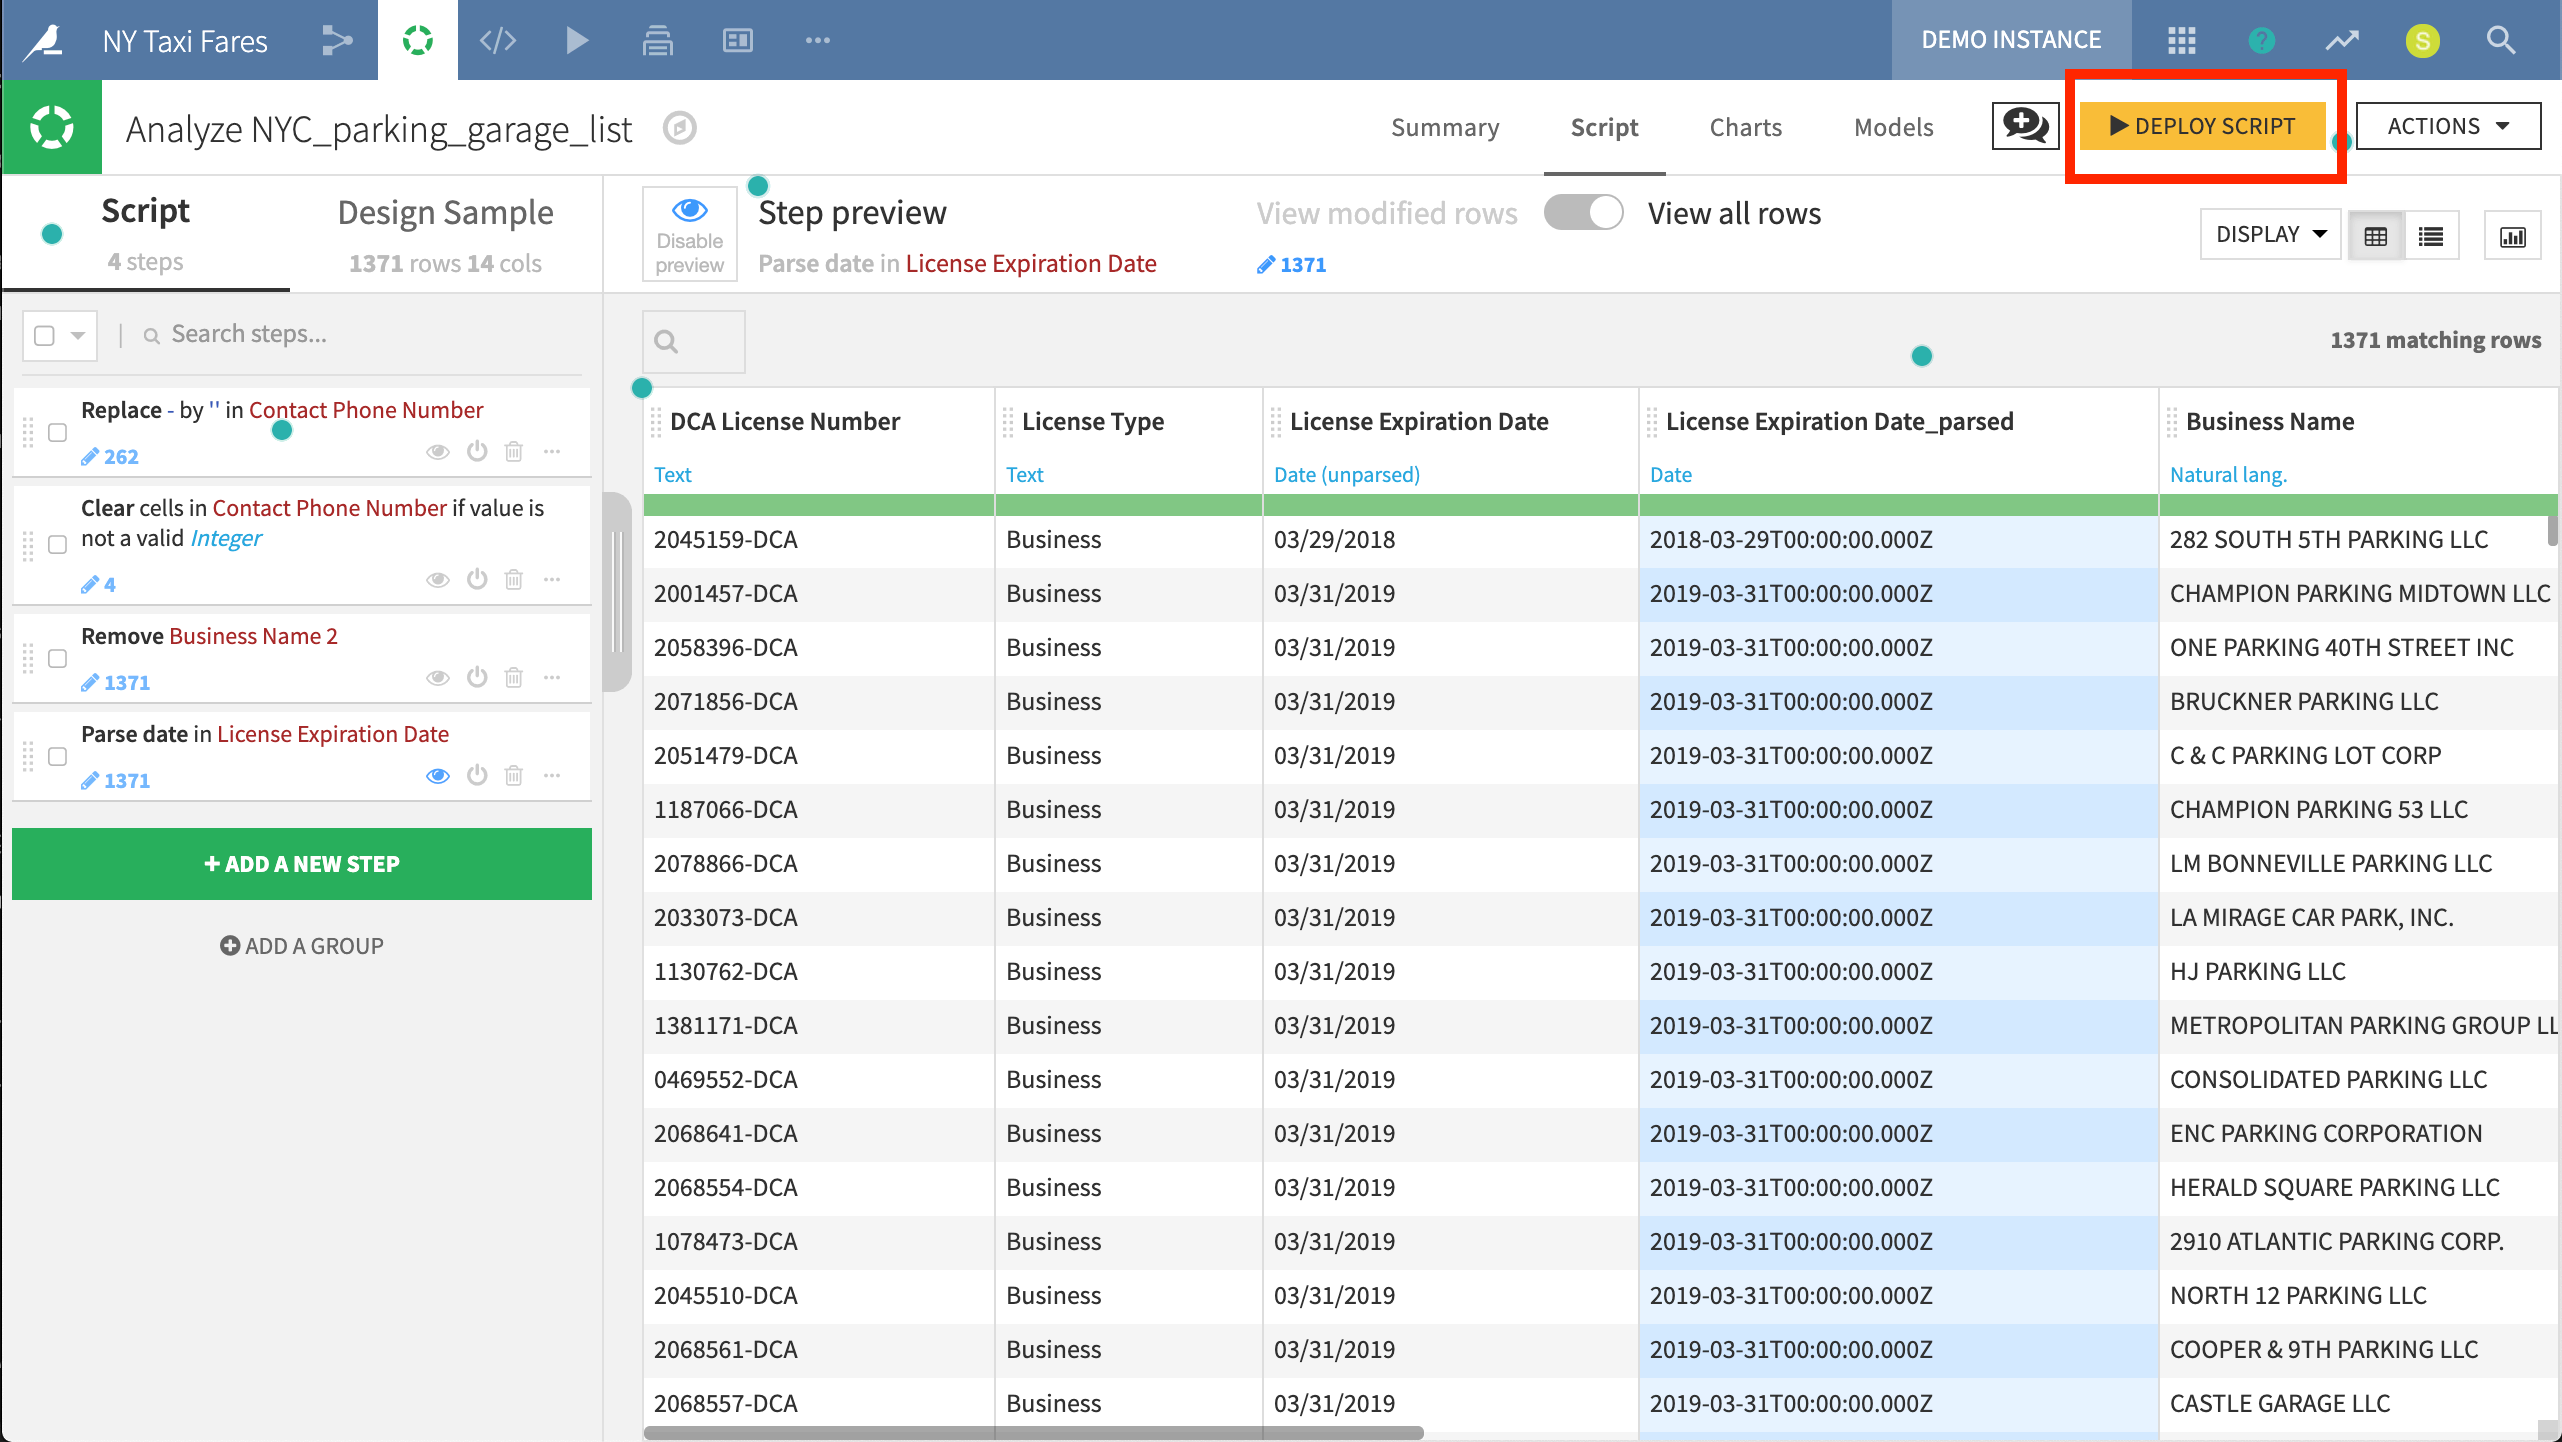
This Visual Analysis allows for experimenting on the parking garage data using any transformation in the Processors library.
Code Notebooks
Even for coders, the visual data exploration tools in DSS will often be a time saver. However, for those who would prefer to explore their data via the programming language of their choice, DSS offers interactive code notebooks. Depending on the storage of the dataset, these could be Python, R, SQL, Scala, Hive or Impala.
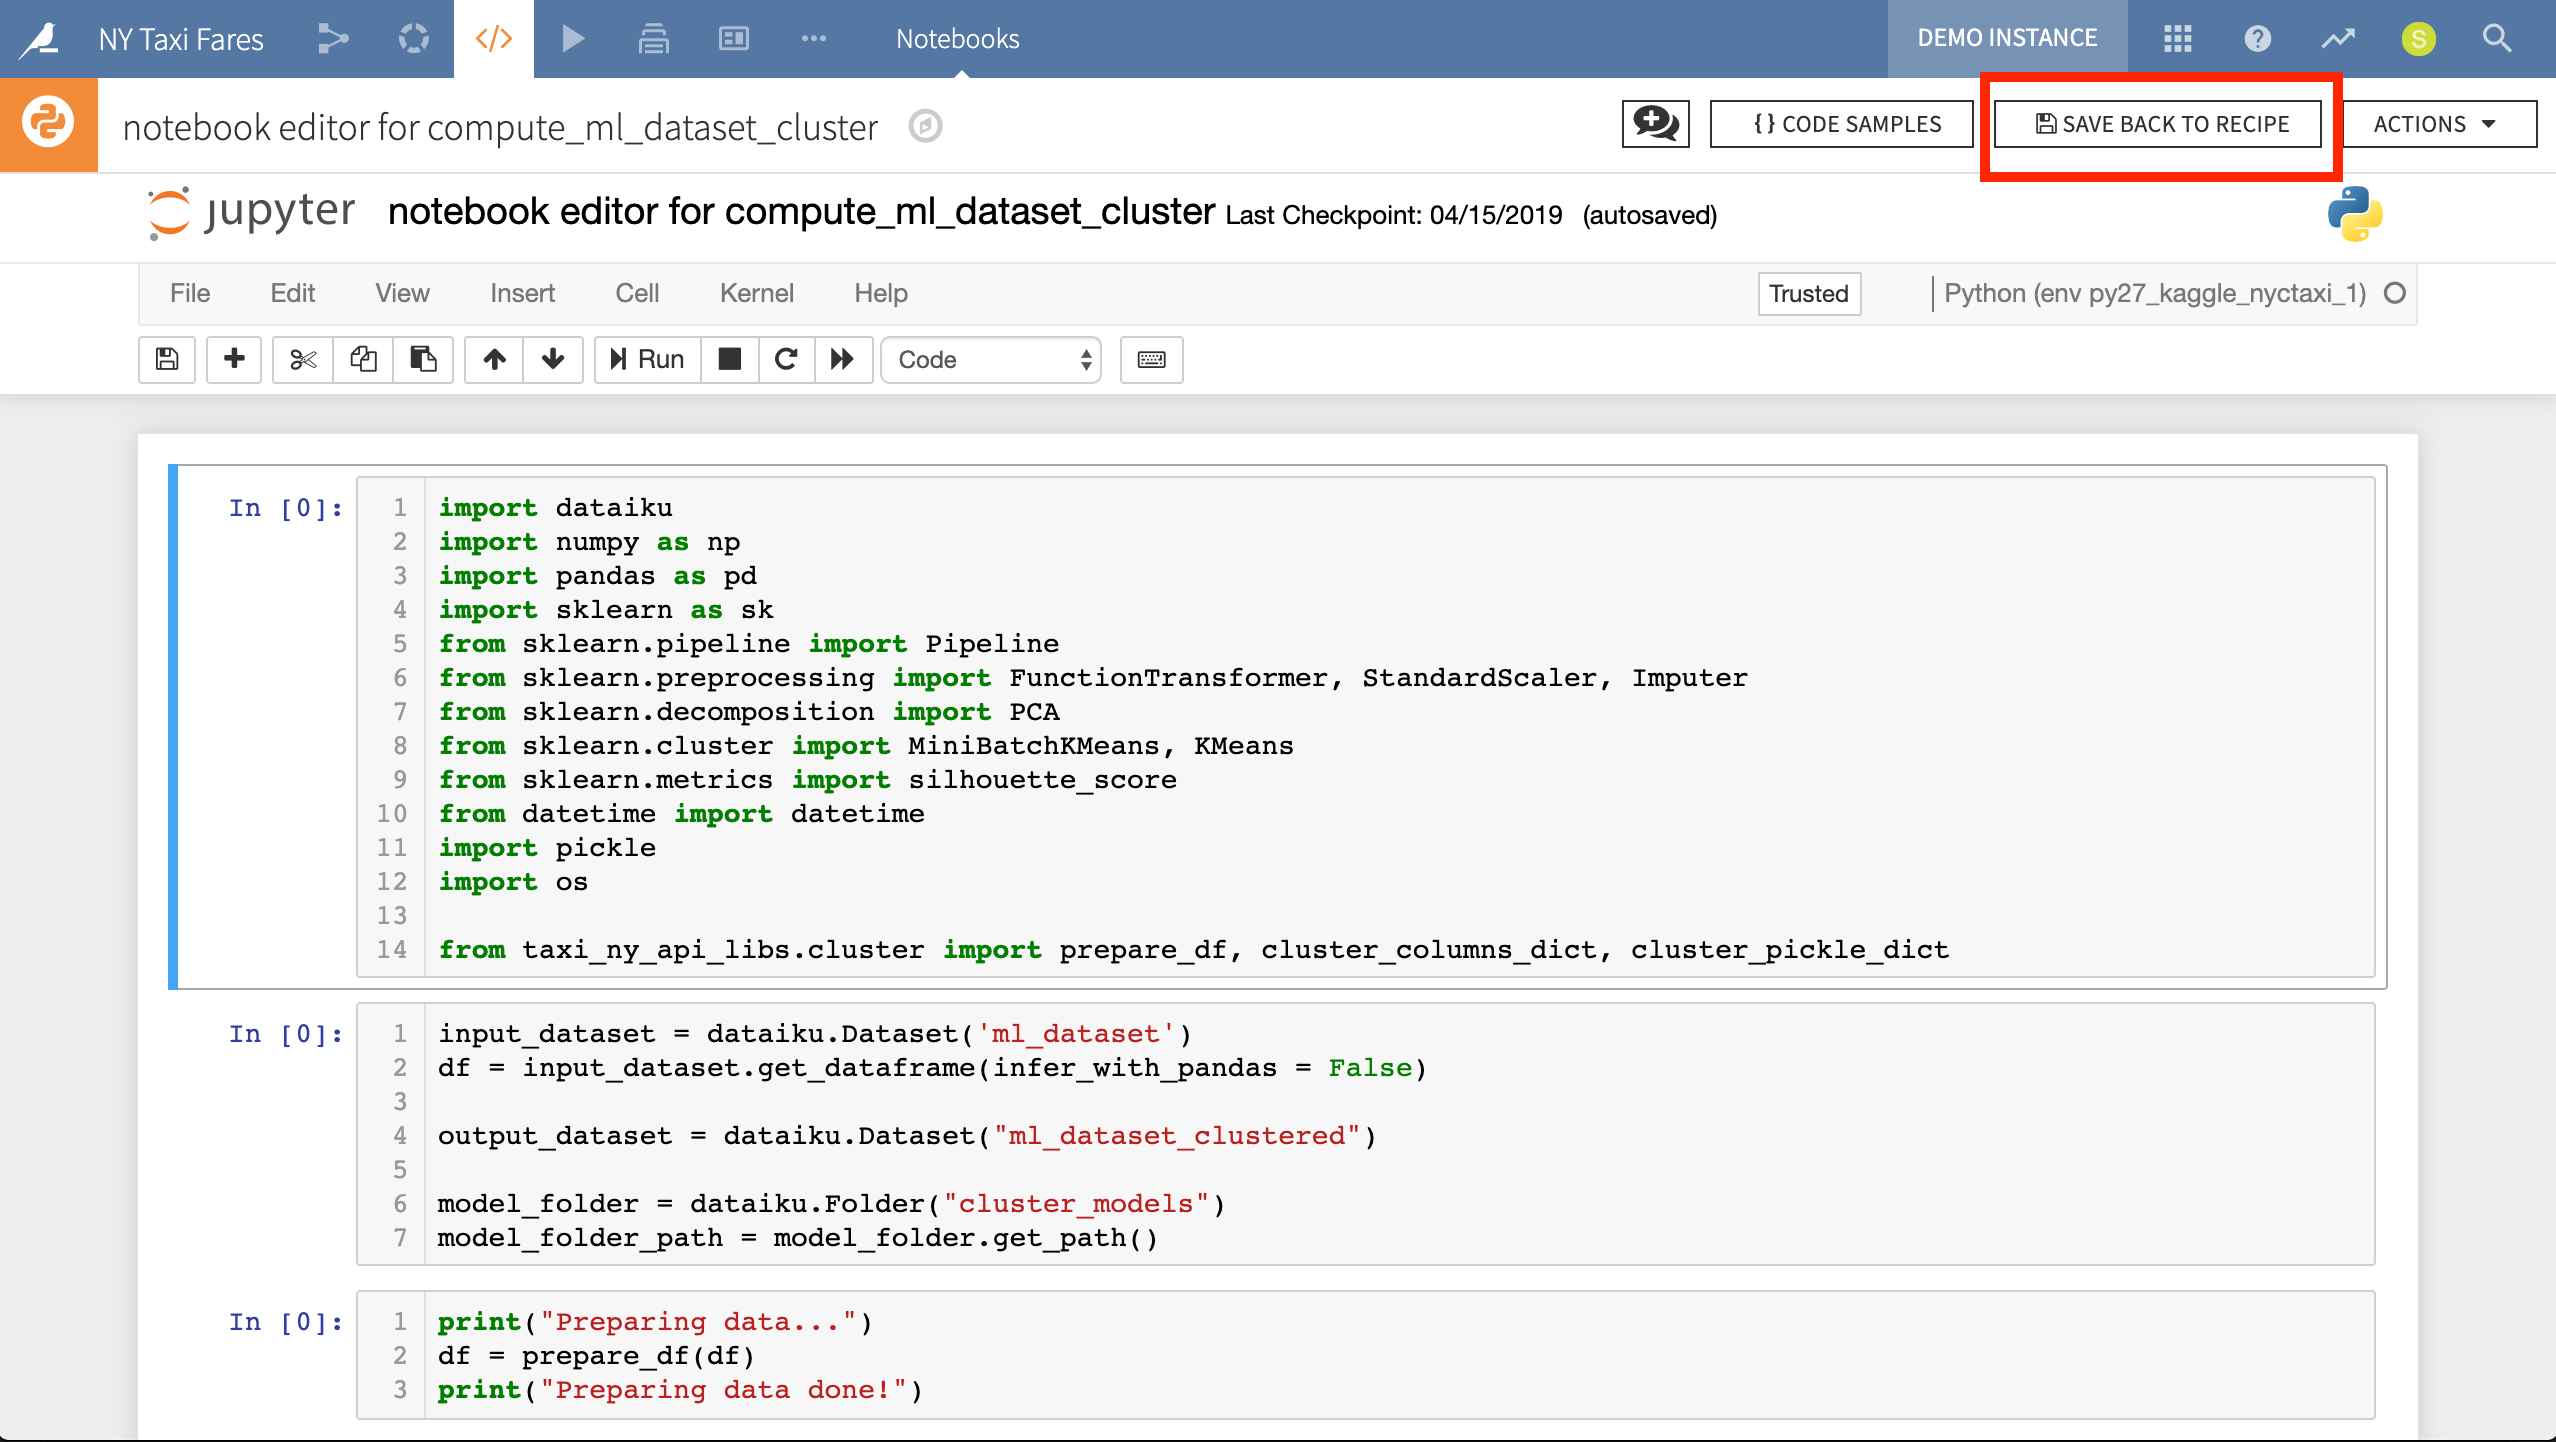
Here we have a Jupyter notebook exploring how to import clustered NYC boroughs in order to enrich the pickup and dropoff location data. We can use the notebook in an exploratory way or, as done in this project, save it back to a recipe so it can be deployed in the Flow.
Moreover, although Jupyter notebooks are integrated into the DSS interface, DSS offers integrations with several popular IDEs (integrated development environments), including PyCharm, Sublime Text, RStudio, and VS Code. After configuring a connection between the IDE and their DSS instance, these integrations allow developers to pull code from existing DSS recipes and plugins into their IDE. After editing the code in their IDE, they can save it back to the recipe or plugin.