Optimizing Omnichannel Marketing in Pharma
Overview
Business Case
Like any business, pharmaceutical companies depend on strategic marketing campaigns to increase the reach and knowledge of their products, and ultimately boost sales. Modern marketing benefits from the usage of multiple channels of messaging to inform health care providers (HCPs) in a variety of ways.
Omnichannel marketing must be leveraged in an informed manner (i.e powered by data) so that HCPs can be targeted using the most effective channels (emailing, phone calls, online ads), the most impactful contents (focused on products vs. informative) and at the right time.
The solution consists of a data pipeline that uses a combination of descriptives, statistics, and machine learning. Analysts can input their own data and surface the outputs in a dashboard in order to gauge the previous and future success of pharmaceutical marketing strategies. Data Scientists should use this sample project as an initial building block to develop advanced analytics / support decision making.
Technical Requirements
To leverage this solution, you must meet the following requirements:
Have access to a DSS 9.0+ instance
Access to a compute engine capable of processing a full outer join
Note
The built-in DSS streaming engine will not work
Installation
If the technical requirements are met, this solution can be installed in one of two ways:
On your Dataiku instance click + New Project > Sample Projects > Solutions > Optimizing Omnichannel Marketing in Pharma.
Download the .zip project file and upload it directly to your Dataiku instance as a new project.
Data Requirements
We will work with a fictional pharmaceutical company called Haiku Pharma, and use their data to illustrate the steps to identify key drivers of drug adoption. This project is built using the following datasets which were taken from disparate data sources, and synced to the same database:
Product_Sales: This dataset contains weekly product sales over two years for each hospital in the provider network.
Accounts: The accounts table is unique at the specific health care provider level (variable account_id) at a given hospital or clinic (variable parent_account_id).
Each record has information on the HCP such as main specialty, tenure, and last training date.
Marketing Outreach datasets detail the type of interaction with an HCP for a given date over the past two years. These datasets come from typical CRM databases, web log analytics, and email open/click-thru datasets.
Web Traffic
Calls Data
Campaigns
Product_Brand: A lookup between product_id and the market name for a drug.
Workflow Overview
You can follow along with the solution in the Dataiku gallery .
Note
This project is meant to be used as a template to guide development of your own analysis in DSS. The results of the model should not be used as actionable insights and the data provided with the project may not be representative of actual data in a real-life project.
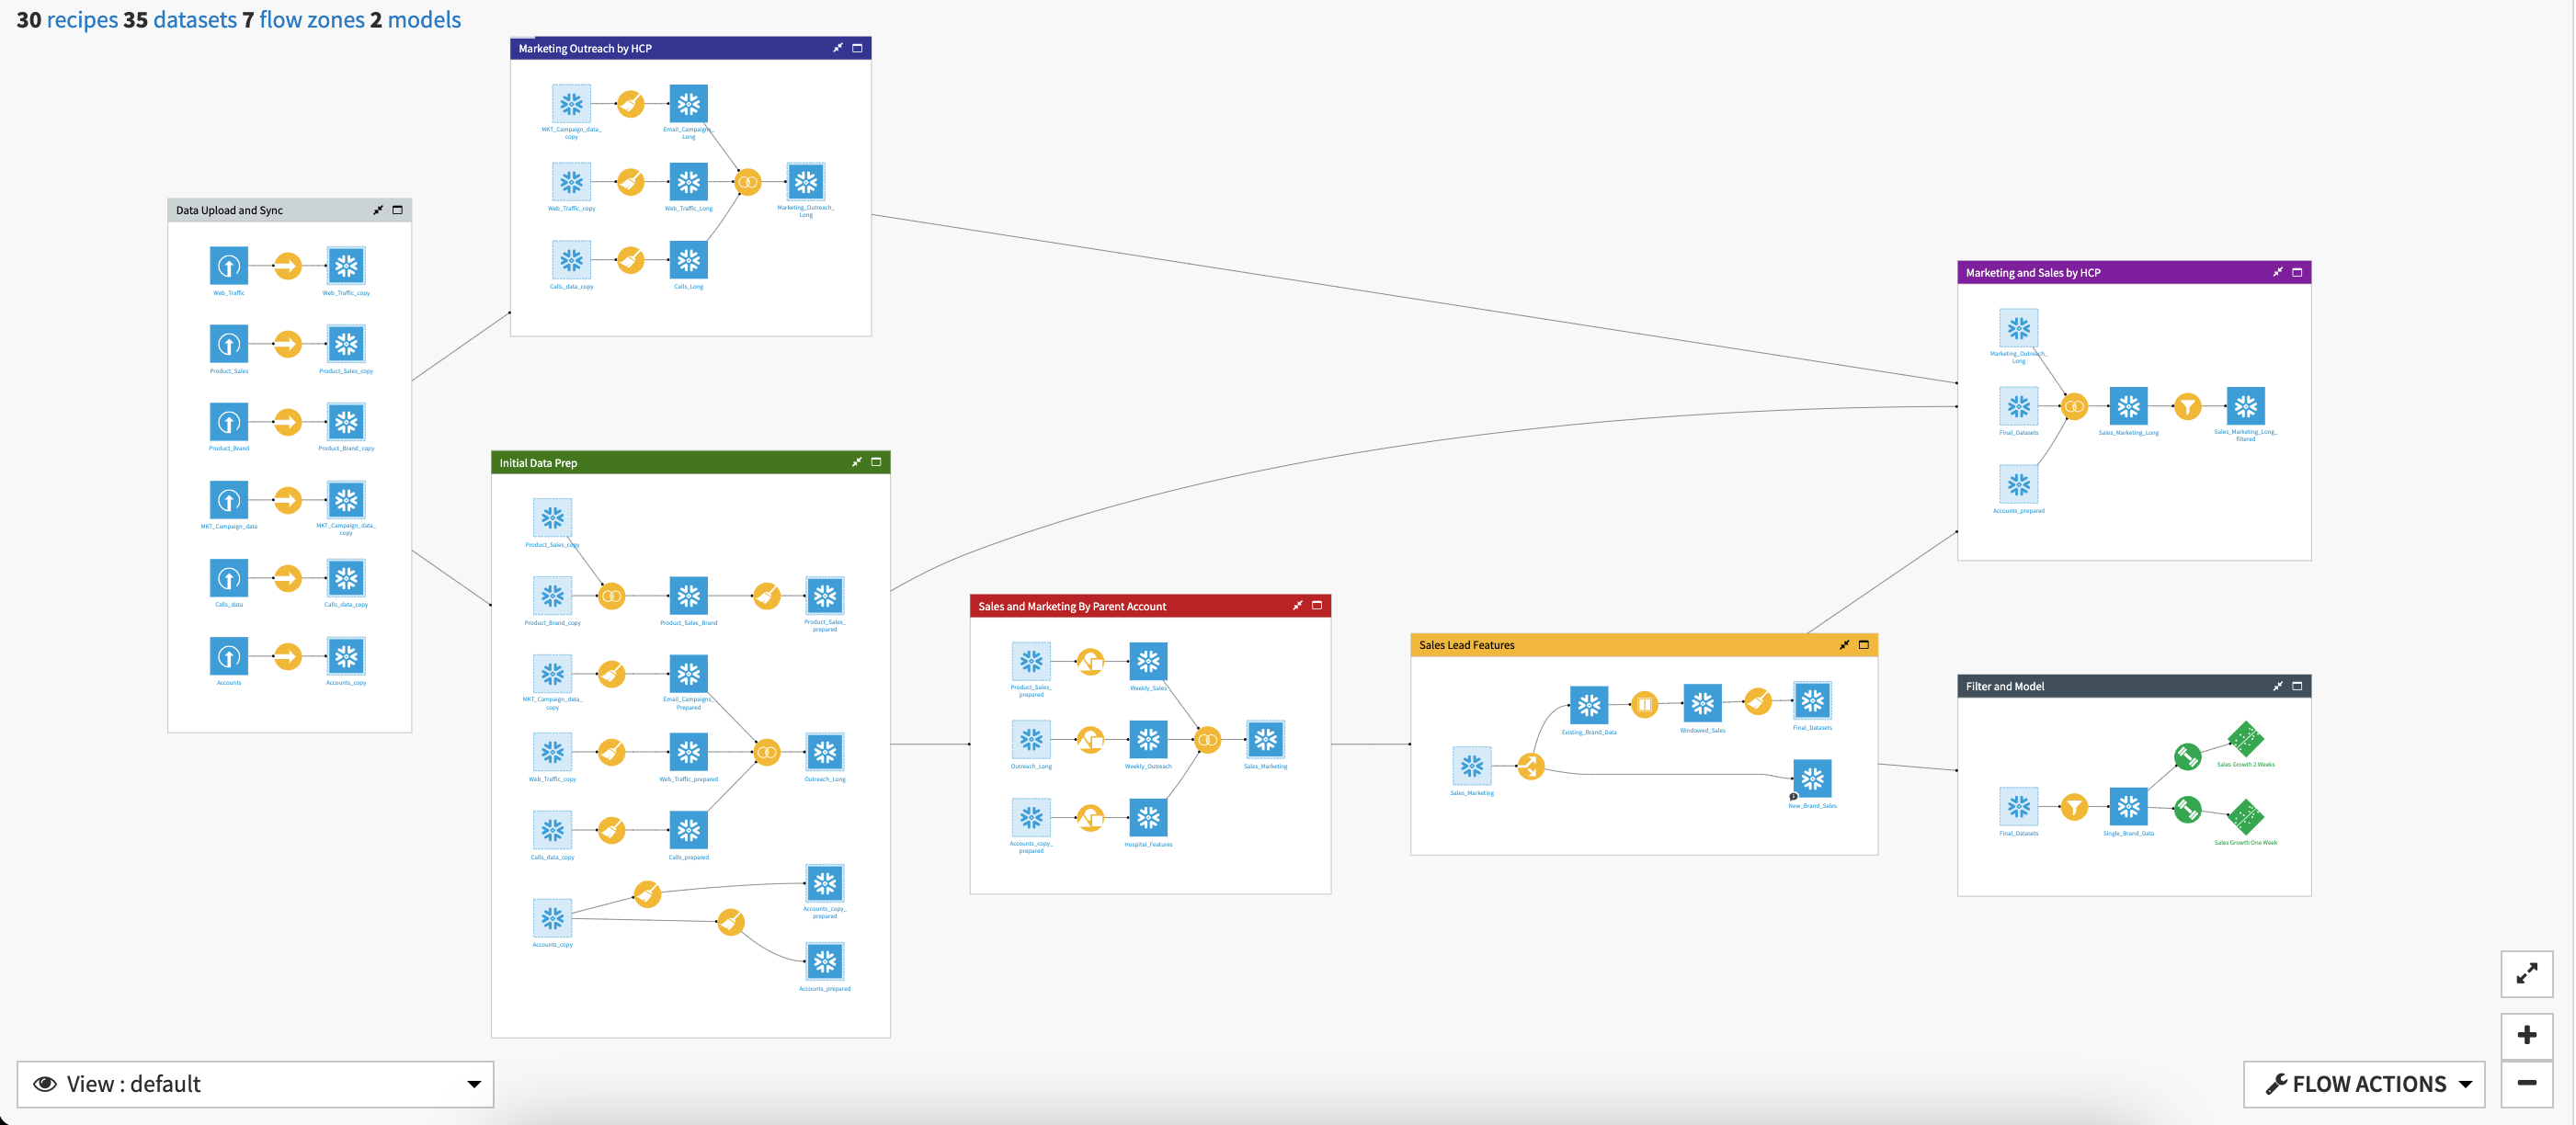
The project has the following high level steps:
Prep the data and aggregate by account
Relate marketing outreach to future sales
Train models to correlate marketing outreach and sales
Visualize our outputs to impact marketing decisions
Analyze new products with a Dataiku Application
Walkthrough
Note
In-depth technical details can be found in the wiki of the project.
Blend, analyze and create insights from disparate data sources
Before we blend product sales, account, and marketing data we need to do an initial cleanse and join our input datasets.
To begin, we combine Product_Sales and Product_Brand in order to add the brand (e.g. market name) of each pharmaceutical to the raw sales dataset to create Product_Sales_Brand. We clean up this new dataset further in order to remove sales of pharmaceuticals without market names, and extract date_year and date_week for each remaining sale.
In parallel, the 3 outreach datasets (Web_Traffic, Calls_Data, and Campaigns) are cleaned and a date_year and date_week are extracted for each outreach event in all 3 datasets. Additionally, we extract information about engagement, content, and classification of the outreach that are represented as binary values.
After creating binary values for the categorical data, all 3 datasets are joined together using a full join.
Finally, the Accounts data is prepared by turning categorical information about each HCP (account_id) into binary values and weeks since an HCP received product (i.e. pharmaceutical) training are computed.

With our initial data cleaned and having gone through a first set of preparation, we are ready to begin aggregating our data.
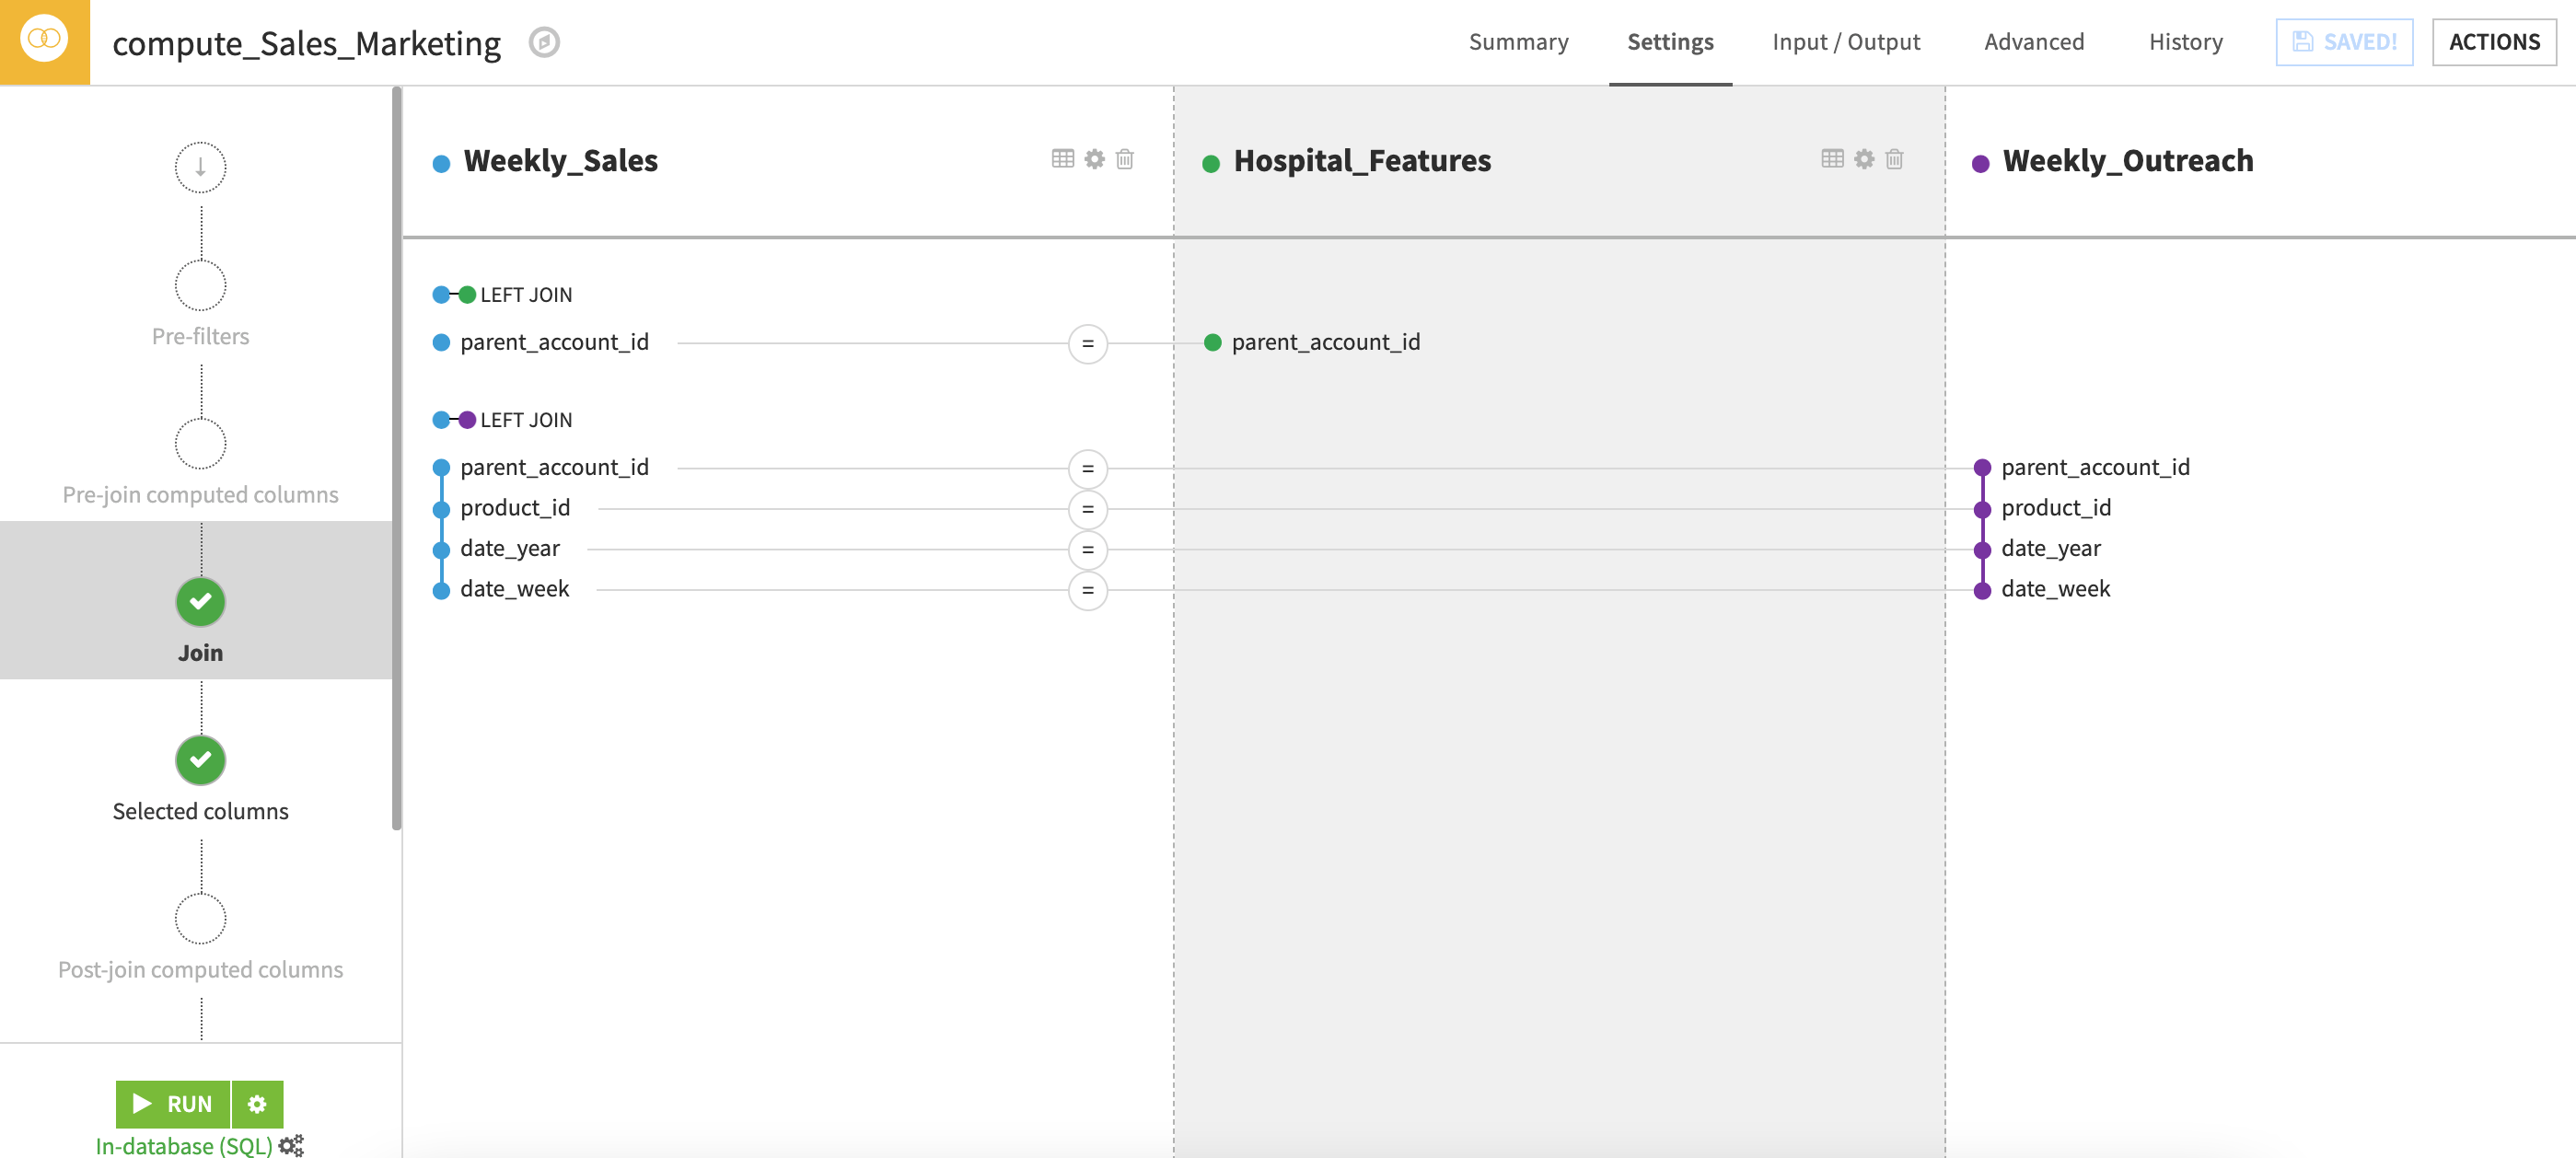
Before joining the sales and marketing data, we need to group our 3 datasets (Product_Sales_prepared, Outreach_Long, Accounts_copy_prepared) by parent account since that is the level at which we have sales data.
After individually grouping the datasets, we can execute a left join - this time adding all available marketing outreach to the more complete sales dataset. Additionally, the hospital information is added in as additional features for each parent account.
Relate marketing outreach to future sales
Having joined our marketing and sales data, we can move onto our final feature engineering phase in order to create our outcome of interest - sales lead. Why is having a sales lead important? To understand the relationship between marketing outreach and sales, we need to look at the change in sales after a given outreach behavior occurs. This means the effect of a marketing campaign that occurs in week 1 can only be seen on sales in the following weeks - not in the same week that the outreach occurs.
Our Sales_Marketing dataset is first split to take out data for products that are sold in new hospitals. Once data on the new hospitals and outreach efforts are available, this dataset could be used for clustering analysis and more predictive analytics on next best steps. For now, we don’t have enough data in order to include it in the training of our model
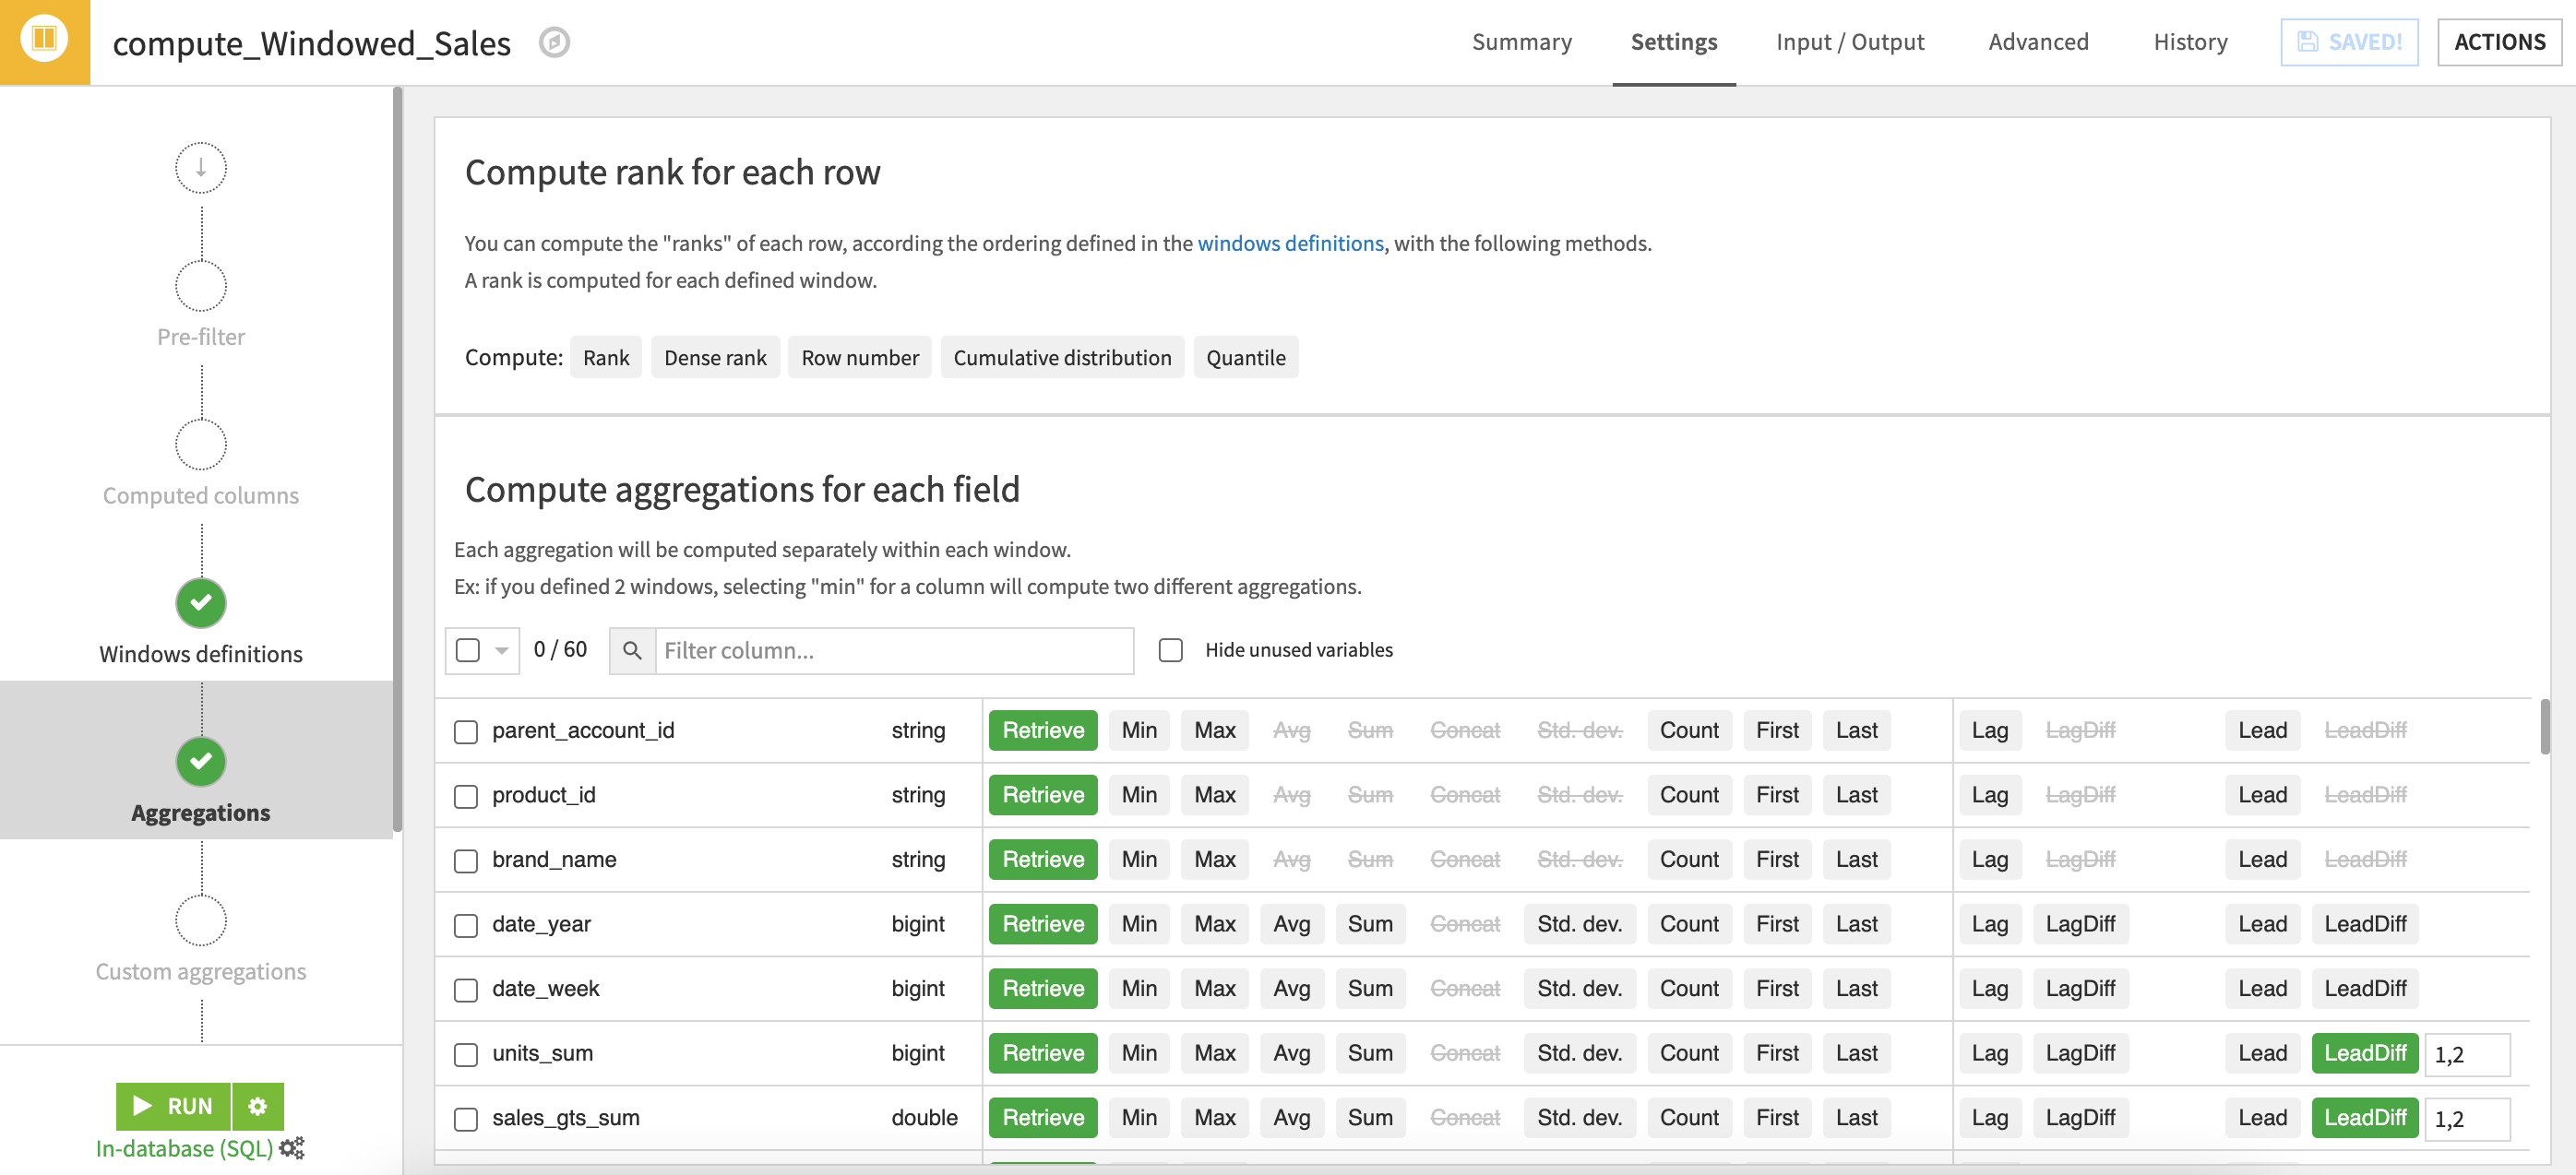
Following the split, a window recipe is used to group sales by parent_account_id and product_id. Additionally, we calculate a 1 and 2 week difference on the number of units and total sales using the window recipe by subtracting the current value from the future one. These values measure a change in sales and sales volume over time but need to be adjusted (multiplied by -1) in a subsequent prepare recipe to model the true growth or decline in sales over time.
Note
If a campaign takes longer than 2 weeks to impact sales, the value should be adjusted for a longer lead time.
Correlating Marketing Outreach to Sales
Finally, we are ready to train our models capable of generating deeper insights into the impact of a company’s marketing efforts on actual sales.
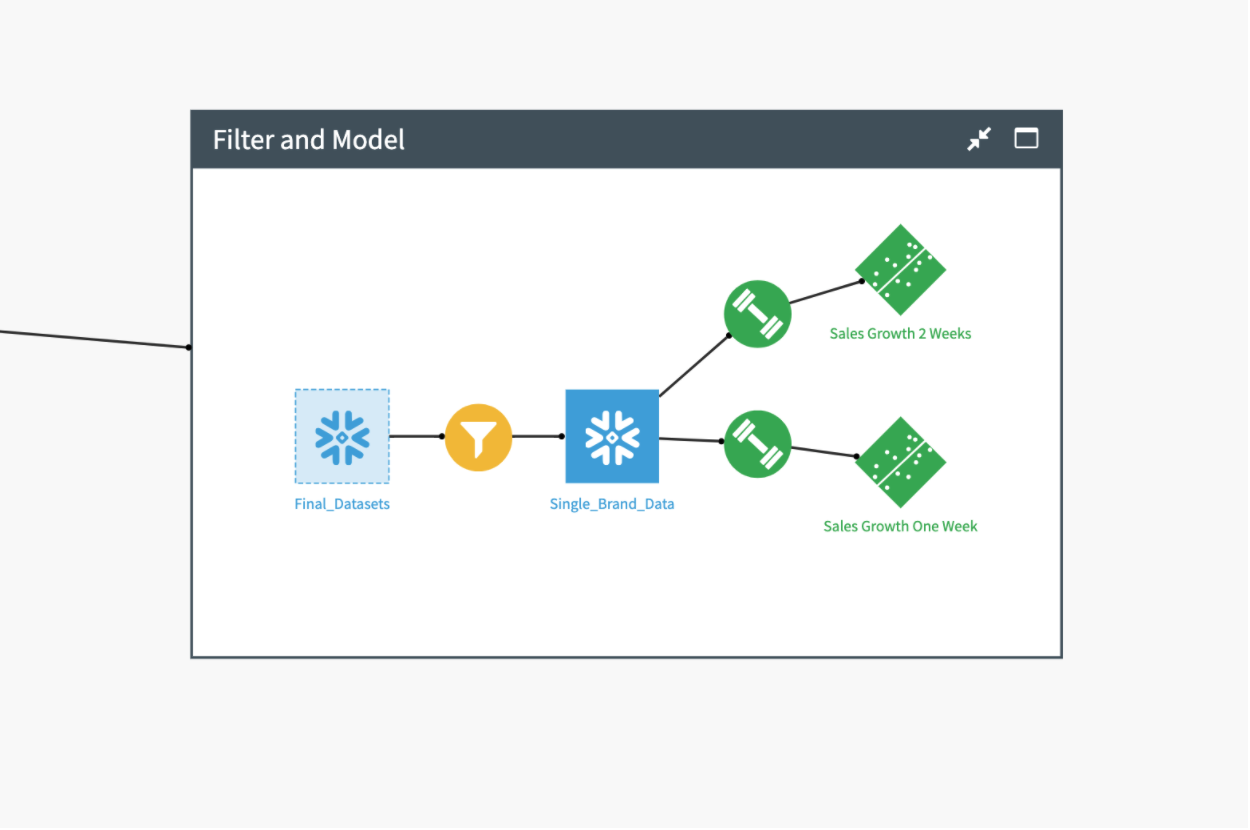
To allow other team members to repeat analysis for different products of interest via a Dataiku Application, we filter using a local variable to select only a single product for analysis.
We can create two models from the filter data for one or two weeks sales lead as the target variable, respectively. The created models are regression models that provide coefficients on each of the input variables thereby allowing us to assess the direction and magnitude of correlation between various marketing outreach strategies and sales.
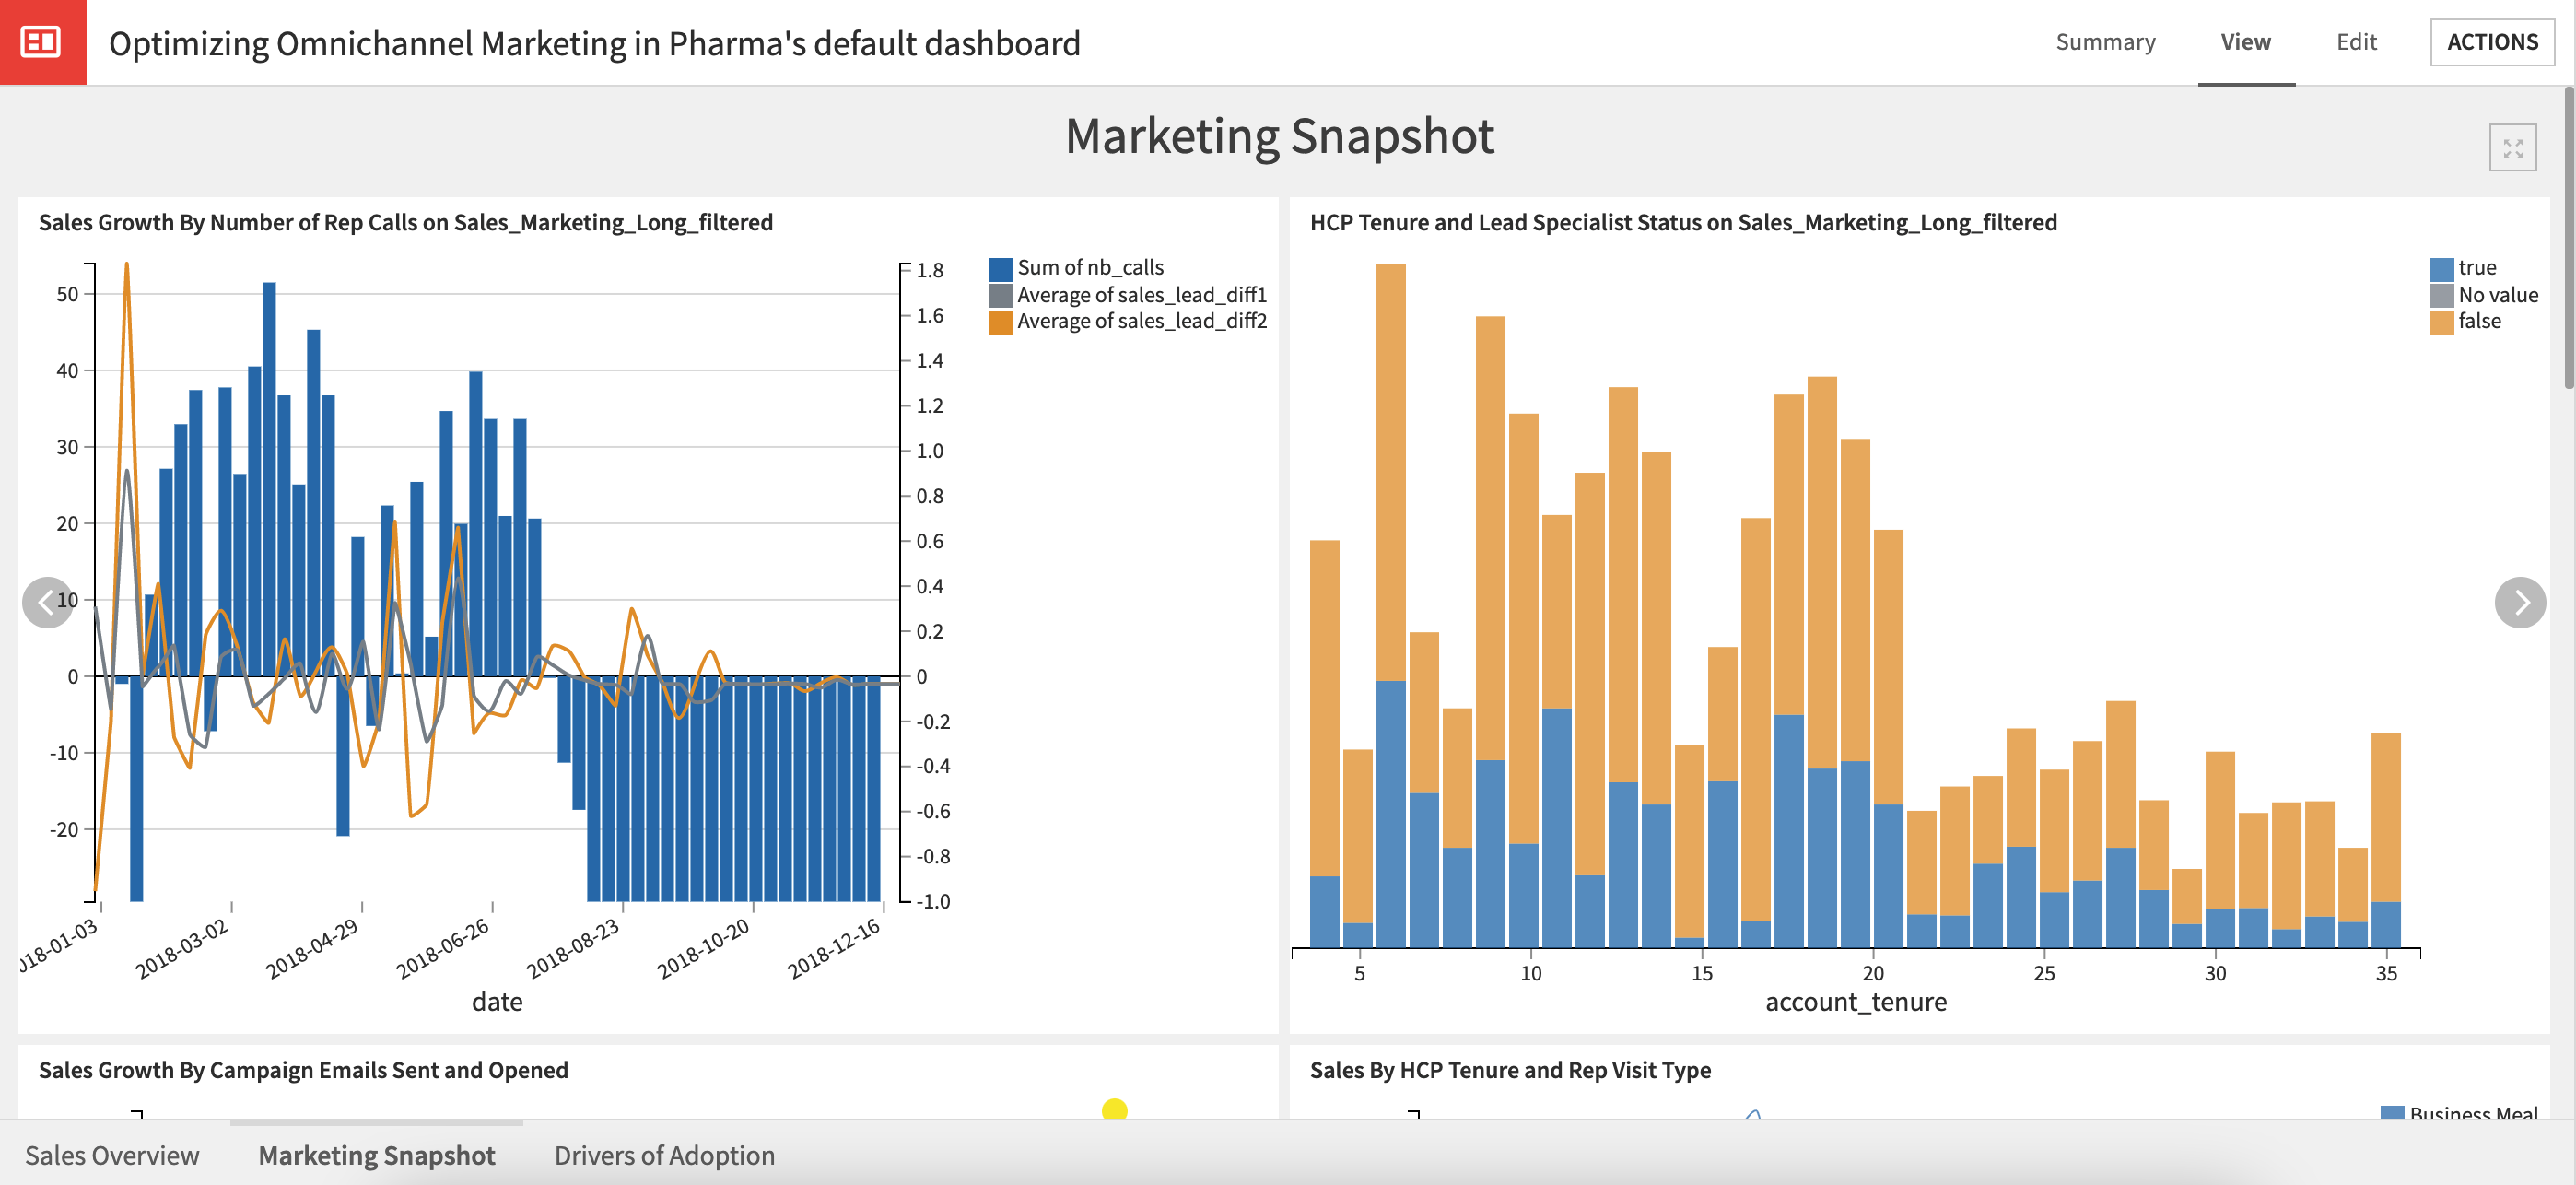
Sharing consumable insights for Marketing and Sales teams
The project’s dashboard provides insights into sales trends, marketing efforts and overall drivers of adoption. The first two slides on the dashboard are built from the aggregated and HCP level datasets. The HCP level datasets were created in parallel to our initial data prep step but were not used in the training of our models. On the third slide, both model regression coefficients can be compared to assess whether certain types of outreach increase sales more in a one or two week period.
In addition to the dashboard, this project is bundled as an Application, which means users can select a new product to analyze. After re-running the Filter and Model aspect of the pipeline, users will have access to the updated dashboard with the relevant charts and model outputs to explore.
Reproducing these processes with minimal effort for other brands and products
The intent of this project is to enable marketing teams to understand how Dataiku DSS can be used to assess the past and future success of their Omnichannel marketing strategies either by starting a new project from scratch or adapting this existing project to one’s specific needs. A deeper technical walkthrough of the project can be found within the wiki to aid in reproducing this project. Roll-out and customization services can be offered on demand.