Concept Summary: In-Database Charts
In the previous video, you learned how to use a database execution engine to create charts on a dataset. Let’s now summarize the key points of the video before continuing on to the next lesson.
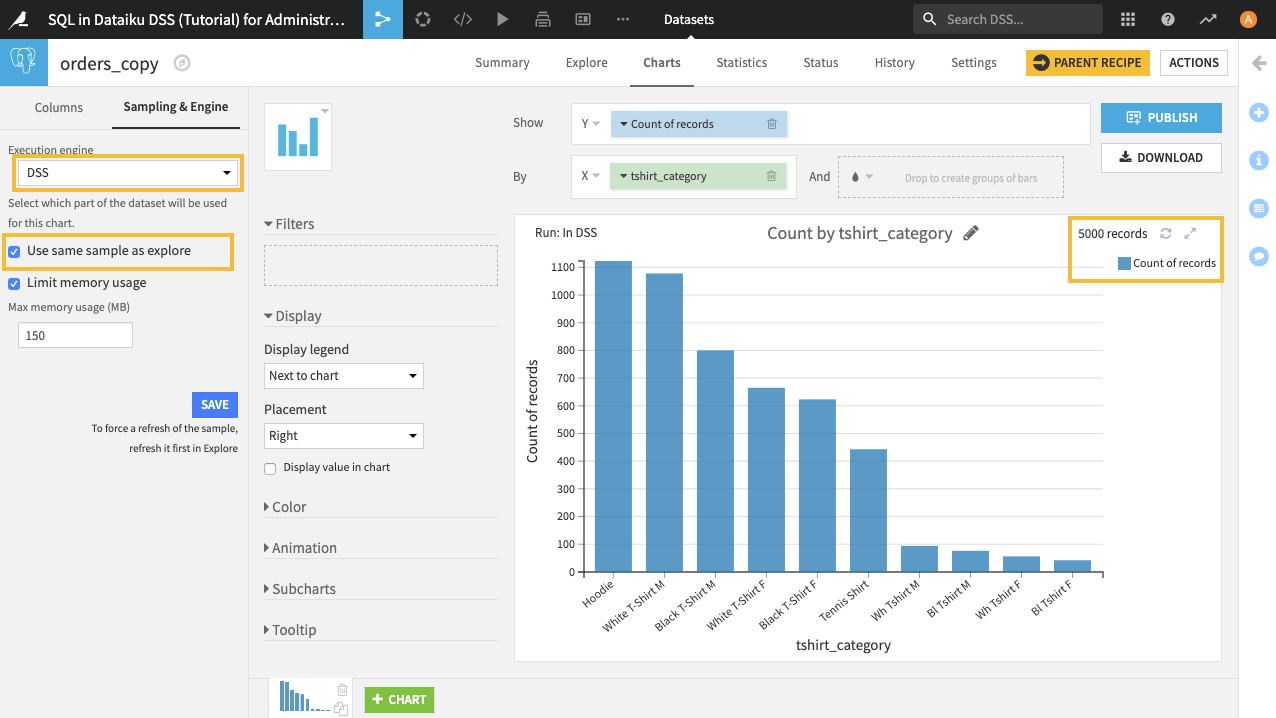
By default, Dataiku DSS uses the DSS engine to process the data used for creating charts. It renders the charts on the same data sample that is chosen in the Explore tab of the dataset.
Alternatively, selecting a database engine to process the data uses the full dataset for creating charts, and can speed up computation, so that charts render faster.
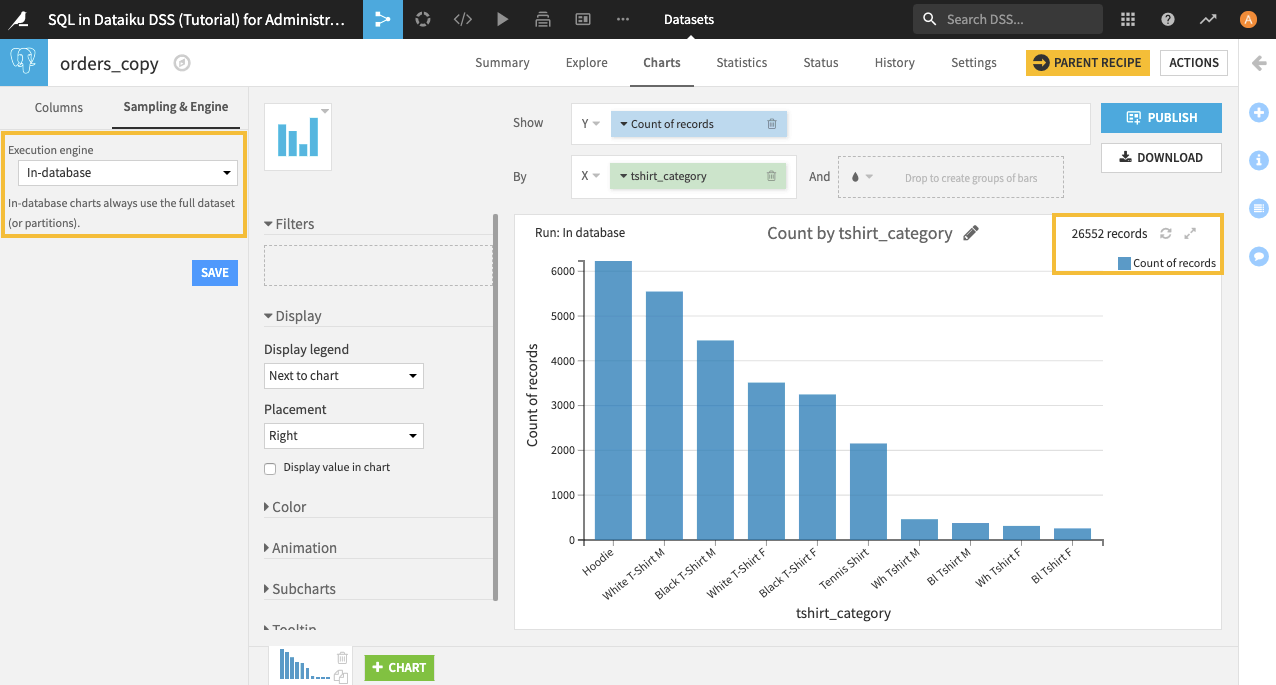
We generally recommend that you choose a dedicated engine when you want to render charts on the entire dataset.
For more information, see Sampling & Engine in the product documentation.