Compute a subpopulation analysis for white-box ML
Fairness, transparency, and explainability are serious concerns faced by those building AI systems today.
Dataiku DSS empowers data scientists with the tools to build white-box machine learning models. One of these features designed to enable white-box machine learning is subpopulation analysis.
The Context for Subpopulation Analysis
For many use cases, the ability to explain or interpret the results of a machine learning model may be just as important as the accuracy of the predictions themselves.
A machine learning model is often labelled a black-box if its inner workings are largely obscured. A white-box model, on the other hand, allows for a more understandable relationship between input features and output predictions.
Subpopulation analysis is an example of a white-box ML technique.
Subpopulation Analysis with Dataiku DSS
The nature of Dataiku DSS lends itself to white-box machine learning in a number of ways. The inherently collaborative nature of DSS and the ability to trace the lineage of data through a Flow are two fundamental properties that can increase understanding and trust in a model.
More specifically, Dataiku DSS has features, such as partial dependence plots and subpopulation analysis, designed to make it easier to interpret model predictions.
You can compute a subpopulation analysis after building a regression or binary classification model trained in Python, such as scikit-learn or keras. The purpose of this analysis is to assess whether a model behaves identically across subpopulations.
This assessment is particularly important in a fairness study where you want to examine if a model reproduces biases in the training data. This tool can help users more easily weed out unintended model biases and create a more transparent and fair AI deployment.
This video below gives a brief introduction to the why and how of subpopulation analysis with Dataiku DSS.
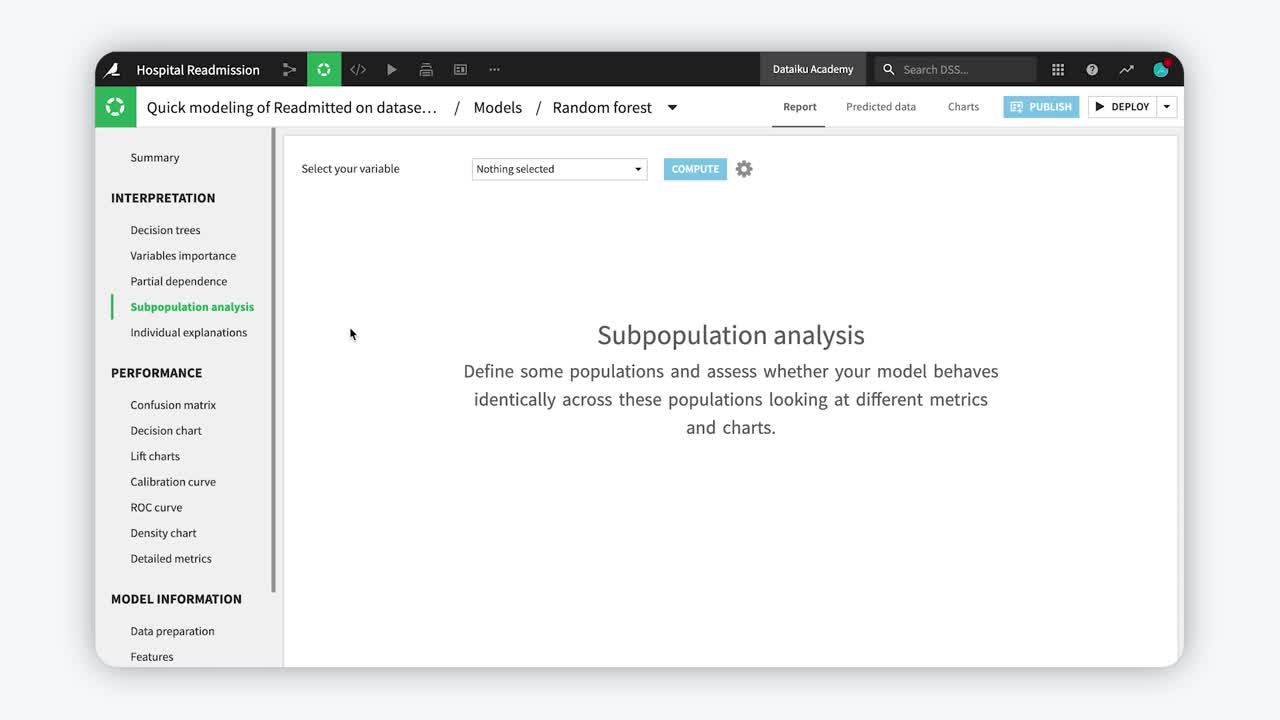
Interpreting Subpopulation Analysis
Subpopulation analysis computes a table of various statistics that you can compare across subpopulations that you define. For example, in a binary classification model, computing a subpopulation analysis on a variable such as gender allows you to examine the extent to which model prediction probabilities differ between male and female observations. In all cases, deciding whether a difference constitutes a significant finding with respect to fairness is left to you.
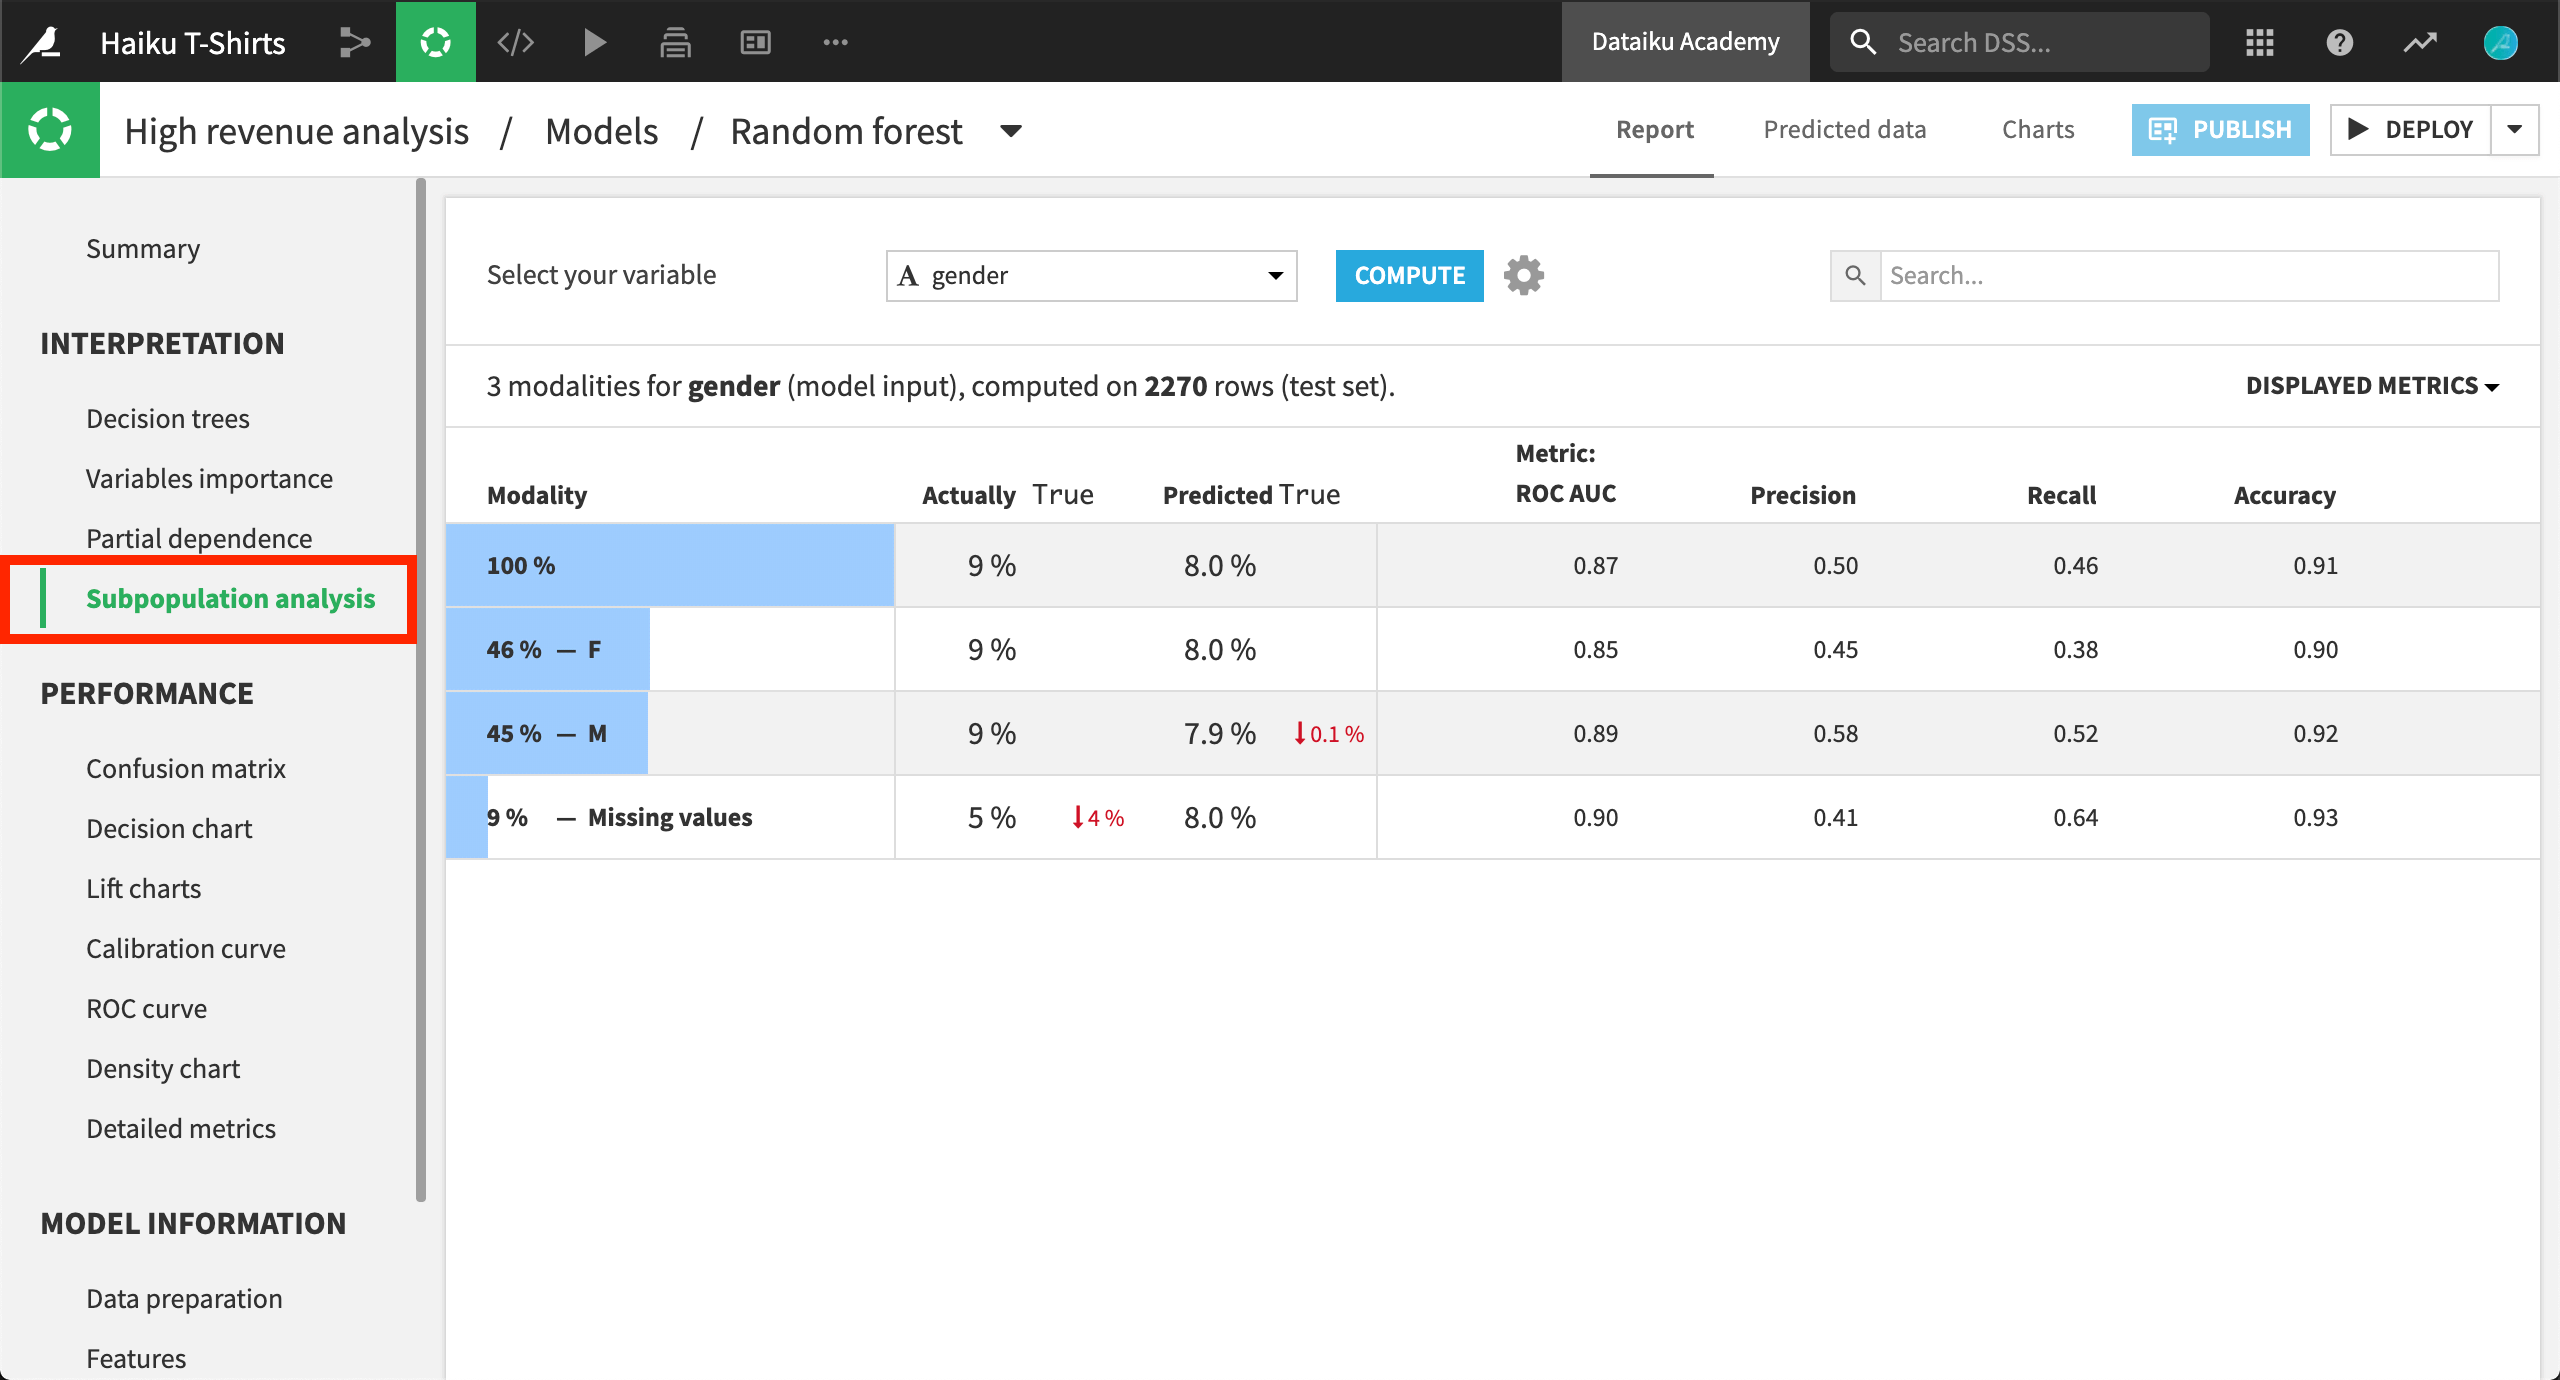
Does the model behave similarly for male and female subpopulations?
What’s next?
Consult the reference documentation for more information about how to conduct subpopulation analysis with Dataiku DSS.
The reference documentation also details how to create a partial dependence plot, which is another DSS tool for white-box machine learning.