Hands-On Tutorial: What-If Analysis With Interactive Scoring
The interactive scoring feature of a Dataiku visual model enables anyone to run “what-if” analyses and compare multiple test cases from real or hypothetical situations. Learn how to use an interactive scoring tool that has been embedded in a dashboard with this hands-on exercise.
Getting Started
You will need a Dataiku DSS project with a dataset that you can use to create a predictive model. We will use the Haiku Starter project as an example. There are two ways you can import this project:
From the Dataiku DSS homepage, click +New Project > DSS Tutorials > General Topics > Haiku Starter.
Download the zip archive for your version of Dataiku DSS, then from the Dataiku DSS homepage, click +New Project > Import project and choose the zip archive you downloaded.
You should now be on the project’s homepage.
Go to the project’s list of dashboards, open the Analytic dashboard, and go to the What-If Analysis slide.
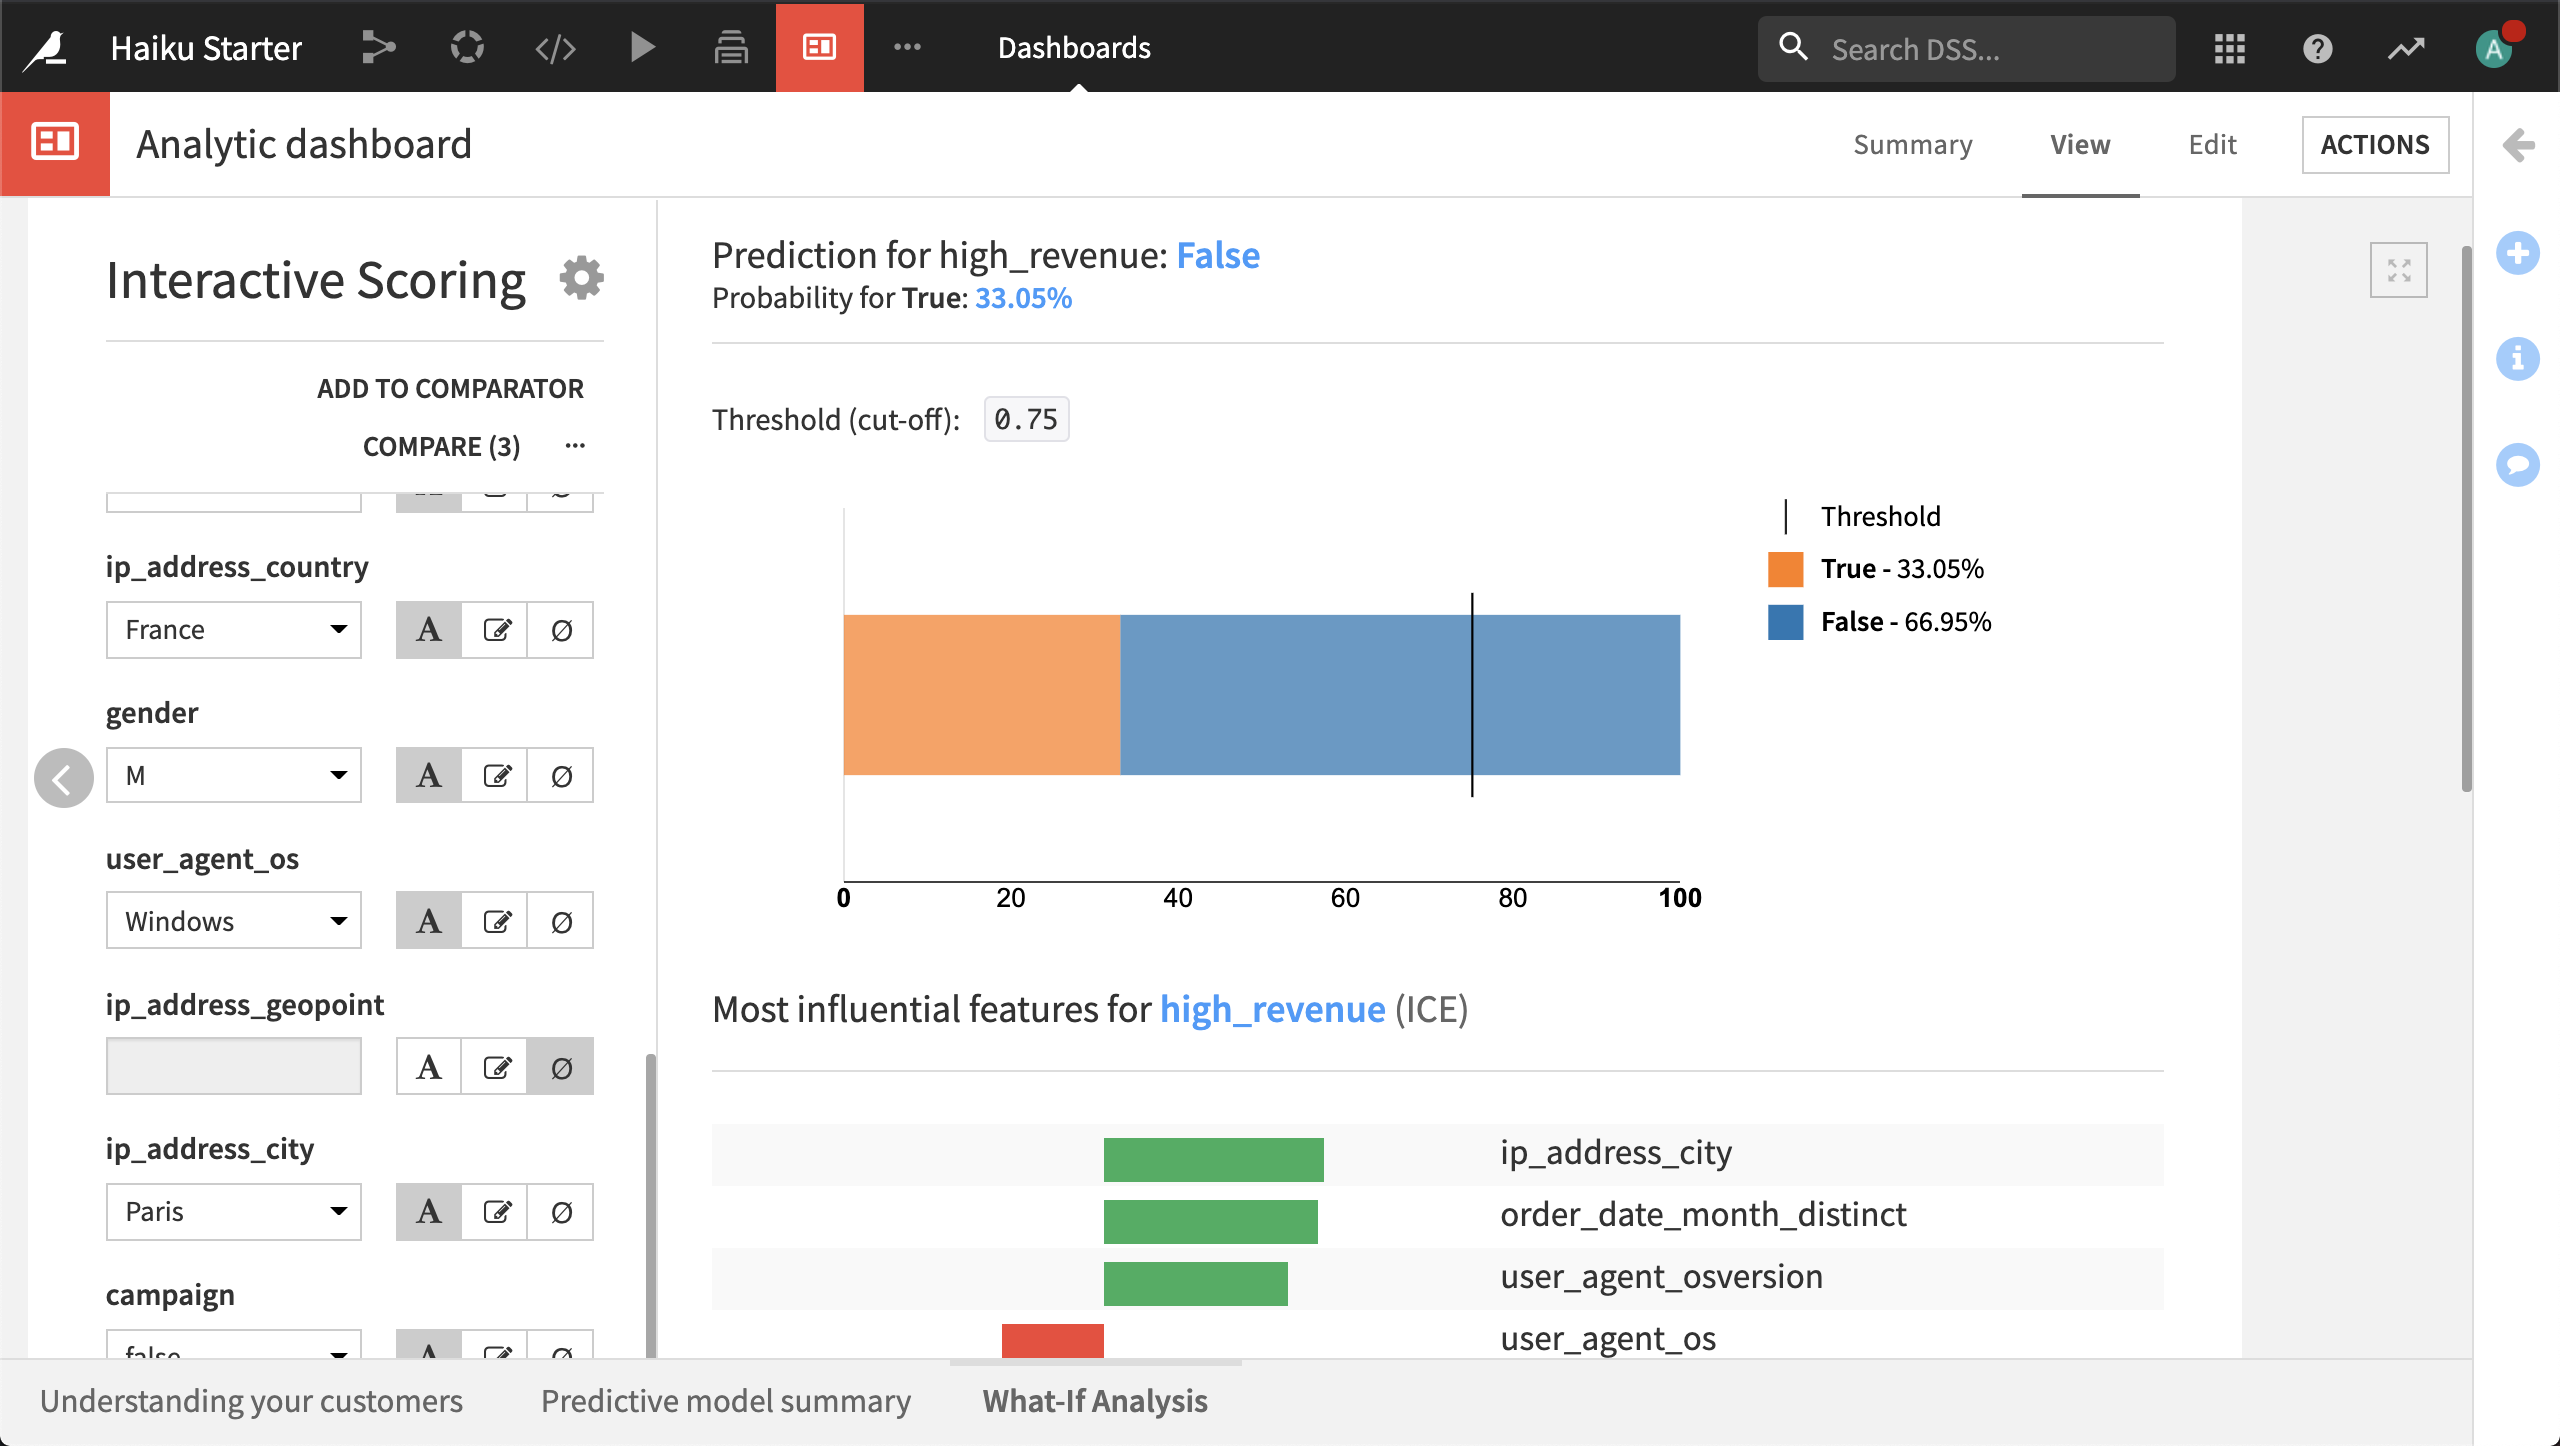
This slide contains an interactive scoring tile. The model underlying this tile predicts whether a customer of the Haiku T-Shirt company is a “high value” customer. We may be interested in assessing the likelihood that a new customer will become “high value” for various profiles.
Specifying a What-If Scenario
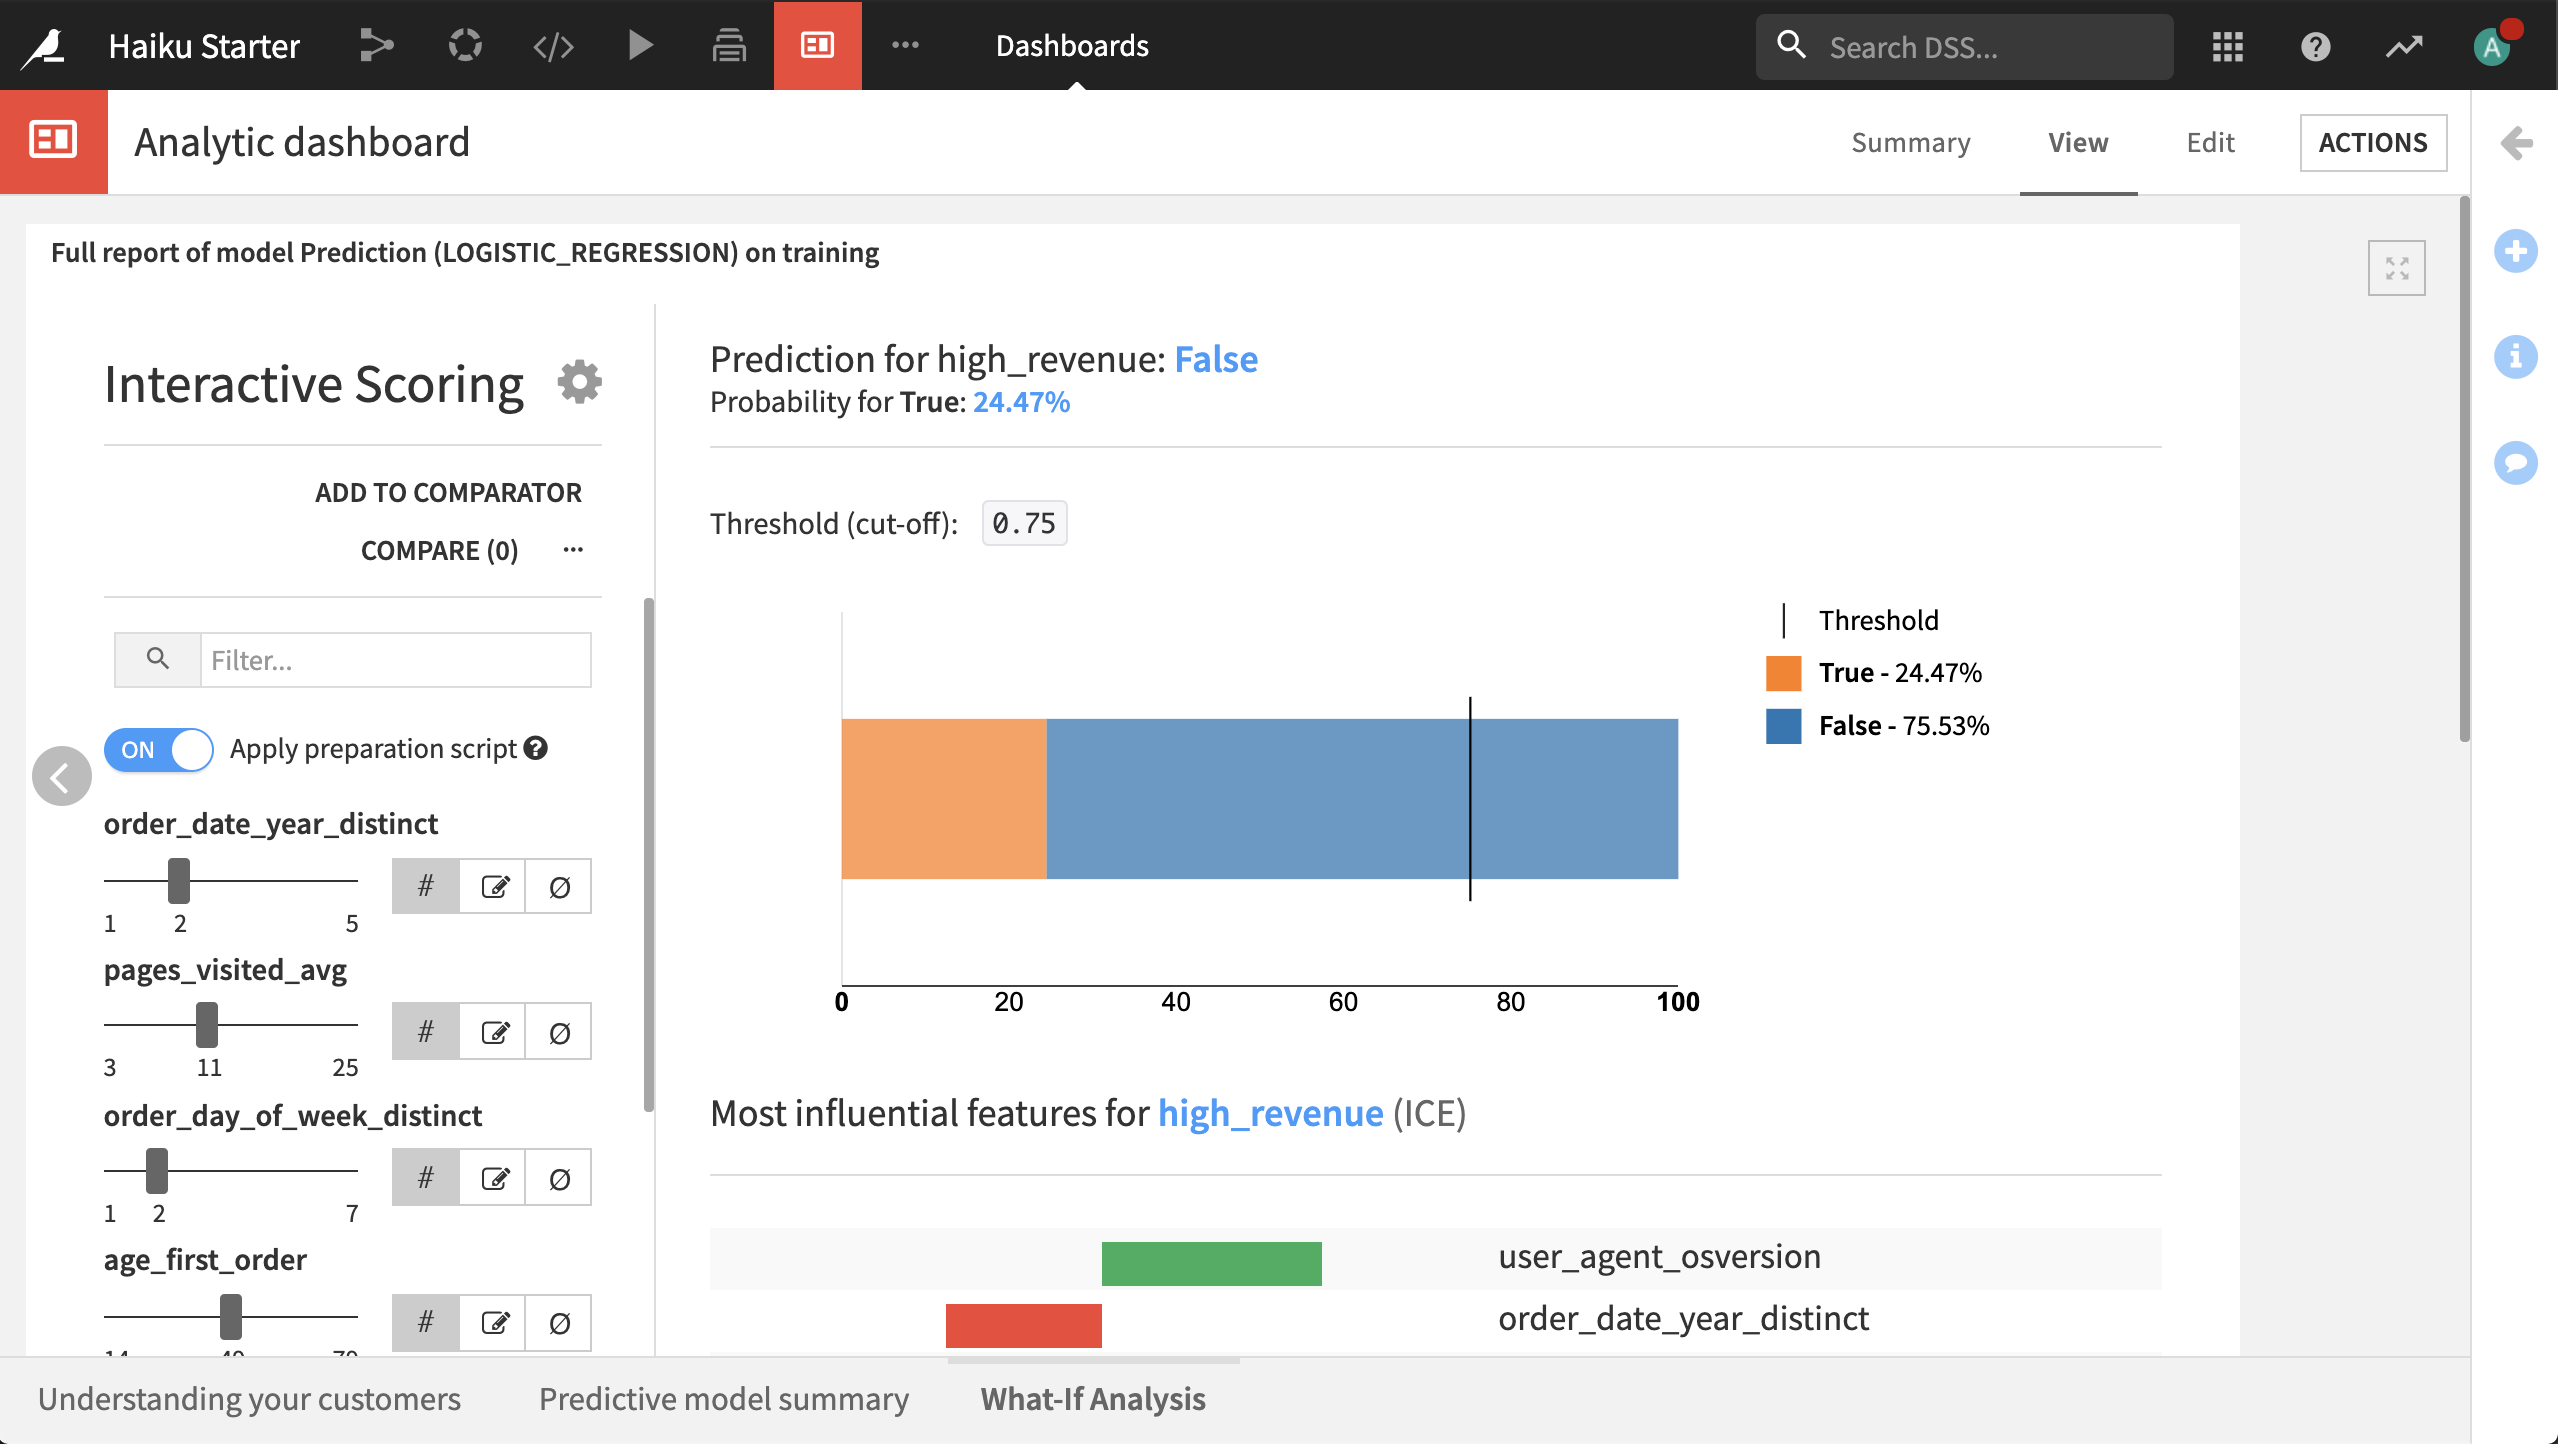
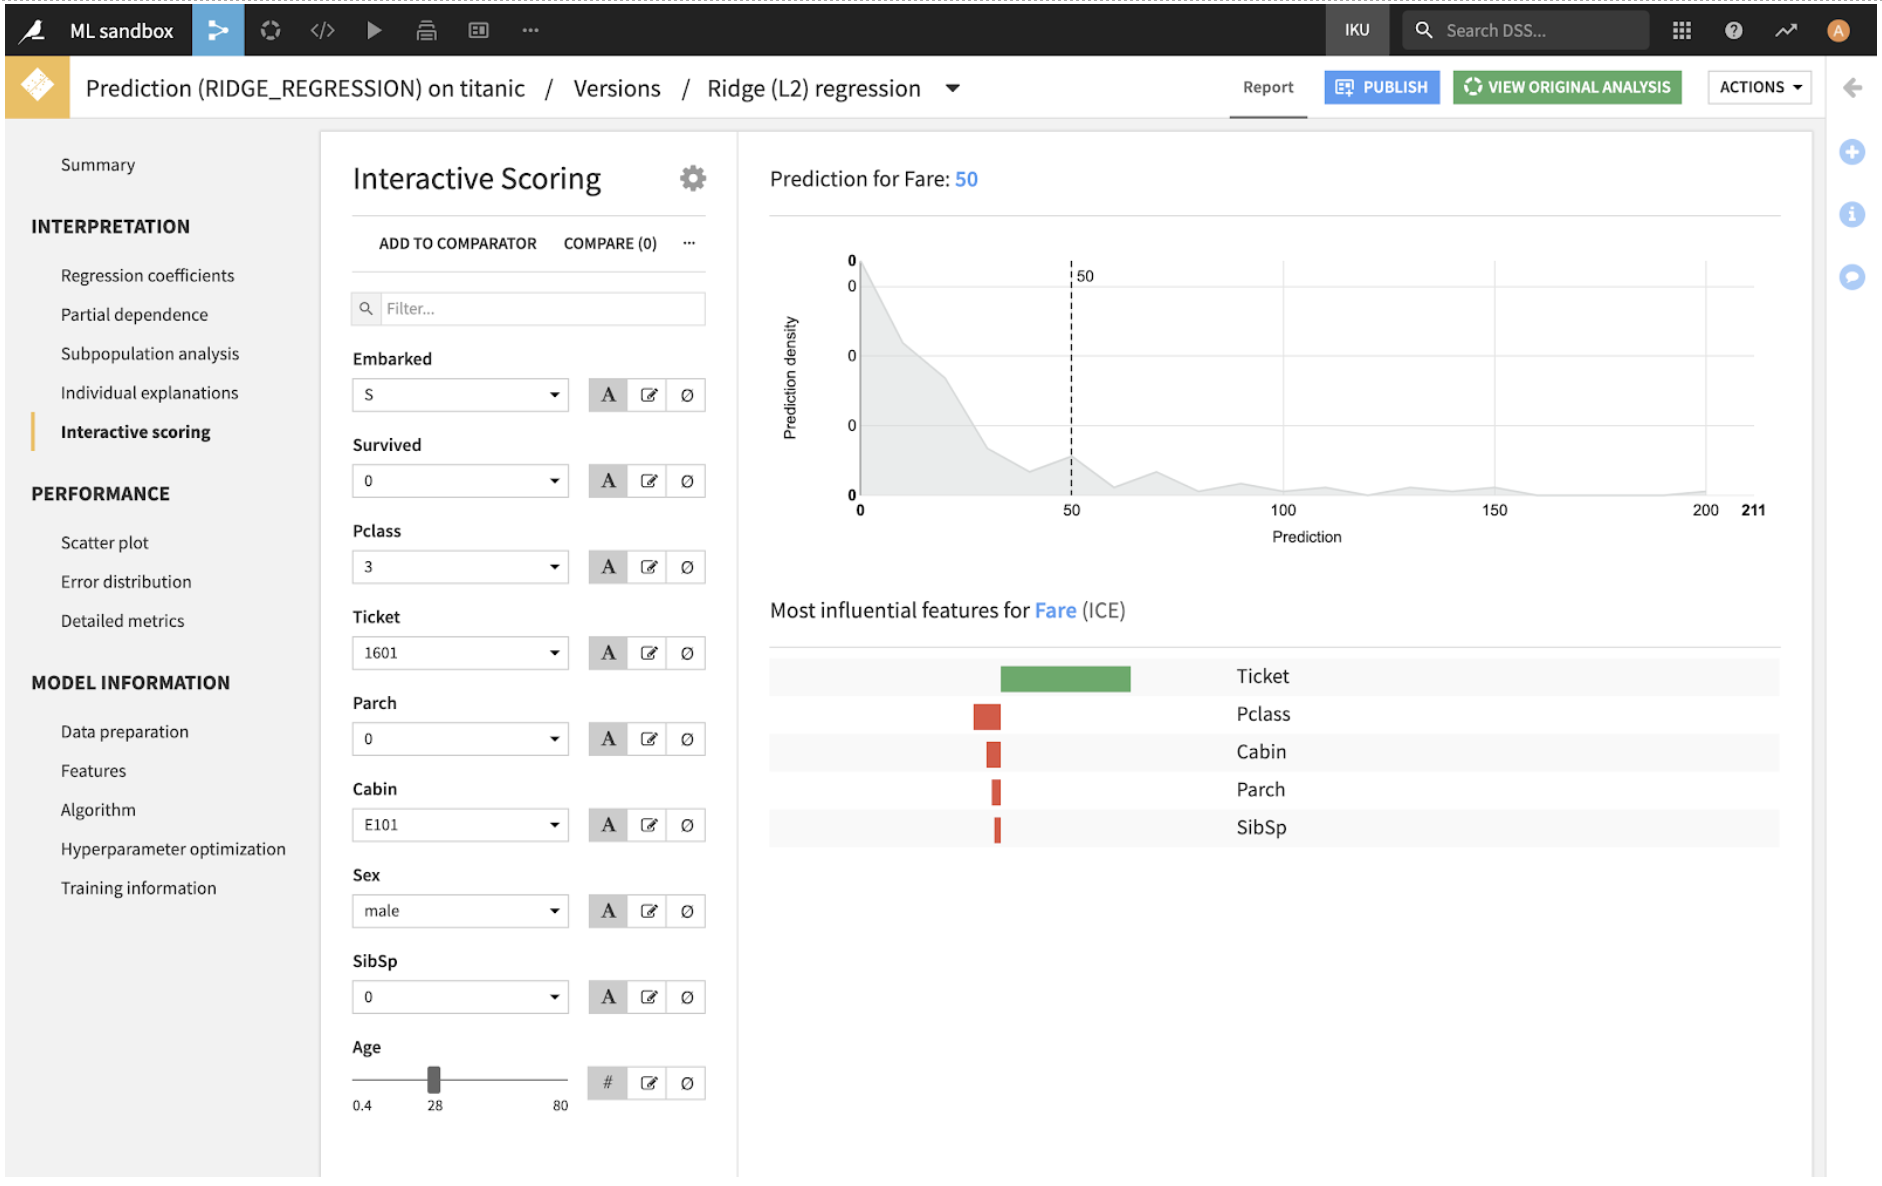
The left-hand side of the tile displays the interactive simulator where you can configure all the input features values. The right-hand side displays the result of the prediction, along with explanations of which features contribute most strongly to this prediction.
The default values are based on the training set for the model, and use the medians for numerical features and the most common values for categorical features. To create your own custom scenario, simply change the values:
The feature order_date_year_distinct is a count of the number of distinct years in which the customer has made an order. For a new customer, we won’t know this value, so click the Ignore feature button to not specify a value to the model.
Do the same for the features order_day_of_week_distinct and order_date_month_distinct.
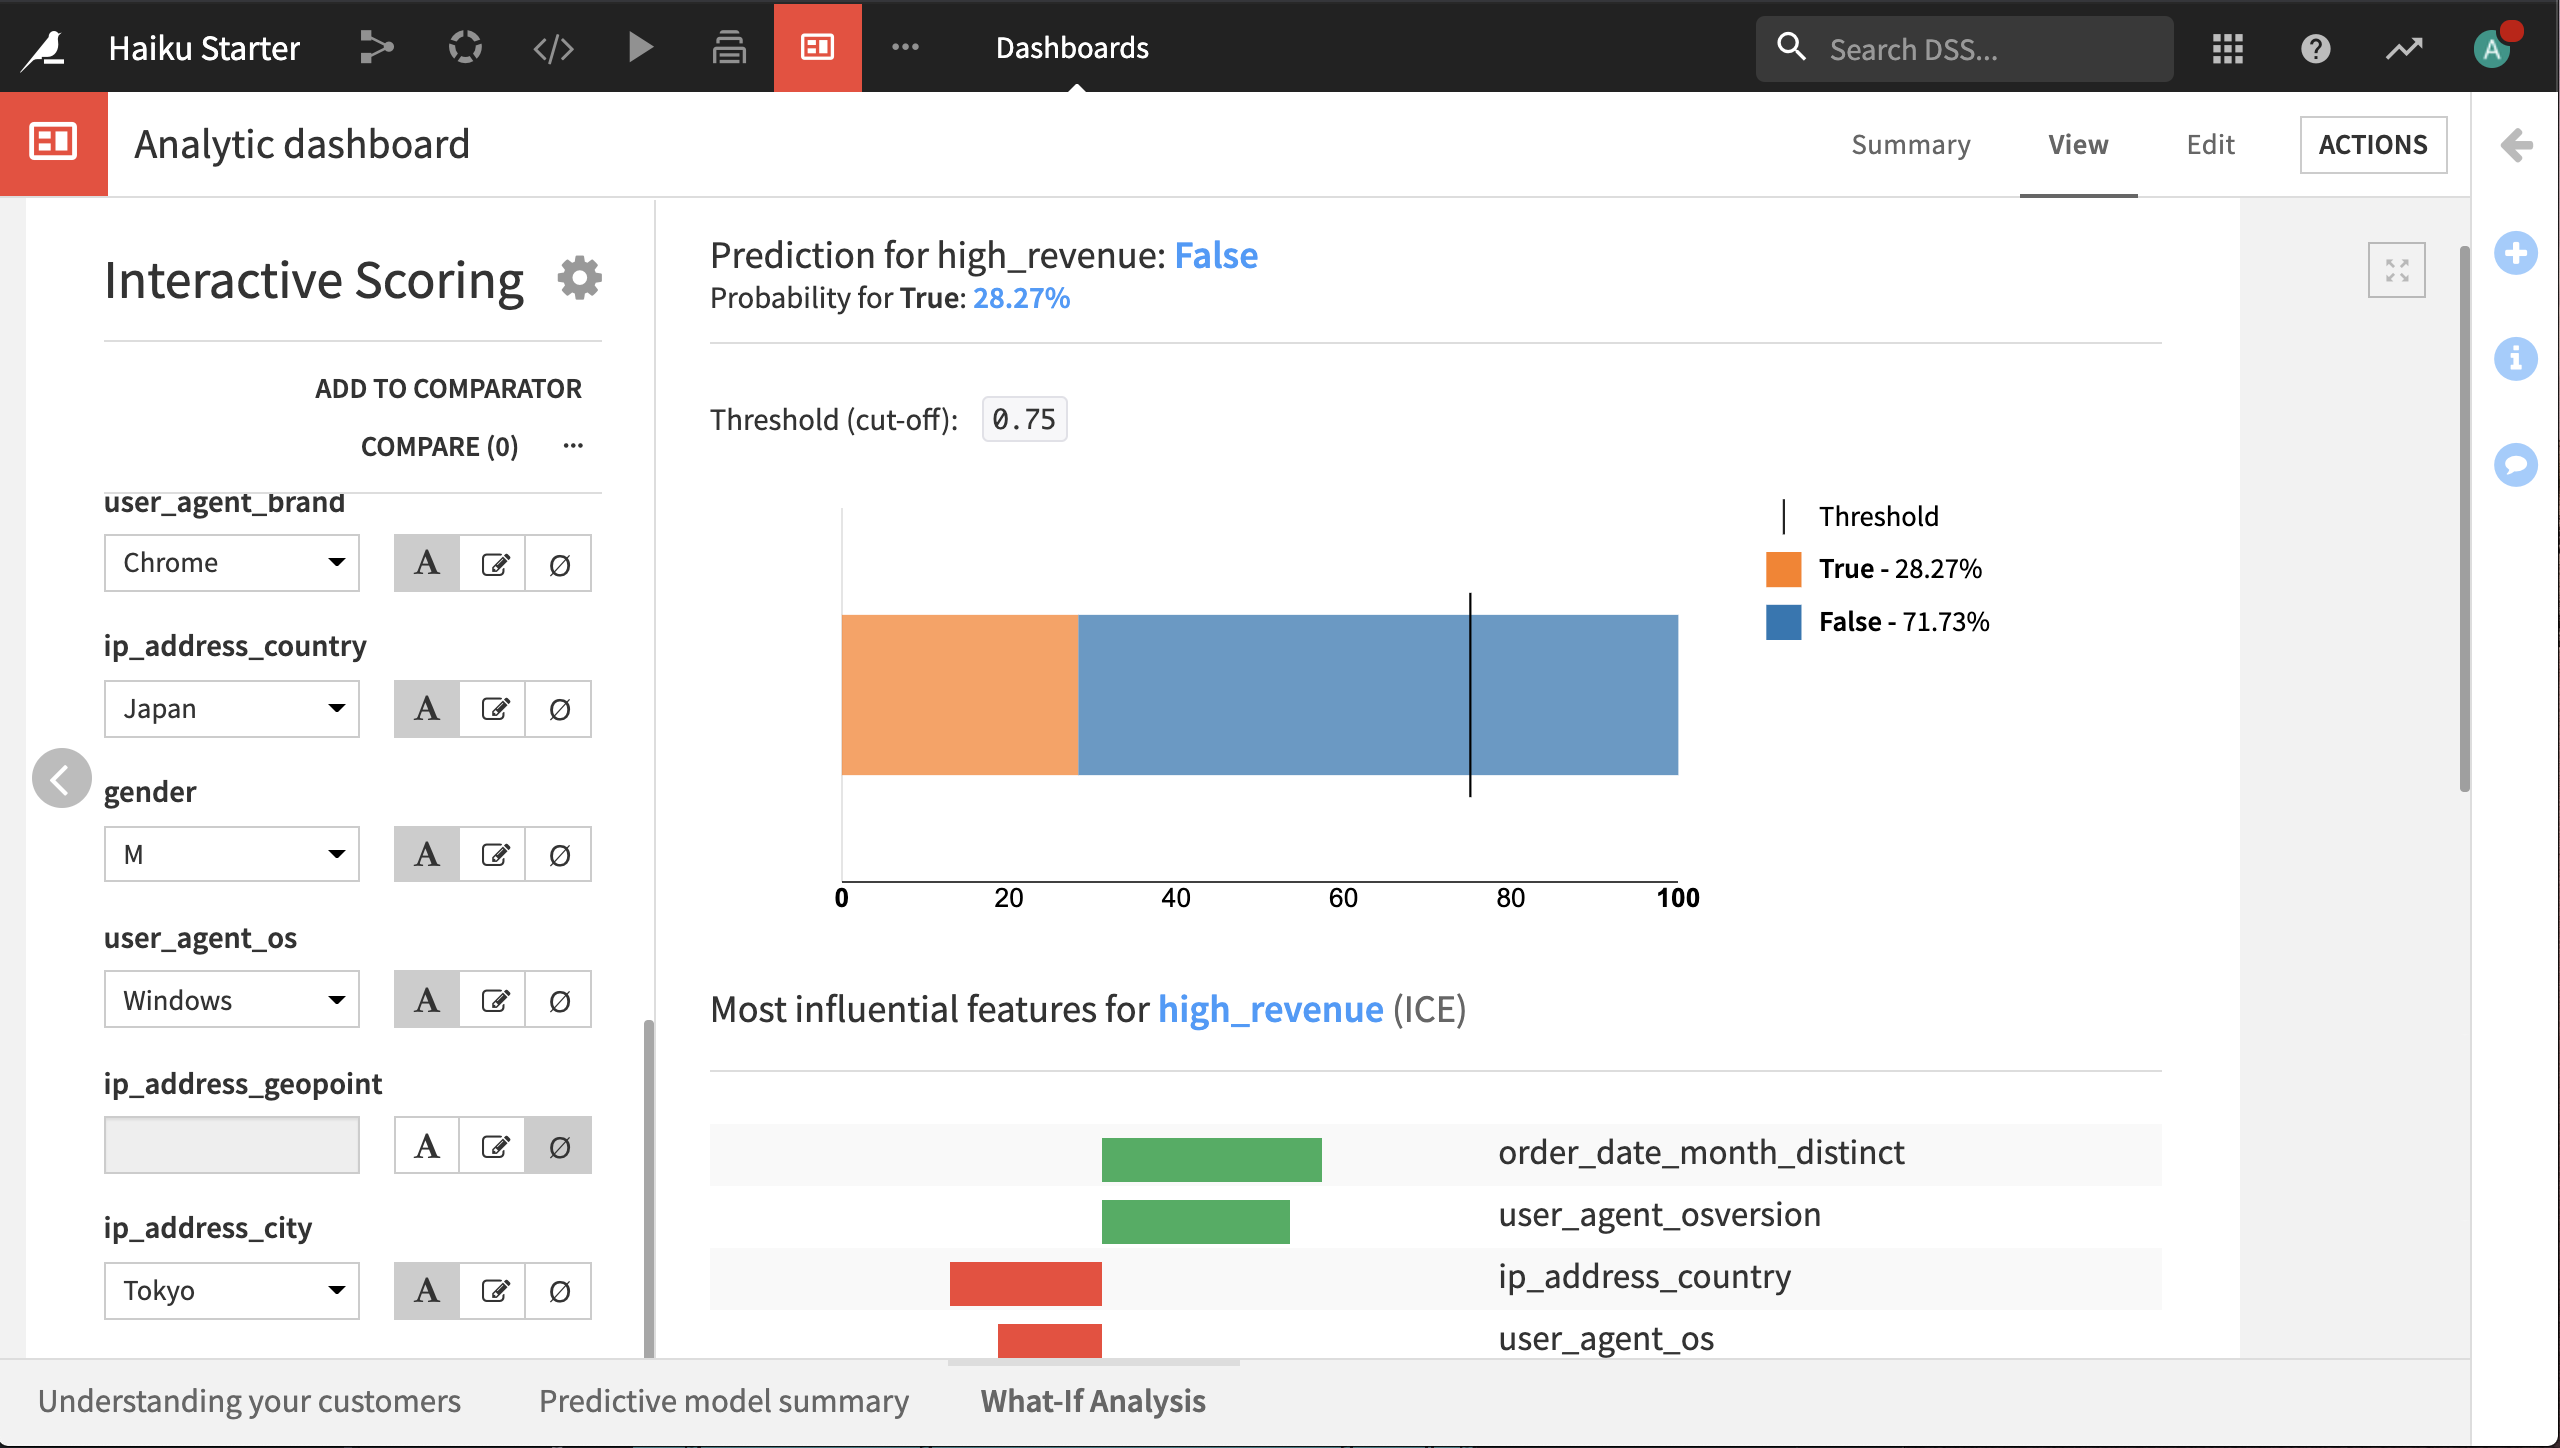
The value for feature ip_address_country is “United States” and for ip_address_city it is “Tokyo”, because these were the most common values for each of these features, but it doesn’t make common sense. Change the value of ip_address_country to “Japan”.
Set ip_address_geopoint to Ignore feature.
We can see that this changes the predicted probability of the customer being “high value” from 24% to 28%.
Note
The display for the prediction depends upon whether the model is a binary classification, multi-class classification, or regression. In this hands-on, the model is a binary classification problem and the display shows the model-predicted probability of each category and the classification threshold.
In a multi-class classification problem, the display shows the model-predicted probability of each category, and the predicted category.
In a regression problem, the display shows the model-predicted probability density function for the target, and the predicted value.
Comparing What-If Scenarios
A primary value of what-if analysis is to be able to compare differences scenarios. To do this in Dataiku DSS:
Click Add to Comparator.
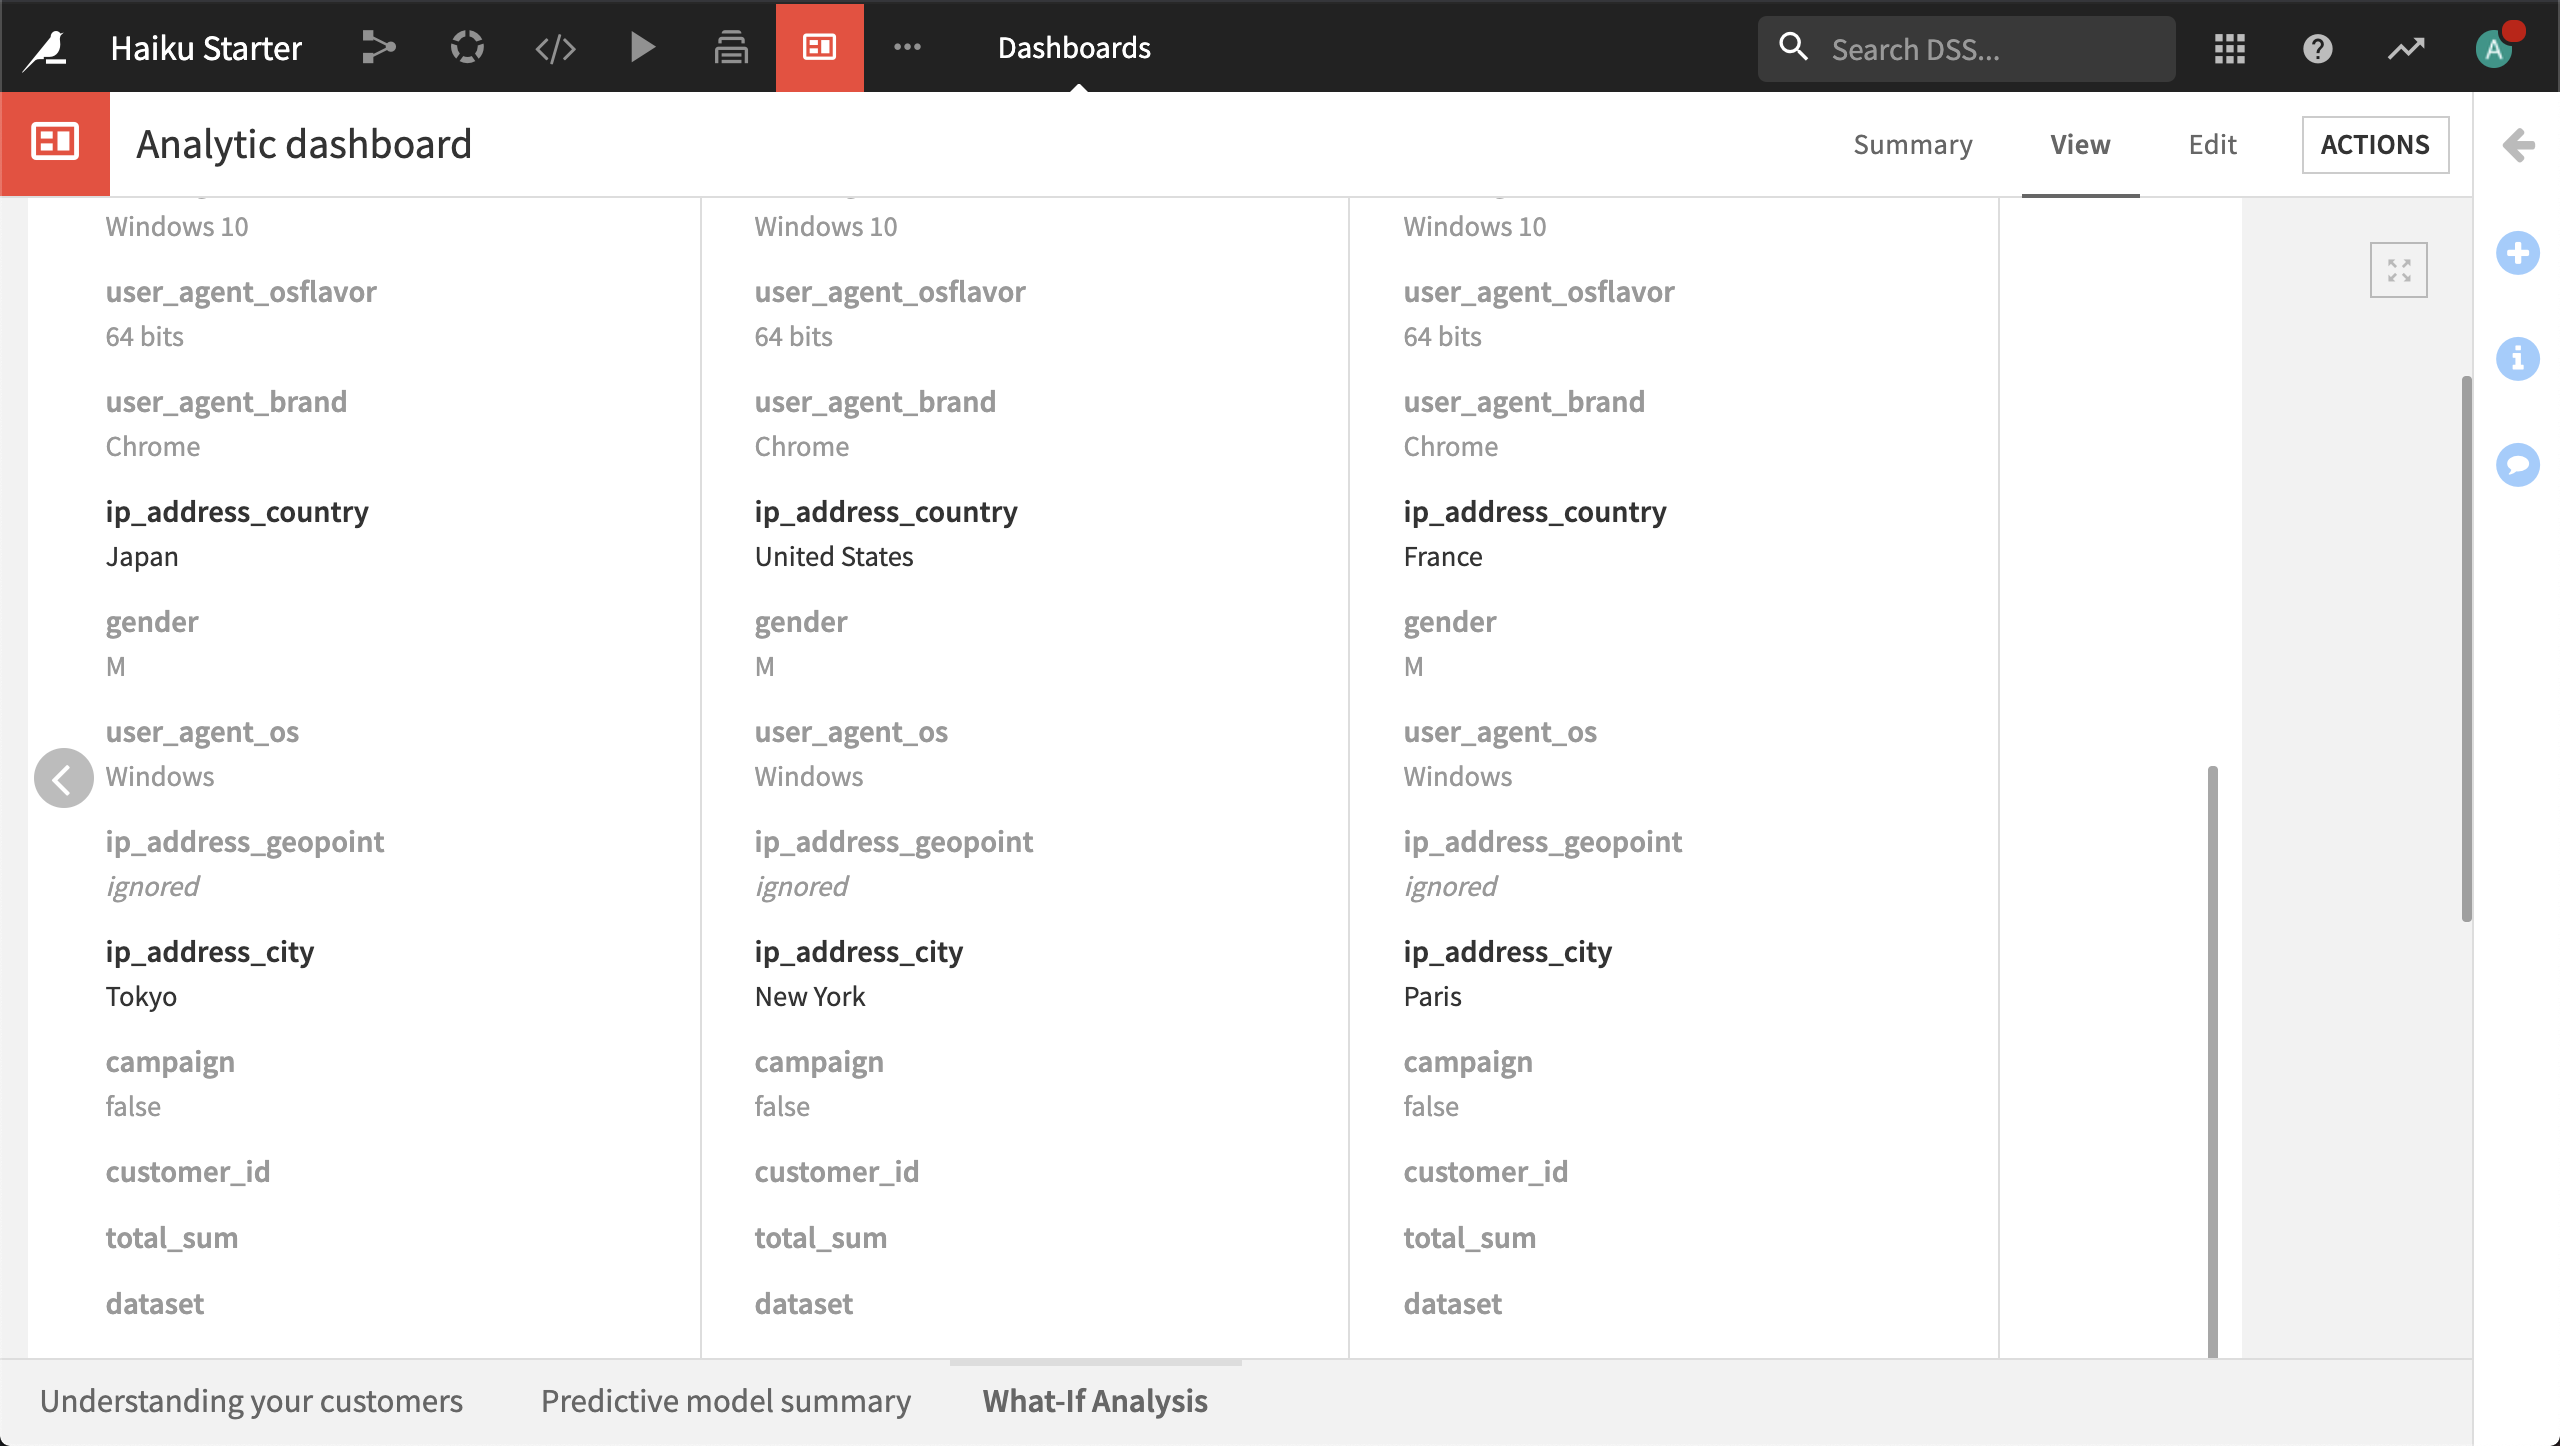
Change ip_address_country and ip_address_city to “United States” and “New York”, respectively, then click Add to Comparator.
Change ip_address_country and ip_address_city to “France” and “Paris”, respectively, then click Add to Comparator.
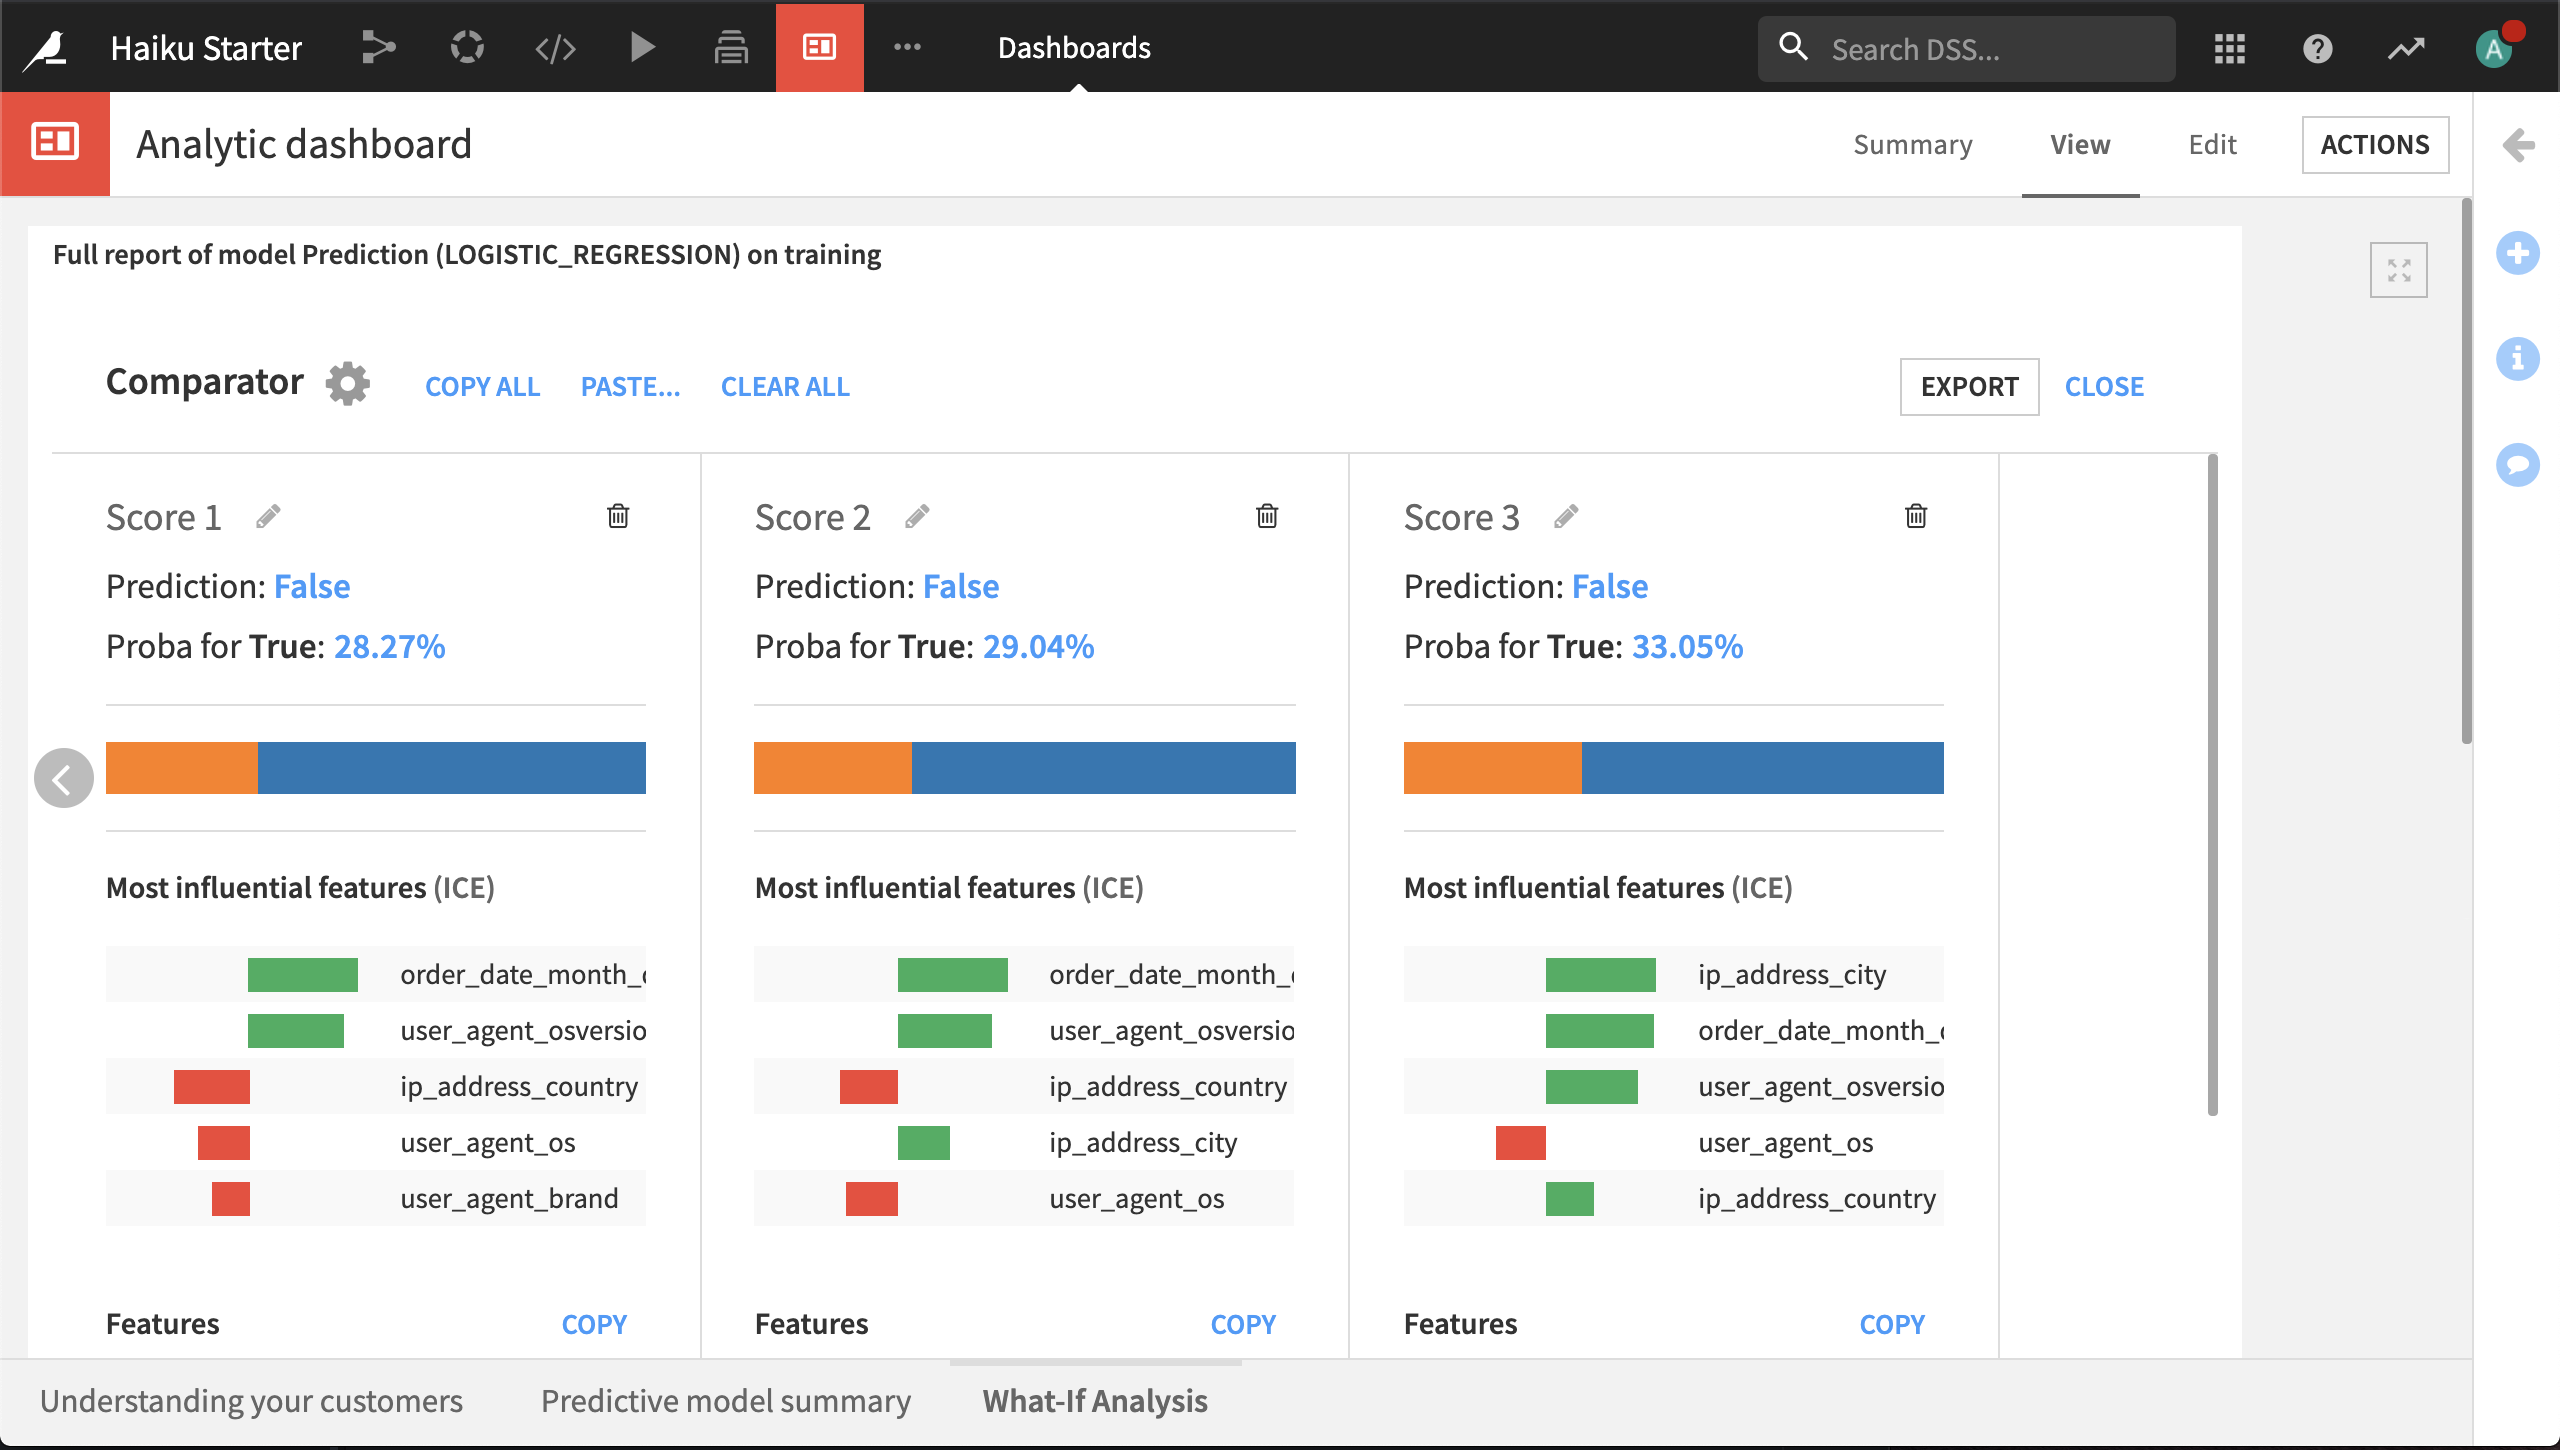
Click Compare to open the comparator.
You can quickly see from the display how the probability of being “high value” changes from scenario to scenario.
Scrolling down the comparator display, you can quickly see which features are different across the scenarios; the features that are the same are greyed out.
Copying Values into a What-If Scenario
It is time consuming to manually update all the feature values in a scenario. You can copy rows from a DSS dataset into the interactive scoring tile to create a scenario.
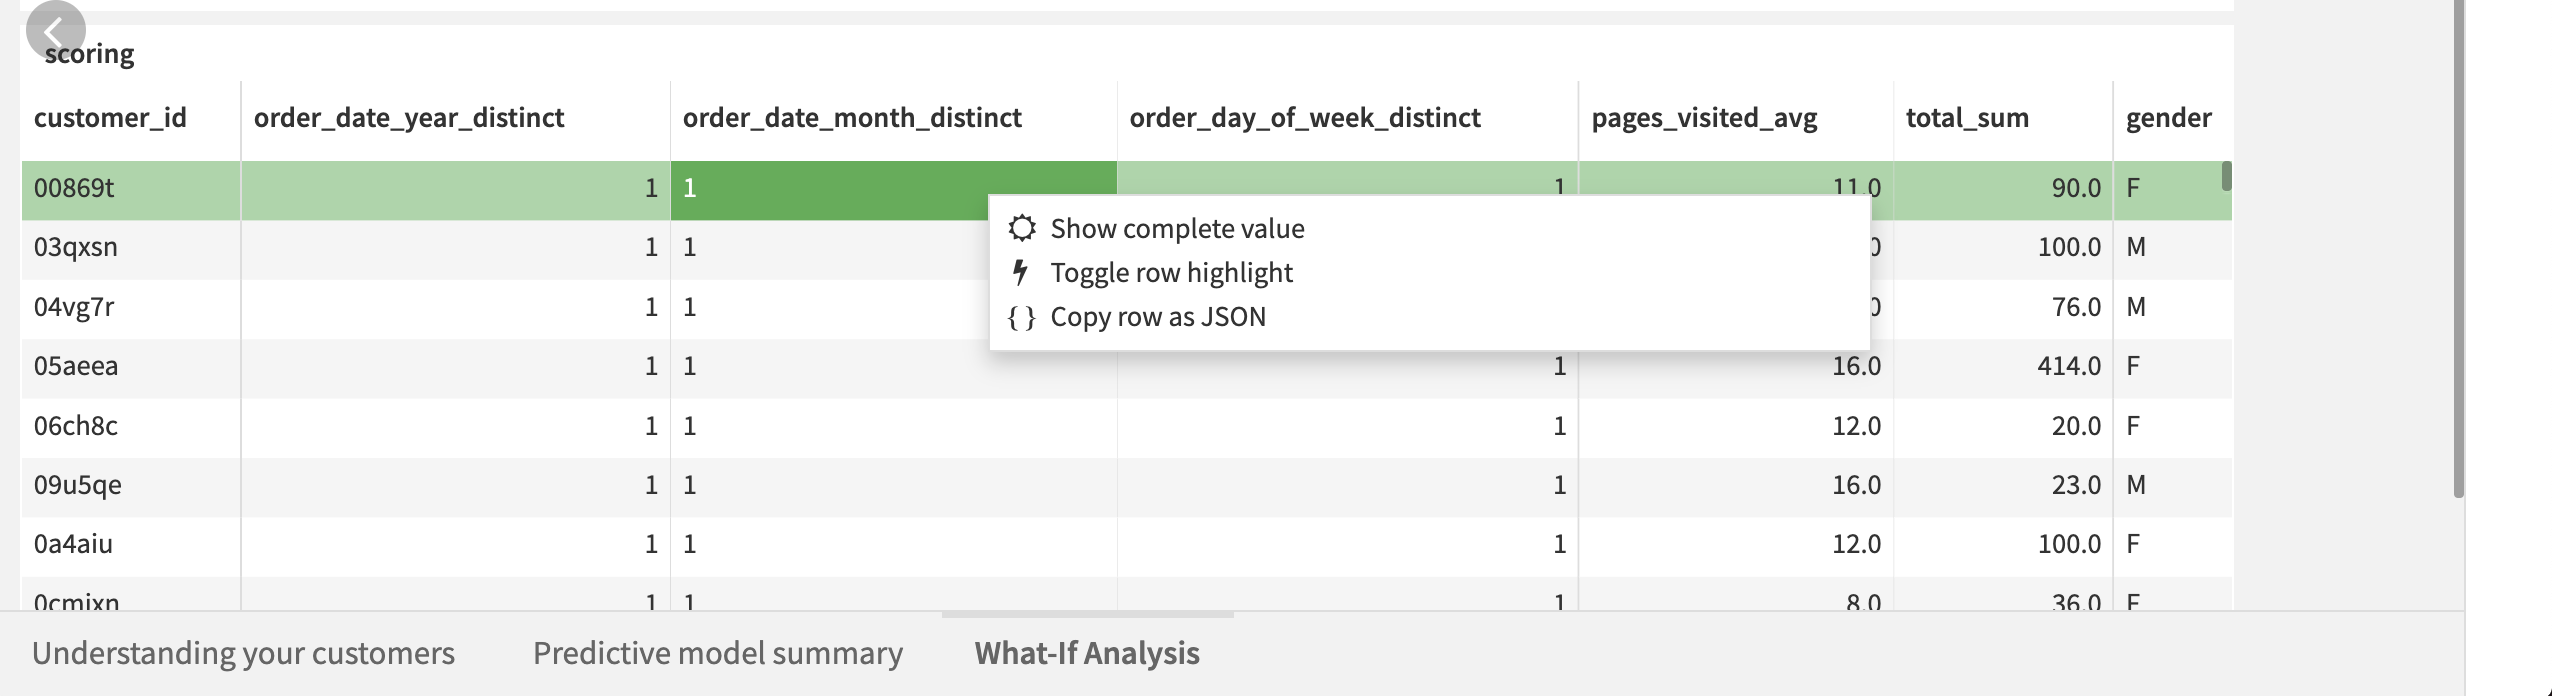
The What-If Analysis slide has a dataset tile below the interactive scoring tile.
Right-click on a row in the dataset and select Copy row as JSON.
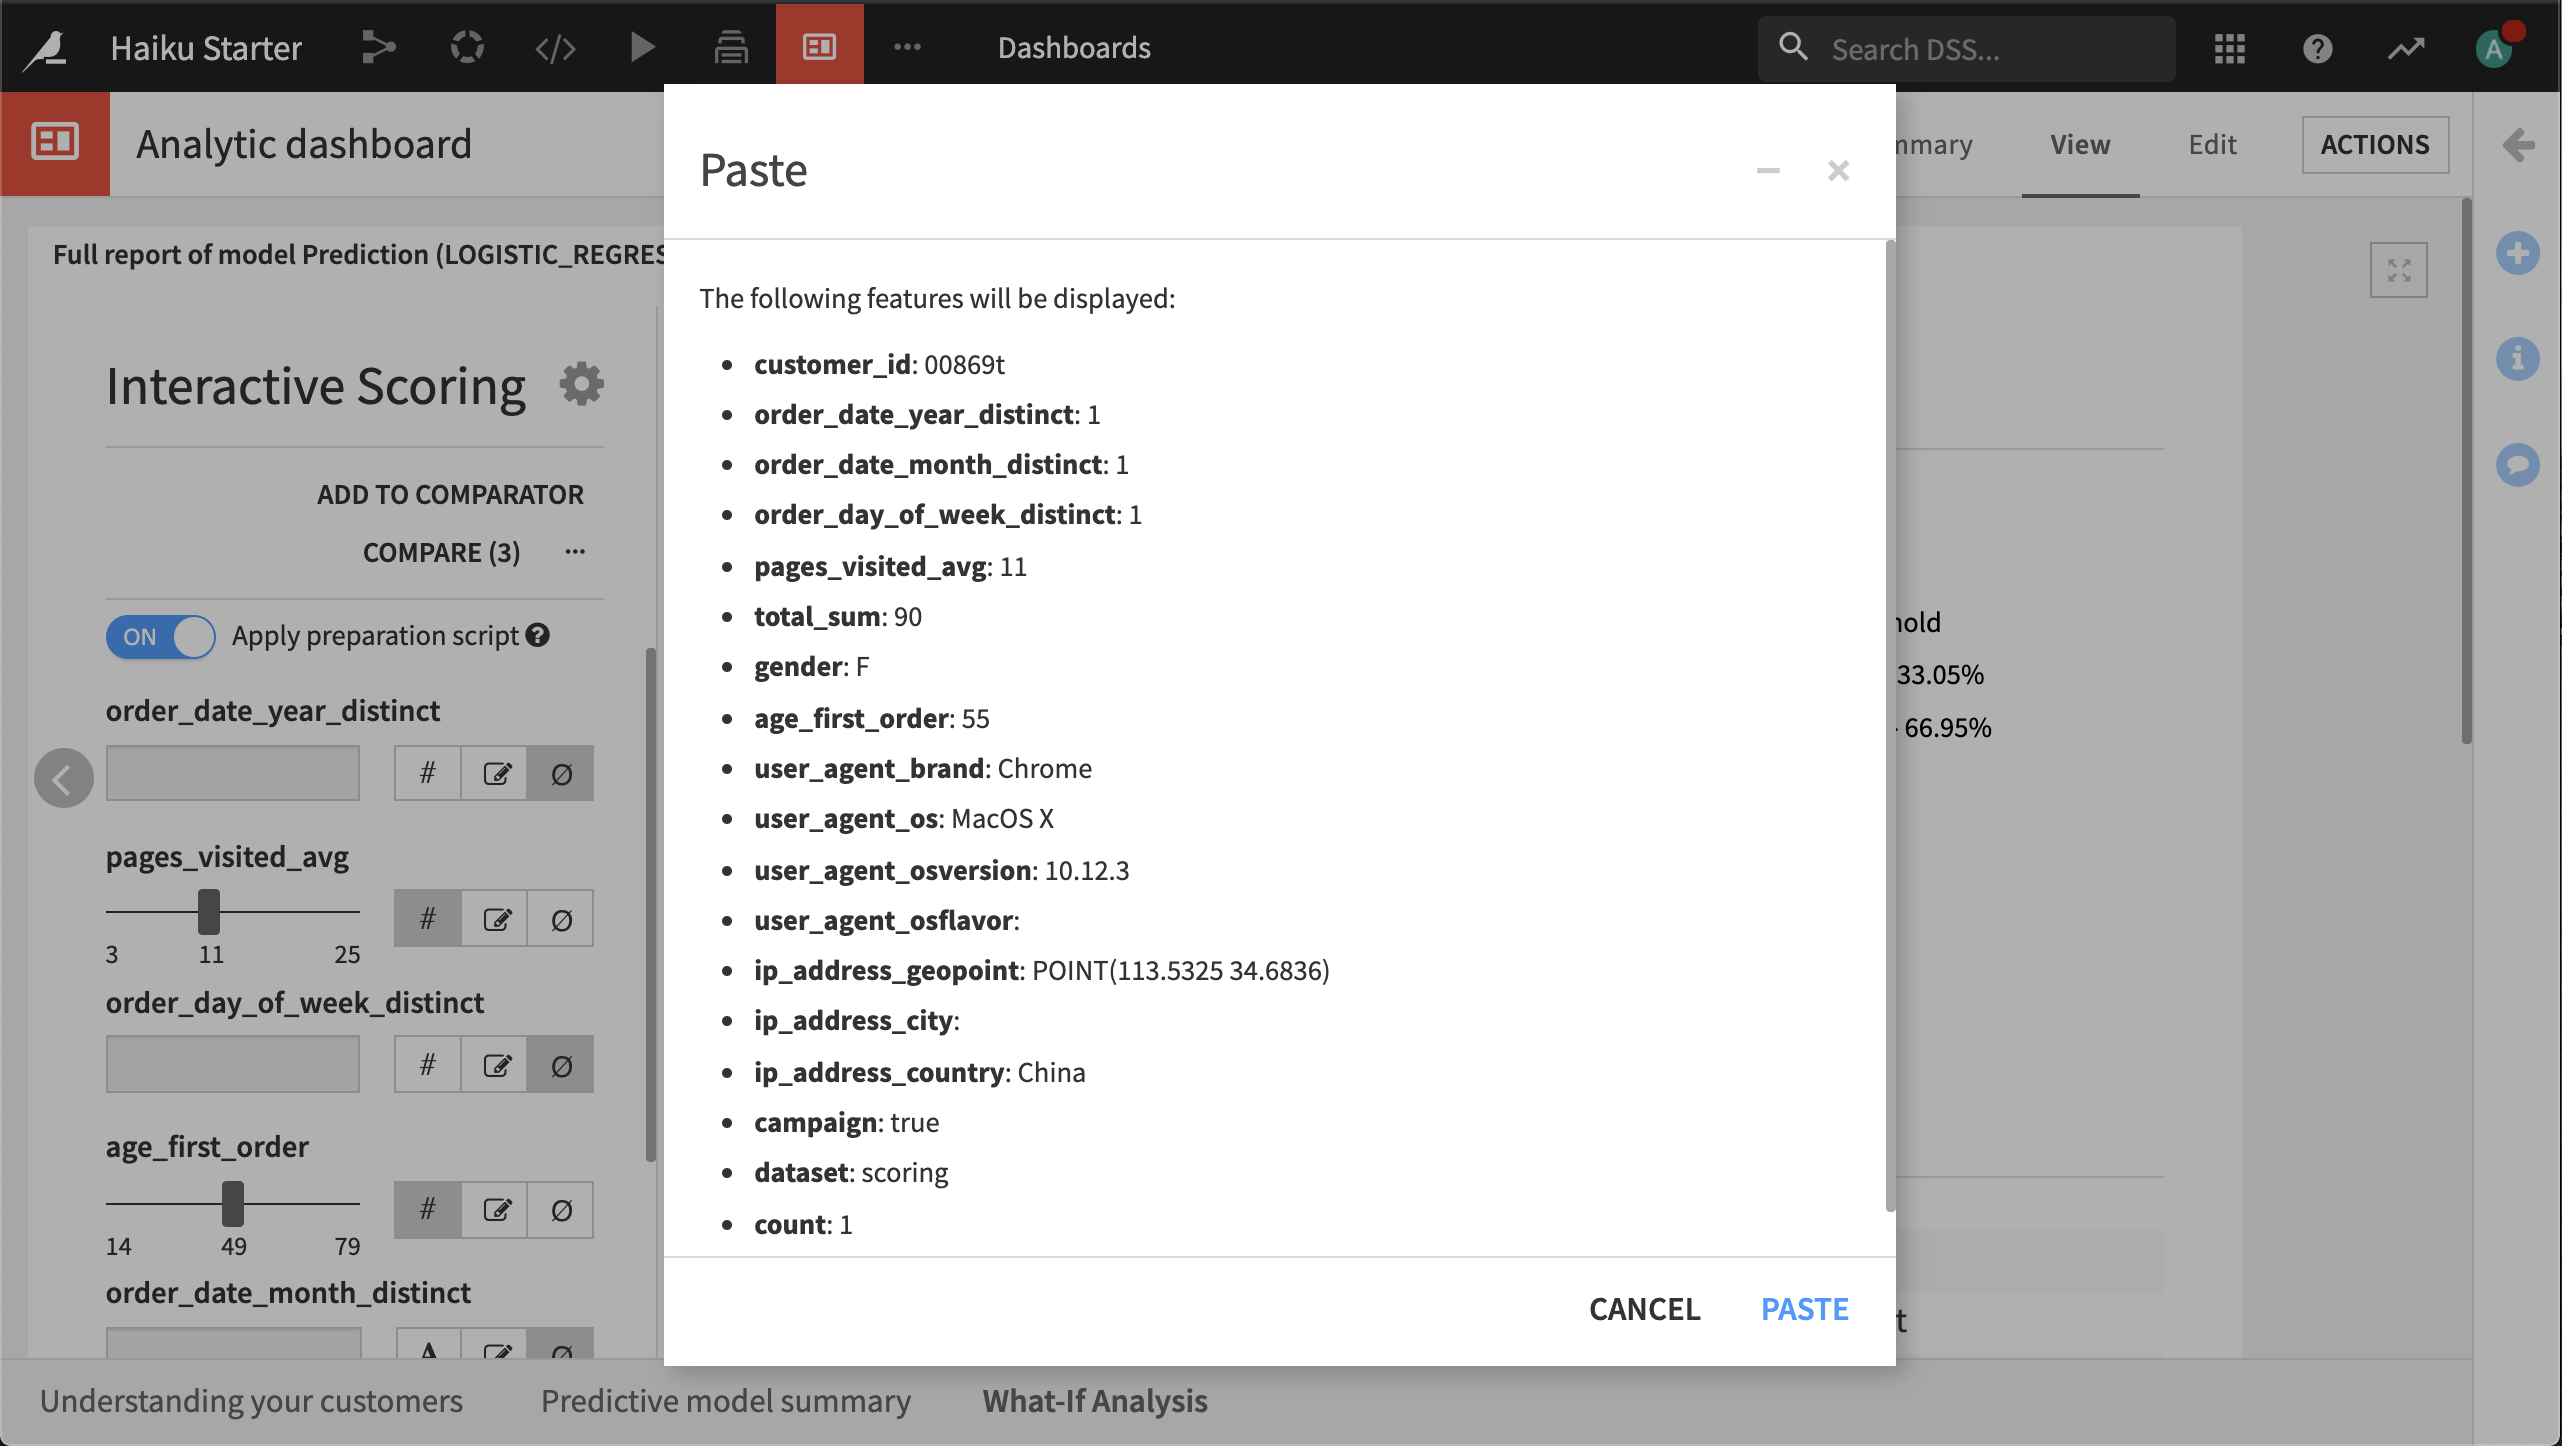
In the interactive scoring tile, click … and select Paste features, then follow the instructions in the dialog.
A dialog appears to confirm the values you will paste. Click Paste.